

Abstract
The Affordable Clean Energy (ACE) rule, the US Environmental Protection Agency's (EPA) proposed replacement of the Clean Power Plan (CPP), targets heat rate improvements (HRIs) at individual coal plants in the US. Due to greater plant efficiency, such HRIs could lead to increased generation and emissions, known as an emissions rebound effect. The EPA Regulatory Impact Analysis for the ACE and other analyses to date have not quantified the magnitude and extent of an emissions rebound. We analyze the estimated emissions rebound of carbon dioxide (CO2) and criteria pollutants sulfur dioxide (SO2) and nitrogen oxides (NOX), using results from the EPA's power sector model, under the ACE in 2030 at model coal plants and at the state and national levels compared to both no policy and the CPP. We decompose emissions changes under a central illustrative ACE scenario and find evidence of a state-level rebound effect. Although the ACE reduces the emissions intensity of coal plants, it is expected to increase the number of operating coal plants and amount of coal-fired electricity generation, with 28% of model plants showing higher CO2 emissions in 2030 compared to no policy. As a result, the ACE only modestly reduces national power sector CO2 emissions and increases CO2 emissions by up to 8.7% in 18 states plus the District of Columbia in 2030 compared to no policy. We also find that the ACE increases SO2 and NOX emissions in 19 states and 20 states plus DC, respectively, in 2030 compared to no policy, with implications for air quality and public health. We compare our findings to other model years, additional EPA ACE scenarios, and other modeling results for similar policies, finding similar outcomes. Our results demonstrate the importance of considering the emissions rebound effect and its effect on sub-national emissions outcomes in evaluating the ACE and similar policies targeting HRIs.
Export citation and abstract BibTeX RIS

Original content from this work may be used under the terms of the Creative Commons Attribution 3.0 licence. Any further distribution of this work must maintain attribution to the author(s) and the title of the work, journal citation and DOI.
1. Introduction
The United States Environmental Protection Agency (EPA) in August 2018 released its proposed Affordable Clean Energy (ACE) rule. The ACE is the proposed replacement to the existing EPA Clean Power Plan (CPP), the carbon dioxide (CO2) emissions standard for existing power plants. EPA has a legal obligation to regulate greenhouse gas emissions from existing power plants, which was affirmed by the Supreme Court's 2007 decision in Massachusetts v Environmental Protection Agency and triggered by the EPA's formal finding in 2009 that greenhouse gas emissions endanger public health and welfare (Massachusetts v Environmental Protection Agency (EPA) 2007, US Environmental Protection Agency (EPA) 2009).
The CPP was finalized in 2015 and established state-based CO2 emissions goals for affected fossil fuel-fired power plants. The CPP identifies a number of flexible compliance options as part of the 'best system of emissions reductions' (BSER) that the EPA is charged with identifying under section 111(d) of the Clean Air Act. It allows emissions reductions to come from carbon intensity reductions at individual plants—including heat rate improvements (HRIs) or fuel cofiring at the source—or from the substitution of generation towards less carbon-intensive and zero-carbon energy sources (US Environmental Protection Agency (EPA) 2015a). Averaging across electricity generating units (EGUs) and intra- and inter-state trading among units are also allowed. Given the flexible compliance structure, the CPP can be termed a 'systems-based' standard. At the time it was finalized, it was estimated that the CPP would decrease CO2 emissions by 415 million tons, or 19%, below a business as usual base case level, or 32% below 2005 levels, by 2030 (US Environmental Protection Agency (EPA) 2015b).
The proposed ACE instead employs a narrow 'source-based' regulation, which defines and limits the legally relevant BSER as HRI opportunities at individual coal plants (US Environmental Protection Agency (EPA) 2018a). Heat rate is the amount of fuel input (Btu) used to produce a kWh of electricity; a lower heat rate indicates a more efficient unit, which emits less CO2 per kWh. As a general rule of thumb, a reduction of 10 million Btu equals roughly a one-ton reduction in CO2 for coal EGUs. There is considerable heterogeneity in the heat rate of US coal plants and substantial opportunity to make coal plants more efficient Massachusetts Institute of Technology (MIT) 2009, Sargent and Lundy 2009, SFA 2009, DiPietro and Krulla 2010, Campbell 2013, Linn et al 2014, Staudt and Macedonia 2014). The ACE sets standards for emissions rate improvements at facilities, but because these standards are based solely on estimated potential for HRIs, we refer to this type of source-based option as a HRI standard. The ACE does not include fuel cofiring among its described emission reduction options. States would be required to submit plans to EPA to implement the rule, taking into account criteria such as remaining useful life, and it is possible states would propose to allow cofiring to achieve comparable emissions reductions. The ACE also allows for the possibility that states determine that no emissions reduction options are feasible.
With the issuance of the proposed replacement regulation, the EPA released a Regulatory Impact Analysis (RIA) that models emissions under the ACE compared to a reference scenario with the CPP and a scenario with no power plant carbon standard (US Environmental Protection Agency (EPA) 2018b). The RIA includes projections of national power sector emissions outcomes, but does not examine or quantify the role that a potential emissions rebound effect may play in driving the emissions outcomes. The rebound effect is a phenomenon in which facilities with high baseline emissions rates are made more efficient through investments to reduce their heat rates, and consequently operate more frequently and remain in operation for a longer period. This phenomenon is well documented in the environmental economics literature, though the majority of evidence focuses on energy efficiency (Greening et al 2000, Sorrell et al 2009). Previous studies have found evidence that an emissions rebound effect can diminish emissions reductions or even lead to emissions increases following HRIs at high-emissions facilities (Linn et al 2014, Keyes et al 2018), but no other studies have specifically examined the role of an emissions rebound in the ACE.
We analyze the model plant level results published by EPA to better understand the predicted impact of the ACE on CO2 emissions from coal plants and the potential impact on total CO2 emissions at national and state levels (US Environmental Protection Agency (EPA) 2018b). We also analyze the changes in emissions of co-pollutants including sulfur dioxide (SO2) and nitrogen oxides (NOX), which affect local air quality and human health.
We conduct a formal decomposition analysis of the estimated national changes in generation and CO2 emissions between the ACE and a no-policy scenario to examine the underlying drivers of the emissions changes and to estimate the contribution of a potential emissions rebound effect. We provide decomposition results for states that are estimated to experience emissions increases under the source-based ACE rule.
Our analysis largely evaluates the impacts of the ACE based on 2030 projections for a central case we selected from EPA's three illustrative ACE modeling scenarios. In addition, we compare these results to emissions results for 2021–2050 and for the EPA's two other illustrative ACE cases.
This analysis builds upon a study by the same authors that independently models potential national and state-level CO2 emissions impacts in 2030 for a source-based scenario compared to a scenario with no power plant carbon standard and to a flexible systems-based scenario similar to the CPP (Keyes et al 2018). Our findings on the emissions rebound effect are compared to the results of Keyes et al (2018).
2. Methods
2.1. Data
We conduct our analysis using results from the EPA's policy scenario modeling for the ACE RIA. EPA used the Integrated Planning Model (IPM) to estimate power sector outcomes from 2021 to 2050. IPM is a dynamic linear programming engineering-economic model of the US power sector. It maps almost 13 000 existing and planned EGUs into about 1700 model plants. The model differentiates power sector outcomes into demand and supply regions and accounts for interstate electricity trade. IPM is solved with fixed electricity demand. EPA uses IPM to project emissions of CO2 and co-pollutants and a number of other outcomes under various policy scenarios.7
Five scenarios were modeled using IPM: a scenario with no power plant carbon standard, an illustrative scenario with the CPP, and three illustrative ACE scenarios that represent potential state determinations of performance standards and compliance with those standards (US Environmental Protection Agency (EPA) 2018b). The CPP scenario assumes a rate-based implementation applied only to existing fossil-fired EGUs, one of multiple options available to states. Each ACE scenario assumes uniform HRI potential at all coal plants and uniform cost per kW of HRI investment. The ACE scenarios differ in their assumptions about the status of the New Source Review (NSR) provision of the US Clean Air Act. NSR currently requires permitting for major generation sources that make major modifications. The ACE introduces a change in NSR to allow major sources to avoid triggering NSR if modifications do not affect their hourly rate of emissions. The first ACE scenario, 2% HRI at $50 kW−1 at coal plants, assumes that the EPA's proposed revisions to the NSR requirements are not implemented and therefore identifies relatively modest opportunities for HRIs; the second scenario, 4.5% HRI at $50 kW−1, assumes NSR revisions are implemented and identifies greater opportunities for HRIs; and the third scenario, 4.5% HRI at $100 kW−1, also assumes NSR revisions are implemented but assumes HRIs have a higher cost, which is more appropriate for plants with relatively low capacity or limited remaining useful life.
Our analysis uses the published output from EPA's IPM model runs. We use the IPM State Emissions datasets to examine total emissions of CO2 and co-pollutants SO2 and NOX at the state and national level. Additionally, we use the IPM RPE datasets, which provide projections of fuel generation and emissions (CO2, SO2 and NOX) for each model plant to evaluate outcomes. Our analysis focuses on emissions outcomes in 2030 for the 4.5% HRI at $50 kW−1 scenario compared to the CPP and no-policy scenarios. We choose this scenario as our ACE central case because it incorporates the implementation of EPA's proposed NSR reform and a lower cost of HRI investment. We also compare these results with the other two ACE scenarios and to results for 2021–2050.
2.2. Decomposition analysis
To analyze estimated changes in EGU generation and associated emissions, we use a logarithmic mean decomposition index approach, based on Ang (2015). We implement Model 1 in table 1 of Ang (2015) and substitute CO2 emissions for energy consumption (E) and electricity generation for industrial output (Q). This method follows from that used in Palmer et al (2018) to decompose modeled emissions changes under a carbon tax. We estimate the contribution of three factors to the change in emissions under the ACE compared to the no-policy scenario: activity, structure, and intensity. The activity factor is emissions changes associated with changes in total electricity generation; the structure factor is emissions changes associated with shifts in generation among fuel types; and the intensity factor is emissions changes associated with changes in emission intensity within fuel types.
Table 1. National power sector CO2 emissions (million short tons).
| No policy | CPP | 4.5% HRI at $50 kW−1 (ACE central case) | 2% HRI at $50 kW−1 | 4.5% HRI at $100 kW−1 | |
|---|---|---|---|---|---|
| 2021 | 1710 | 1701 | 1709 | 1709 | 1707 |
| 2023 | 1801 | 1754 | 1814 | 1801 | 1802 |
| 2025 | 1829 | 1780 | 1812 | 1816 | 1799 |
| 2030 | 1811 | 1737 | 1797 | 1798 | 1785 |
| 2035 | 1794 | 1728 | 1787 | 1783 | 1772 |
| 2040 | 1849 | 1782 | 1841 | 1840 | 1829 |
| 2045 | 1843 | 1782 | 1832 | 1833 | 1821 |
| 2050 | 1804 | 1753 | 1815 | 1801 | 1808 |
| 2021–2050 cumulative (interpolated) | 54 469 | 52 694 | 54 261 | 54 195 | 53 920 |
The emission intensity of fuel types (the intensity factor) is the factor targeted by a HRI standard and it can change when a policy causes various fossil fuel plants to improve their efficiency. Under a HRI standard, the intensity factor contributes to emissions reductions if the standard successfully reduces the emission intensity of coal plants.
The rebound effect is embodied in changes in the generation mix (the structure factor), which changes when a policy affects the relative competitiveness of generation sources. This can occur under a HRI standard if the standard improves the efficiency of coal plants and thus causes substitution towards coal away from other, lower-emitting generation sources. Our estimate of the rebound effect is likely conservative because the EPA's model holds total demand constant. If demand were allowed to change, the rebound effect would include both the structure factor and the activity factor. Change in demand can occur if the increased efficiency of coal lowers the cost of electricity generation and thus increases total electricity demand, as would be expected in organized wholesale power markets. In regulated markets, these investments could increase or decrease total costs, depending on the reason such investments are previously unrealized. Reasons could include inconsistent pass-through clauses, avoidance of triggering NSR, access to capital, and uncertainty about greenhouse gas regulations (Richardson et al 2011, Campbell 2013, Linn et al 2014). However, under constant demand, at the national level the activity factor in our analysis is not directly associated with the rebound effect. At the state-level, a change in the activity factor can be associated with the rebound effect because changes in trade flows across states can lead to a net change in generation in some states. This effect is absorbed into the structure factor at the national level. Although electricity demand is held constant, total electricity generation (the activity factor) can still differ on the national level across model scenarios for several reasons: policies may cause changes in trade flows between the US and Canada, or changes in state or regional generation within the US. These changes may affect the total amount of electricity transferred between regions, thus affecting total losses and generation.
3. Results
3.1. National and state-level CO2 emissions changes
National CO2 emissions are projected to be slightly lower under the ACE compared to no policy, and higher compared to the CPP, in all modeled years but 2050 (table 1). In 2050, two of the three ACE scenarios have higher CO2 emissions compared to no policy. Cumulative CO2 emissions from 2021 to 2050 are slightly lower under all three ACE scenarios compared to no policy and slightly higher compared to the CPP. In 2030, compared to no policy, CO2 emissions are projected to be 0.8% lower under the 4.5% HRI at $50 kW−1 scenario, 0.7% lower under the 2% at $50 kW−1 scenario, and 1.5% lower under the 4.5% at $100 kW−1 scenario.
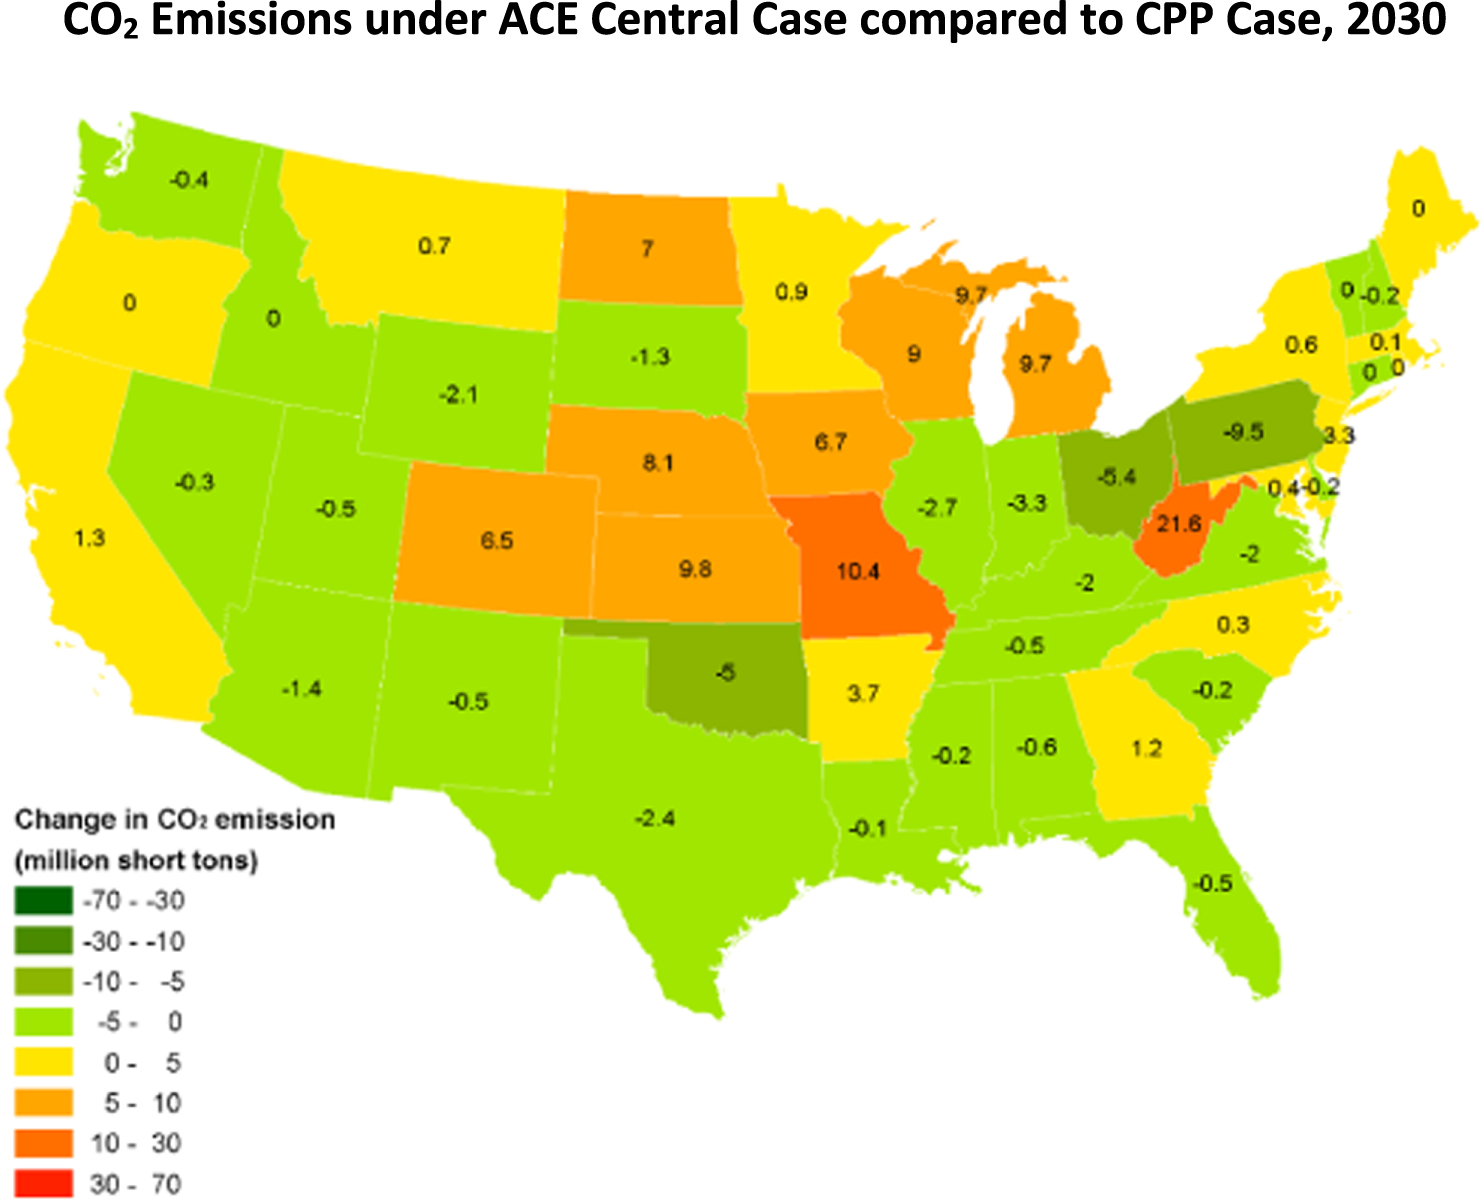
There is substantial variation in state-level outcomes under the ACE. For the 4.5% HRI at $50 kW−1 scenario, 18 states plus the District of Columbia are projected to experience at least small increases in CO2 emissions in 2030 compared to no policy (figure 1). The numbers are similar for the other two ACE scenarios: 16 states plus Washington, DC for the 2% at $50 kW−1 scenario and 14 states plus Washington, DC for the 4.5% at $100 kW−1 scenario. Compared to the CPP, 22 states and Washington, DC are projected to have emissions increases under the 4.5% HRI at $50 kW−1 ACE scenario (figure 2).8
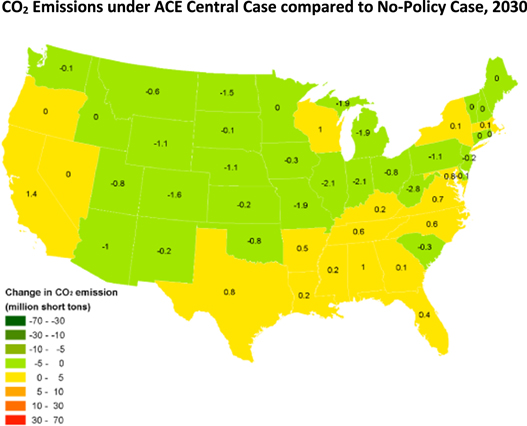
Figure 1. CO2 emissions under ACE central case compared to No-Policy case, 2030.
Download figure:
Standard image High-resolution image
Figure 2. CO2 emissions under ACE central case compared to CPP case, 2030.
Download figure:
Standard image High-resolution image3.2. Coal-fired power plant CO2 emissions changes
We examine the impact of the ACE on model coal-fired power plants to illustrate the main drivers of emissions changes by focusing on 2030 emissions for the 4.5% HRI at $50 kW−1 scenario, which is our ACE central case. IPM's model coal plants are aggregated representations of constituent coal plants within states, 381 of which were operating in the US in 2016 (US Energy Information Administration (EIA) 2017a). Under EPA's projections of ACE, CO2 emissions from coal plants are projected to be only slightly lower (0.6%) in 2030 compared to no policy (table 2). While the emissions intensity of coal plants declines by 4.5%, the number of coal plants in operation and total coal-powered electricity generation increase. This shift offsets the benefits of emissions intensity improvements and causes the total emissions reduction to be small compared to the emissions intensity improvements.
Table 2. Comparison of model coal plants between ACE central case and No-Policy case, 2030.
| No policy | ACE central case | Change (level) | Change (%) | |
|---|---|---|---|---|
| Number of model coal plants in operation | 333 | 338 | 5 | 1.5% |
| Total generation (GWh) | 937 757 | 975 633 | 37 877 | 4.0% |
| Total Emissions (Thousand short tons) | 1027 456 | 1020 897 | −6559 | −0.6% |
| Emissions intensity (kg kWh−1) | 0.99 | 0.95 | −0.04 | −4.5% |
| Heat rate (Btu kWh−1) | 10 395 | 9930 | −465 | −4.5% |
Under the EPA's interpretation of section 111(d) of the Clean Air Act as constraining regulations to measures that can be taken at a source (power plant), total CO2 emissions are actually projected to increase at a number of the affected plants. Of the 333 model coal plants that would be in operation in 2030 under no policy, 93 of those (or 28%) are projected to have higher total CO2 emissions under the ACE. Additionally, under the ACE five additional model coal plants are projected to be operating in 2030 that would have been idled or retired under no policy.
3.3. Decomposition of CO2 emissions changes
The decomposition shows the extent to which the rebound effect is projected to offset emissions reductions under the ACE. Total national emissions under the ACE are estimated to decrease by 14.3 million short tons (0.8%) compared to the no-policy scenario in 2030. Our decomposition analysis breaks down the three primary factors driving that change in emissions (figure 3(a)). We find that reductions in emissions intensity within fuel types reduce emissions by 47.4 million tons, mainly due to the lower emissions intensity of coal generation. However, the rebound effect associated primarily with greater utilization of coal plants increases emissions by 32.4 million tons, partially offsetting the reductions from improvements in emissions intensity and resulting in smaller estimated total reductions. Note that the rebound effect is greater on a fleet basis, due to substitution to more efficient units, than researchers have estimated for an individual facility (e.g. Linn et al 2014). A slight increase in total electricity generation drives emissions up by an additional 0.6 million tons.

Figure 3. Decomposition of CO2 emissions change under ACE central case compared to No-Policy case. (a) National, 2030. (b) States with emissions increases, 2030. (c) Maryland, 2030.
Download figure:
Standard image High-resolution imageFor the 18 states plus DC projected to experience higher CO2 emissions in 2030 under the ACE compared to no policy (figure 1), total CO2 emissions are expected to increase by 8.5 million tons. Decomposition reveals that emissions intensity improvements drive down emissions by 14.3 million tons, but these reductions are more than offset by generation mix shifts that drive up emissions by 21.4 million tons and greater total generation that drives up emissions by 1.4 million tons (figure 3(b)). This rebound effect is caused mostly by shifts towards increased coal generation. Of the 18 states that experience total increases in CO2 emissions, 14 states experience an emissions increase from coal-fired power plants in their state. In the other four states (California, Georgia, Massachusetts, and Oregon) plus DC, the emissions increases are mainly due to increased emissions from natural gas. Increases in state-level natural gas emissions could occur for several reasons that are specific to state and regional electricity markets. This pattern exposes another unintended consequence of the ACE that could diminish emissions reductions in some states.
Maryland has the greatest percent increase in emissions under the ACE compared to no policy in 2030 (8.7%) and provides an informative illustration of the emissions rebound effect. Maryland has two model coal plants in operation under the ACE, neither of which would be in operation with no policy in place. Thus, the shift in the generation mix towards coal drives up emissions by 0.8 million tons and causes an overall increase in emissions in the state (figure 3(c)).
Interstate trade in electricity can exacerbate the emissions rebound in some states, because coal EGUs that become more efficient may compete not only with EGUs in their state but also others in their power market region. For example, the emissions intensity of coal in a net electricity exporting states like Alabama improves in 2030 under the ACE compared to no policy. However, coal generation and total generation increase in the state, suggesting that electricity exports increase. The increase in fossil generation drives up emissions by 2.2 million tons, offsetting the emissions intensity improvements and resulting in a net increase in emissions by 1 million tons.
3.4. Criteria air pollutant emissions changes
National SO2 emissions in 2030 are projected by EPA to decrease by 0.7% under the ACE compared to no policy, with 19 states showing SO2 emissions increases (figure 4). National NOX emissions are projected by EPA to decrease by 1.0%, with 20 states plus DC showing emissions increases (figure 5). Compared to the CPP, national SO2 emissions are projected by EPA to be 5.9% higher under the ACE and NOX emissions are projected to be 5.0% higher.
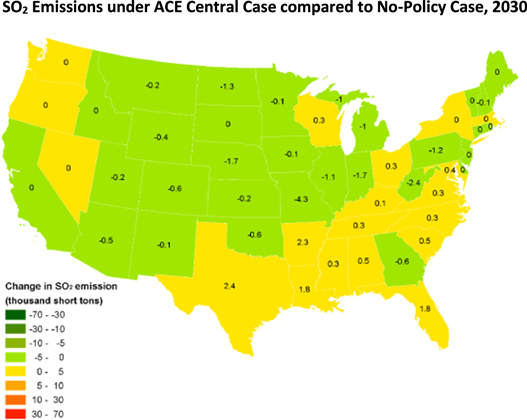
Figure 4. SO2 emissions under ACE central case compared to No-Policy case, 2030.
Download figure:
Standard image High-resolution image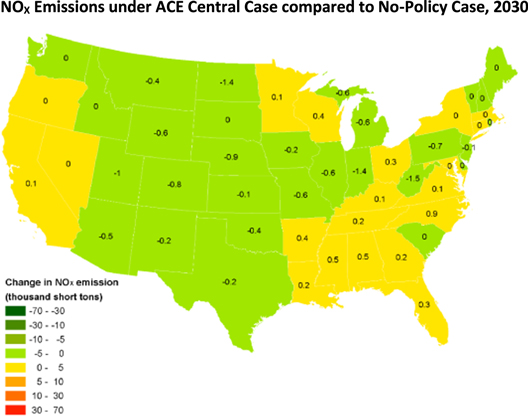
Figure 5. NOX emissions under ACE central case compared to No-Policy case, 2030.
Download figure:
Standard image High-resolution image
4. Discussion
4.1. Comparison of results
Our analysis of ACE impacts using EPA's RIA demonstrates the potential for a rebound effect to occur and limit decrease emissions reductions. Previous studies have found evidence that a rebound effect is associated with HRIs at high-emissions rate facilities, and changes in the operation of these facilities diminishes the reduction in emissions that would otherwise occur (Linn et al 2014). Moreover, because these facilities have lower operating costs after the HRIs are made, they are likely to delay their ultimate retirement and may remain in service longer into the future (Burtraw et al 2011). Our analysis suggests this is the case, because by 2050 CO2 emissions under the ACE exceed emissions under no policy. This consideration is important since CO2 is a stock pollutant that accumulates in the atmosphere each year.
We compare the results of this analysis to another study by the same authors (Keyes et al 2018), in which the spatially explicit effects of scenarios constructed independently but similar to the ACE are modeled, including a source-based HRI standard. Keyes et al (2018) uses results from IPM to compare their source-based scenario to a no-policy scenario and a systems-based scenario similar to the CPP. Because the modeling conducted for Keyes et al (2018) is independent from that used by EPA in its ACE RIA, it provides an alternative estimate of emissions outcomes. Importantly, the results based on EPA's modeling can be compared only qualitatively to the Keyes et al modeling results because baseline economic conditions differ between the two sets of model runs. Keyes et al (2018) uses power sector modeling based on the electricity industry as it was configured in 2014, and the industry has since undergone substantial changes including retirement of many fossil units. Coal generation declined from 40% of total power generation in 2013 to 31% of total generation in 2017, and overall fossil fuels supplied 62% of total generation in 2017 compared to 67% in 2013 (US Energy Information Administration (EIA) 2018). The analyses also employ different assumptions about policy design and implementation. For example, the source-based standard used in Keyes et al (2018) includes cofiring up to 15% with natural gas or biomass as a compliance option, while the ACE does not consider cofiring as a candidate technology for BSER. Therefore, emissions projections in the EPA modeling results are lower for the No-Policy case and the estimated emissions impacts of the source-based policy are smaller compared to Keyes et al (2018) (table 3). However, Keyes et al (2018) affirm the finding that a rebound effect could lead to emissions increases at individual plants and in some states based on the EPA's modeling.
Table 3. Comparison of source-based scenario modeling results for 2030.
| Current analysis based on EPA's ACE RIA | Keyes et al (2018) | |
|---|---|---|
| CO2 emissions under source-based scenario, million short tons | 1797 | 2386 |
| CO2 emissions under no policy scenario, million short tons | 1811 | 2451 |
| Difference | −0.8% | −2.6% |
| CO2 emissions under systems-based scenario, million short tons | 1737 | 1466 |
| Difference | 3.5% | 63% |
| Number of states with emissions increase compared to no policy scenario | 18 states plus DC | 8 states |
| Number of states with emissions increase compared to systems-based scenario | 22 states plus DC | 46 states |
A notable result from EPA's RIA modeling is that the impact of the CPP on CO2 emissions compared to no policy is small (4% reduction in 2030) compared to Keyes et al (2018), EPA's 2015 RIA for the CPP final rule and the Energy Information Administration's 2017 Annual Energy Outlook (US Environmental Protection Agency (EPA) 2015b, US Energy Information Administration (EIA) 2017b). One reason for the relatively small impact of CPP in the ACE re-analysis is that EPA's ACE No-Policy case includes less fossil fuel generation than previous RIAs. Another reason is the set of assumptions that EPA uses for CPP implementation in the ACE RIA, which assumes coverage only for existing generation sources rather than existing and new sources and no incremental energy efficiency investments. These assumptions reduce the projected emissions benefits under the CPP.
The proposed ACE rule, in addition to suggesting changes to power plant carbon standards, also would reform the NSR program for new and significantly modified facilities. As discussed above, the reform to NSR would allow power plants to avoid NSR review as long as their hourly rate of emissions do not increase. This reform may create a loophole for some plants to adopt HRI measures and potentially increase emissions. EPA's projections for the scenario incorporating NSR reform (4.5% HRI at $50 kW−1) and a scenario without NSR reform (2% HRI at $50 kW−1) shows minor impacts of NSR reform on CO2 emissions.
4.2. Policy Implications
The CO2 emissions impacts of the ACE have implications for the 20 states that have adopted greenhouse gas emissions targets (Center for Climate and Energy Solutions (C2ES) 2018). Twenty-two states plus DC are projected to have higher emissions under the ACE compared to the CPP, and 11 of these states plus DC currently have greenhouse gas emissions targets in place. These states can be expected to face more difficulty achieving their targets due to the replacement of the CPP. Further, of the 18 states and DC projected to experience higher CO2 emissions compared to no policy, seven—California, DC, Florida, Maryland, Massachusetts, New York and Oregon—have greenhouse gas emissions targets. For these states, achieving their emissions targets may be more difficult under the ACE compared to having no federal power plant carbon standard in place.
The possibility for the rebound effect to lead to emissions increases at individual plants and for entire states raises the question whether the HRI standard proposed under the ACE qualifies as the 'BSER' that EPA is charged with identifying in its development of a power plant carbon standard under section 111(d) of the Clean Air Act. The projected impact of the rebound effect on CO2 emissions under the ACE should be taken into consideration in determining whether the BSER requirement has been satisfied.
The change in emissions of co-pollutants under the ACE also has implications for regional air quality and public health. SO2 and NOX are precursors to ambient PM2.5 and NOx emissions contribute to ambient ozone, both of which have effects on premature mortality and morbidity. States with increased emissions may experience greater difficulty achieving or maintaining the US National Ambient Air Quality Standards established under the Clean Air Act. EPA estimates that, nationally, the ACE will lead to a slightly lower number of PM2.5- and ozone-related premature deaths compared to no policy in 2030, but it estimates that the ACE will substantially increase premature deaths compared to the CPP.
5. Conclusions
Our analysis finds that the projected emissions rebound effect in EPA's ACE RIA undermines emissions reductions from the ACE rule compared to both the CPP and to no power plant carbon standard. Although the emissions intensity of modeled coal plants decreases, the number of operating coal plants and the amount of coal-powered electricity generation increases. Under the ACE central case, the rebound effect causes emissions to increase at 28% of coal plants in 2030. As a result, total CO2 emissions increase in 18 states plus DC and national CO2 emissions decrease by only 0.8% in 2030. Further, emissions of SO2 decline by only 0.7% with increases in 19 states, and emissions of NOX decline by 1.0% with increases in 20 states plus DC. The other ACE scenarios evaluated show similar outcomes driven by a rebound effect.
Our finding that under a source-based power plant standard the rebound effect can undermine pollutant emissions decreases at the national level and lead to increased emissions at individual coal plants and in a number of states is substantiated by similar findings based on independent power sector modeling (Keyes et al 2018). This result, which was not examined in the RIA for the ACE proposed rule, has implications for the defensibility of the ACE as the BSER, for the ability of some states to achieve their greenhouse gas emissions reduction targets, and for jurisdictions that experience poor air quality to protect public health.
Acknowledgments
The authors thank Habibollah Fakhraei for preparing the emissions maps and ICF for IPM modeling.
Footnotes
- 7
See US Environmental Protection Agency (EPA) (2018b) for a detailed description of modeling assumptions and inputs.
- 8
Conversely, 25 states are projected to have lower emissions under the the 4.5% at $100 kW−1 scenario compared to the CPP. This is because the CPP creates performance standards for fossil generation sources, and emissions at EGUs can increase under the CPP if their level of generation increases. The CPP is a flexible standard aimed at achieving system-wide emissions reductions.