

Abstract
Global agriculture is challenged to increase soil carbon sequestration and reduce greenhouse gas emissions while providing products for an increasing population. Growing crop production could be achieved through higher yield per hectare (i.e. intensive farming) or more hectares (extensive farming), which however, have different ecological and environmental consequences. Multiple lines of evidence indicate that expanding cropland for additional production may lead to loss of vegetation and soil carbon, and threaten the survival of wildlife. New concerns about the impacts of extensive farming have been raised for the US Corn Belt, one of the world's most productive regions, as cropland has rapidly expanded northwestward unto grasslands and wetlands in recent years. Here we used a process-based ecosystem model to distinguish and quantify how natural drivers as well as intensive and extensive farming practices have altered grain production, soil carbon storage, and agricultural carbon footprint in the US Western Corn Belt since 1980. Compared to the period 1980–2005, we found that cropland expansion more than tripled in the most recent decade (2006–2016), becoming a significant factor contributing to growing grain production. Land use change in this period led to a soil carbon loss of 90.8 ± 14.7 Tg (1 Tg = 1012 g). As a result, grain production in this region shifted from carbon neutral to a carbon loss of 2.3 kg C kg−1 grain produced. The enlarging negative carbon footprint (ΔC/ΔP) indicates the major role that cropland expansion has had on the carbon cost of grain production in this region. Therefore, we should be more cautious to pursue high crop production through agricultural cropland conversion, particularly in those carbon-rich soils.
Export citation and abstract BibTeX RIS
Introduction
Growing global demand for agricultural crops for food, feed, and fuel has propelled widespread cropland expansion, crop improvement, and management intensification, and in the meanwhile, caused tremendous environmental impacts (Tilman et al 2002, Edgerton 2009, Foley et al 2011). There is a growing consensus that expanding cropland for additional production may lead to loss of vegetation and soil carbon, and threaten the survival of wildlife while higher yields can be achieved through intensive farming practices (West et al 2010, Zhang et al 2015). The important role of agriculture in regional and global greenhouse gas (GHG) emissions has been widely recognized (Paustian et al 2016, Tian et al 2016). To mitigate global GHG emissions, agriculture must cut its share without undermining the provision of agricultural product (West et al 2010, Tian et al 2016). While carbon loss resulting from agricultural expansion is an undisputable contributor, it remains one of the largest and the most uncertain carbon fluxes in the biosphere (Fargione et al 2008, Searchinger et al 2008, Le Quéré et al 2018). Its magnitude is likely to be underestimated by modeling studies as coarse-scale land use and cover change (LUCC) data that are used for driving models have represented the sum of bi-directional changes while overlooking sub-grid land cover transitions (Arneth et al 2017, Houghton and Nassikas 2017, Le Quéré et al 2018, Yu et al 2018). Feasible agricultural GHG mitigation should be founded on in-depth understanding and quantification of carbon losses in agricultural sectors because human and natural contributions to agricultural carbon dynamics vary across crops and regions (Searchinger et al 2008).
The annual amount and long-term changes of crop production have been well documented at national and global scales through inventory and census (e.g. FAOSTAT-Food and Agriculture Organization of the United Nations and the United States Department of Agriculture, National Agricultural Statistics Service (USDA NASS)). In contrast, uncertainties still exist in understanding what are the dominant drivers of production change, and how they have altered terrestrial carbon dynamics and consequent GHG balance across agricultural lands (West et al 2010, Yu et al 2018). As a dominant GHG source, agriculture is challenged to reduce its carbon footprint (i.e. the carbon loss per unit of agricultural product produced) while feeding an increasing population (Foley et al 2011). Large GHG mitigation potentials have been pinpointed to intensively-altered landscapes such as deforested tropical rainforests and drained peatland (Baccini et al 2012, Leifeld and Menichetti 2018). On the other hand, less attention has been paid to the agricultural lands of the US in which intensive crop farming has been documented to enhance resource use efficiency and reduce the carbon footprint compared to other regions in the world (Stevenson et al 2013, Zhang et al 2015). However, new concerns have been raised in this country regarding cropland expansion spurred by the biofuel boom of the late 2000s (Lark et al 2015). Here we have investigated the carbon footprint dynamics in the US Western Corn Belt, among the world's most productive areas (Guanter et al 2014), and a region characterized by rapid cropland expansion over the past decade (Wright and Wimberly 2013, Lark et al 2015). This region, which encompasses the states of North Dakota, South Dakota, Nebraska, Minnesota, and Iowa, provided 47% and 41% of US national corn (Zea mays, L) and soybean (Glycine max) production, respectively, during 2005–2016 (NASS USDA 2017).
Data and method
Here we run the DLEM (Tian et al 2010), a process-based land ecosystem model, in the western Corn Belt at a spatial resolution of 5 arc min by 5 arc min for the period 1980–2016. We aim to distinguish and quantify the impacts of natural (including climate variability, atmospheric CO2 concentration, and nitrogen deposition) and anthropogenic drivers (i.e. LUCC and crop type rotation) on changes of grain crop production and carbon storage. Before running at a regional scale, the DLEM model has been rigorously calibrated in this region and its performance in simulating crop production and soil organic carbon (SOC) stocks has been widely validated against site-level measurements and state-level survey (supplementary figures S1 and S2 is available online at stacks.iop.org/ERL/13/124007/mmedia). We set up a series of simulation experiments (see Methods) to detect the changing trend of carbon storage, grain crop production, and agricultural carbon footprint during two periods: a reference period from 1980 to 2005 in which land use change in this region was relatively small, and a rapid LUCC period from 2006 to 2016. Note that the agricultural carbon footprint defined here (i.e. ratio of carbon stock change to crop production change) only takes soil carbon storage change into account, because biomass in cropland is a short-term carbon pool which eventually returns to the atmosphere or aquatic system somewhere else through harvesting and consumption. We also exclude carbon emission from fossil fuel combustion during cultivation, harvesting, and product transportation. Negative carbon footprints represent SOC loss per unit crop product gain, while positive values indicate carbon gain as production increases. Enlarged carbon footprint in a negative direction reflects an increasing carbon cost of per unit yield gain.
Methods
The DLEM is a process-based ecosystem model, which couples major plant physiological, biogeochemical, hydrological cycles, and vegetation dynamics to make daily, spatially-explicit estimates of carbon, N, and water fluxes and pool sizes in terrestrial ecosystems (Tian et al 2010, Lu and Tian 2013). To capture the legacy effect of land use change, we started the model run from 1850 while analysis in this study focused on the period 1980–2016. The model used updated datasets that include daily climate conditions (average, minimum and maximum temperature, precipitation, shortwave radiation, and relative humidity), annual LUCC, monthly concentration of atmospheric CO2, annual nitrogen deposition, and agricultural management practices such as nitrogen fertilizer use, irrigation, manure nitrogen application, tillage and tile drainage, at various time steps (Cao et al 2018, Yu and Lu 2018, Yu et al 2018).
Model drivers
Land use history and crop rotation
By incorporating various sources of inventory data and high-resolution satellite images, we reconstructed annual cropland density maps at 1 km resolution (Yu and Lu 2018), to represent the area and distribution of cultivated land in the US from 1850 to 2016. The cropland maps delineate the land being cropped annually, excluding pasture, and the land under summer idle/fallow. In DLEM, each grid cell is a cohort of up to four natural plant functional types and one cropping system whose area percentage is identified by time-series land use and cover maps. In this study, the land use data were resampled to 5 arc min and used to drive the DLEM model. Furthermore, we made improvements by replacing state-level cropland area survey with USDA county-level inventory during 1973–2016, while county-level data before the year 1973 were not used due to excessive missing values (see supplementary material). To characterize crop types and their rotation (e.g. continuous corn, corn-soybean rotation) in each 5 min pixel across years, annual maps of crop type (figure S4 in supplementary material) were reconstructed using satellite images and the USDA National Agricultural Statistics Service (NASS) county-level survey data (Yu et al 2018).
In this study, we adopted the trajectory approach used in Lark et al (2015, 2017) to identify areas experiencing continuous cropland expansion (CCE) and abandonment at a resolution of 1 km × 1 km in the periods of 1980–2005 and 2006–2016 (supplementary figure S5). Lark et al (2015) reported national cropland area change during 2008–2012, and our estimate in the Western Corn Belt during the same period (cropland expansion and abandonment of 1.08 Mha and 0.34 Mha, respectively) is very close to theirs. But we found the expanded croplands in Central Minnesota and Southern Iowa identified in Lark et al (2015) were abandoned after 2008 (supplementary figure S6), and therefore were excluded by the recent-decade cropland expansion in our result (figure 1). Due to coarse-resolution land use data in the period before 1980, we developed a module to identify CCE and abandonment areas based on six years accumulated cropland area change (more details can be found in supplementary material). Besides, we reconstructed wetland distribution maps by combining cropland data layer (CDL) satellite images and state-level National Wetlands Inventory data (NWI, https://fws.gov/wetlands/). However, it should be noted that CDL-based classification system has undergone changes over time (Kline et al 2013, Lark et al 2017), which may have introduced biases when we attribute model-estimated SOC change to different biomes.
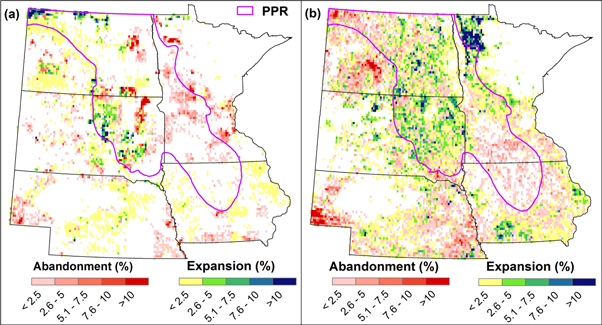
Figure 1. Cropland expansion (other land converted to cropland) and abandonment (cropland converted to non-cropland) in the US Western Corn Belt during (a) 1980–2005 and (b) 2006–2016 from trajectory analysis of the cropland data layer (CDL), and Yu and Lu (2018). Purple line shows the boundary of the US Prairie Pothole Region (PPR).
Download figure:
Standard image High-resolution imageAgricultural management data
Based on the aforementioned cropland density and crop type maps, we harmonized the state-level crop-specific fertilizer use data released by USDA NASS and Statistical Bulletins to develop the geospatial data set of historical nitrogen fertilizer application rate in the contiguous US during 1850–2015 (Cao et al 2018). Along with these data, we also developed fine-resolution data to characterize spatial and temporal patterns of national nitrogen fertilizer application timing and the ratio of  across the study period. Spatial maps of tillage intensity were obtained from USGS (Baker 2011) (https://pubs.usgs.gov/ds/ds573/), aggregating from survey-based, county-level tillage data in the US covering the period of 1989 to 2004. Manure data were obtained from Yang et al (2016) at 5 arc min × 5 arc min resolution. Crop technology improvement (e.g. plant breeding) was represented in the DLEM through two mechanisms: (1) increased harvested amount of a given crop by crop-specific time-series harvest index, and (2) enhanced productivity by improvement of nitrogen uptake. The impact of crop improvement on the enhancement of yield per area of land cultivated was calibrated against national crop yield records (NASS USDA 2017) for each crop type. More details are shown in supplementary tables S6–S7 in supplementary material.
Climate, CO2 and nitrogen deposition data
Daily climate data (temperature, precipitation, relative humidity, and shortwave radiation) were downloaded and resampled to 5 arc min × 5 arc min from the high-resolution gridded time-series dataset TS 2.1 by the Climatic Research Unit (CRU) of the University of East Anglia and North America Regional Reanalysis (NARR) dataset from a combination of modeled and observed data (Mitchell and Jones 2005, Mesinger et al 2006). Historical atmospheric CO2 concentrations were retrieved from IPCC CO2 data and published results from Liu et al (2013) and Wei et al (2014). The annual N deposition gridded maps were developed by interpolating Dentener's three-year N deposition data with N emission patterns from EDGAR (Dentener 2006, Wei et al 2014).
Model calibration and validation
The DLEM model has been intensively calibrated at both site- and regional scales through its development (Tian et al 2010, 2011a, 2011b, Ren et al 2011a, 2011b, Tao et al 2013). In our previous study (Yu et al 2018), we conducted rigorous model calibration and validation in the US against published results from the long term ecological research network, long-term agroecosystem research network, and measurements at flux towers. Specifically, model validations of SOC and net primary productivity (NPP) in the Western Corn Belt have shown good agreement between simulations and observations (supplementary figure S2).
Model simulated crop yield and production were validated against historical survey data provided by USDA (see supplementary figure S1). Specifically, the crop production of major grain crops and model simulated crop NPP were converted to dry grain weight (Million Metric Tons) for comparison using method published in Prince et al (2001) and Li et al (2014). The equation for converting modeled NPP of a grain crop to production is:
where Production is the modeled crop production in terms of dry grain weight, fdry is a factor to convert the mass to dry biomass, fcarbon is a C content factor to convert the dry biomass to C (we use 450 g C kg−1), HI is the harvested index, and RS is the root/shoot ratio. The crop-specific parameterization in crop production estimation follows the approach used by Li et al (2014) and more details can be found in the supplementary material.
Simulation experiment design and implementation
The DLEM model is designed to capture sub-daily and daily dynamics of major ecosystem processes (e.g. 0.5, 4.0, and 24 h for river routing, soil water movement, and plant physiological and biogeochemical processes, respectively). The baseline of carbon, nitrogen, and water pools in the study area were initialized to an equilibrium state by setting the input drivers to the level of 1850 (we used de-trended climate data randomly selected between 1900 and 1930 to represent climate conditions before 1900). The equilibrium state is held to occur when the internal variations of net carbon, nitrogen, and water fluxes are less than 1 g C m−2 yr−1, 1 g N m−2 yr−1, and 1 mm m−2 yr−1, respectively, within a 20-year simulation cycle. Then a ten-year spin-up run using climate data randomly picked between 1900 and 1930 was implemented to avoid sudden changes as the simulation shifts from the equilibrium to transient states. In the DLEM, algorithms similar to the bookkeeping approach were adopted to describe the short-term immediate carbon release due to crop cultivation following land clearing (Houghton et al 1983). Specifically in the model simulation, cropland expansion will trigger carbon and nitrogen loss (see supplementary table S4). Meanwhile, the long-term (legacy) decomposition and accumulation of SOC after land conversion is also represented in the model by mimicking the changes of carbon sequestration, allocation, vegetation turnover (i.e. litterfall), and SOC decomposition in natural and agricultural biomes.
We set up a series of model simulation experiments to quantify crop production and soil carbon storage change in response to various natural and anthropogenic drivers. The first simulation experiment (S1) was designed to produce our 'best estimate' of carbon storage and crop production in the US Western Corn Belt, which was driven by historically varying climate, nitrogen deposition, atmospheric CO2, land conversion and crop rotation, crop technology improvement, and agricultural management practices (e.g. fertilizer use, manure application, irrigation, tillage, and tile drainage). The second simulation experiment (S2) was designed to keep all the above-mentioned drivers unchanged since 1980, which served as a 'reference run', aiming at estimating the combined impacts of all drivers on SOC and crop production by comparing this experiment with S1. To estimate contributions from individual and combined drivers, we designed additional experiments with each of the drivers (e.g. crop improvement, fertilizer use, land use change and crop rotation, and also natural driving forces as captured by combining climate, atmospheric CO2 concentration and N deposition) fixed at the level of 1980 and compared with experiment S1. For example, the effects of fertilizer were determined by the differences between S1 and an experiment to keep fertilizer unchanged since 1980. We didn't separate impacts of land use change and crop rotation in this study because crop-specific areas were determined by both of them (i.e. cropland area × distribution of crop type, see supplementary material). To better understand carbon loss due to land use change in this region, we further broke the carbon dynamics down by major land cover types. Based on the above experiments, we calculated the 'best estimate' of accumulated changes of SOC and crop production, and the agricultural carbon footprint (ΔC/ΔP) between the two periods, and attributed their changes to major natural and anthropogenic drivers. In this study, to reduce the influence of inter-annual variability, we calculated annual changing trend of crop production estimated by each simulation experiment by using the slope of linear regression at p-value less than 0.05 for the reference period and most recent decade. SOC change was estimated as the difference between starting and ending point of the study period.
Uncertainty analysis
We further examined the estimate uncertainty of DLEM derived from key parameter values and input data. A range of parameter values related to LUCC-induced carbon and nitrogen loss, and residual removal were used to set up model. Besides, we conducted additional simulation experiments by forcing the model with multiple scenarios of crop type distribution. The distribution scenario maps were generated with county-level area of each crop kept consistent with USDA annual survey while spatial distribution within county was randomly assigned in 'suitable cropland areas', identified by HYDE 3.2 (Klein Goldewijk et al 2017). More details of uncertainty experiment design are included in supplementary figure S12. The spread of model estimate was obtained as standard deviation among those additional uncertainty experiments.
Results and discussion
Fueled by increased commodity prices during 2007–2013, the area under corn and soybean in the US reached record highs with much of the newly added cropland converted from grasslands, wetlands, and Conservation Reserve Program land (Lark et al 2015). Particularly in the Western Corn Belt, corn/soy expansion resulted in large loss of grassland area (1.0%–5.4% annually relative to grassland cover in 2006) from 2006 to 2011, which is comparable to tropical deforestation rates in the 1980s and 1990s (Wright and Wimberly 2013). Based on annual USDA NASS CDL data at 30 m resolution (Johnson and Mueller 2010), we find that agricultural land in the western Corn Belt expanded by 1.1 million hectares (Mha) during 2006–2016, of which 82% was converted from grasslands, and 14% from wetlands. South Dakota accounted for 31% of cropland expansion in this period, followed by North Dakota (24%) and Minnesota (23%). Spatially, the expanded croplands are largely found in the Prairie Pothole Region, with 92% of new croplands converted from grasslands and 7% from wetlands, which provide irreplaceable habitats for native plants, fish, and wildlife. In the same period, 0.56 Mha cropland was converted to non-cropland types (cropland abandonment hereafter), leading to a net crop area increase of 0.54 Mha (figure 1). Compared to the period 1980–2005, cropland expansion from 2006 to 2016 more than tripled while concurrently abandoned cropland acreage was 33% higher (table S2 in supplementary material). Intensive management practices, such as fertilizer use, irrigation, tillage, and manure application, have been implemented along with cropland expansion to maximize crop yield from converted marginal land or from more monoculture production. Great progress in quantifying agroecosystem productions in this region has been made through farmer surveys, field- and satellite-observations, and modeling studies (Liang et al 2017, Wimberly et al 2017). It remains unclear, however, how extensive (i.e. cropland expansion and increased proportion of a certain crop type through rotation) and intensive agricultural production (i.e. increase crop yield by enhancing resource use efficiency or reducing stressors) have affected terrestrial carbon stocks during the past decade, particularly as corn and soybean cropping system expands northwestward from the generally humid core Corn Belt into the more semiarid Great Plains.
We found that during 1980–2016, annual production of major grain crops in the western Corn Belt together increased by 88% relative to the 1980s' average (figure 2(c)). This increase was composed of an accumulated increase in corn production by 121% (92 Million Metric tons, MMT of gain in total for the past 37 years), a 189% increase (27 MMT grain) in soybean production, and a decrease of 18% (5 MMT) in other grain crops (such as wheat, sorghum, barley, and others). In the reference period, both census data and process-based ecosystem modeling showed a grain crop production increase of 2.4–2.6 MMT yr−1 (range of model estimate to survey average), and there has been an even more rapid increase of 3.7–4.7 MMT yr−1 (p < 0.05) during the last decade (figures 2(c) and (d)), which was mainly attributed to production increase in corn and soybean.
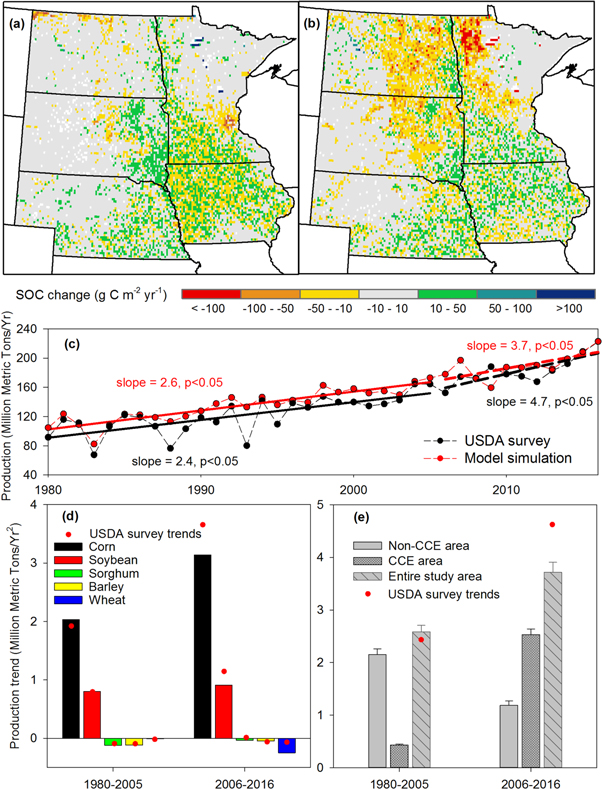
Figure 2. Annual changing trend in soil organic carbon (SOC) storage during 1980–2005 (a) and 2006–2016 (b), and in grain crop production (total production trend estimated by model and USDA survey, as shown in (c) and by-crop trend in (d)) in the western Corn Belt. Red dots in figure (d) and (e) indicate USDA survey-based trend of crop production, and bars represent model estimates in this study. Solid and dash lines in figure (c) are the regression lines for the period of 1980–2005 and 2006–2016, respectively. CCE in figure (e) is the abbreviation for continuous cropland expansion, which we use to represent newly-developed crops (details for calculation can be found in Methods and supplementary material). (Error bars in figure (e) indicate the standard deviation of multiple model runs with varied values of key parameters.)
Download figure:
Standard image High-resolution imageModel attribution indicates that the way higher crop production was achieved in the Western Corn Belt shifted from intensification to a combination of intensive and extensive farming practices. Crop technology improvement (referring here to the enhancement of yield per unit area of cultivated land through plant breeding) was found to be the largest contributor, accounting for two thirds of the total grain production increase in the period 1980–2005, while technology-enhanced production increased slightly in the period 2006–2016 (figure 3). However, cropland area change and rotation (i.e. changes in where land is cultivated and what is planted) grew to be as important as crop technology improvement for increased crop production, with its contribution growing by over fourfold from 0.5 MMT yr−1 in the reference period to 2.1 MMT yr−1 after 2006. We further split cropland area in this region into newly-expanded crops (CCE) and old crops (non-CCE). We found that, different from old crops where production increase slowed down, the increasing trend of crop production in newly-expanded cropland in 2006–2016 was four times larger than that in the reference period, indicating a growing role of cropland expansion in raising production (figure 2(e)). Among anthropogenic activities, N fertilizer contributed the least to additional crop productivity, only adding a small part to grain production in this region during the most recent decade when compared to fertilizer-enhanced production in 1980. Natural drivers, including climate variability, atmospheric CO2 concentration, and nitrogen deposition, together played an insignificant role, with contribution close to that of fertilizer use in both periods.
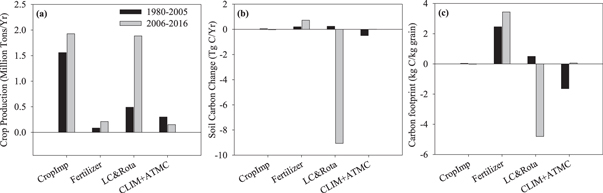
Figure 3. Model estimated factorial contributions to accumulated changes in crop production (a), soil organic carbon storage (b), and footprint of crop production (c) during 1980–2005 and 2006–2016. Major drivers considered here include crop technology improvement (cropimp), N fertilizer use (Fertilizer), land cover change and rotation (LC&Rota), and natural drivers (CLIM-ATMC, climate, atmospheric CO2 concentration, and nitrogen deposition).
Download figure:
Standard image High-resolution imageOur simulation indicates that natural and anthropogenic drivers together led to a negligible SOC change of 3.8 ± 22.8 Tg C (1 Tg = 1012 g) in the Western Corn Belt during 1980–2005. However, in the rapid LUCC decade, SOC storage declined by 90.8 ± 14.7 Tg C. Cropland area change and rotation, including the increased proportion of corn and soybean (corn: from 37% of total cropland area in 1980 to 46% in 2016, soybean: from 23% to 37%, figure S4 in supplementary material) barely affected the total SOC storage during the period 1980–2005, but became the single largest driver of SOC loss during 2006–2016. Spatially, large SOC loss (more than 100 g C m−2 yr−1) in the most recent decade was concentrated in the northern marginal area of core Corn Belt, in Dakotas and Minnesota, which agrees well with the extent of cropland expansion (figures 1 and 2). In contrast, these areas were more characterized by SOC accumulation or 'nearly neutral' carbon dynamics in the 1980–2005 reference period. The annual SOC dynamics due to land use change in this region varied substantially, from a gain of 0.25 Tg C yr–1 in the reference period to a loss of 9.06 Tg C yr–1 after 2006 (figure 3). Despite covering 5% of land area in North America, we found that SOC loss in the US Western Corn Belt during the last decade offset 12% of the estimated North American carbon sink resulting from LUCC (73 Tg C yr−1) (Houghton and Nassikas 2017). However, carbon loss is likely to be underestimated in the North American LUCC-induced carbon dynamics reported by Houghton and Nassikas (2017). This is because the land use history data used in their study, being FAOSTAT (FAO 2018) 'arable land and permanent crops' area, has declined in the US in the most recent decade, while the US national survey (NASS USDA 2017), CDL data (Johnson and Mueller 2010) and land use maps that we use here (Yu and Lu 2018) indicate cropland expansion.
The carbon footprint (ratio of ΔC to ΔP) of grain crop production in the western Corn Belt is shown to shift from a small positive value (0.06 kg C kg−1 grain produced, nearly carbon-neutral) in the period of 1980–2005 to a negative value (−2.27 kg C kg−1 grain produced) after 2006. We found that natural and anthropogenic drivers have varied impacts on the carbon footprints of agricultural production. Crop technology improvement is more effective in raising crop yield, yet imposed a smaller impact on SOC stock, leading to a carbon footprint close to zero (figure 3). In contrast, agricultural fertilizer use has been less effective in stimulating production since 1980. But fertilization did contribute to SOC accumulation, likely because of increased litterfall and reduced soil respiration (Ramirez et al 2010). Although, when compared with 1980, fertilizer use has not significantly increased crop yield it has led to a positive carbon footprint which increased from 2.4 kg C gain kg−1 grain production before 2006 to 3.2 kg C gain kg−1 grain production after 2006. Even so, there are two reasons why we should be very cautious to conclude that increased fertilizer use has been beneficial. These are that (1) additional fertilizer use barely stimulates crop production in this region, and (2) more comprehensive assessments of N2O emissions and N loading to water bodies are needed to better understand N budgets and their environmental consequences (Donner and Kucharik 2008, Hoben et al 2011). Cropland area change and rotation shifts together enlarging the carbon footprint by ∼10 times but in opposing directions, from 0.45 kg C kg−1 grain production during 1980–2005 to −4.3 kg C kg−1 grain after 2006. The large carbon cost of per kg gain production achieved by cropland expansion and rotation in the past decade is about 390 times higher than that by crop technology improvement. In Minnesota and the Dakotas, cropland expansion during 2006–16 ranked as the largest contributor to both crop production increase and SOC loss, resulting in a large negative carbon footprint due to land use change (figures S9–11 in supplementary material). This implies that a large proportion of grain production gain in these three states came with the cost of soil carbon loss.
The US Western Corn Belt was characterized by a small net change of cropland area in the period 1980–2005, with cropland abandonment dominant in four out of five states (supplementary table S3). The largest carbon loss was found in cropland, the majority of which was counteracted by carbon gain in other land cover types, resulting in a negligible carbon accumulation of 3.8 ± 22.8 Tg (figure 4). In contrast, land use change during 2006–2016 was overwhelmed by cropland expansion except in Nebraska, and the total expanded cropland area was almost double that of abandoned cropland. As a result, we found 45% of carbon loss occurred in what had been grasslands, followed by 31% in former wetlands, 13% in former cropland converted to other land cover types, and 9% in previously forested lands, while over 59% of carbon gain was found in cropland due to its expansion. Although 14% of the newly expanded cropland were converted from wetlands, it contributed to ∼one third of carbon loss due to high soil carbon density in wetlands. Cumulatively, cropland expansion was estimated to be 1.1 Mha in the western Corn Belt during 2006–2016, reducing soil carbon stock by 126 Tg, while 35 Tg C was accumulated in the meantime due to cropland abandonment of 0.56 Mha and soil carbon sequestration in other biomes, leading to a net carbon loss of 90.8 ± 14.7 Tg across the region.

Figure 4. SOC loss, gain, and net change by land cover types during 1980–2005 (a) and 2006–2016 (b). SOC loss and gain for a certain land cover type are calculated as differences between two time points (e.g. 1980 and 2005 for figure (a)) due to area change in each land cover type and SOC decomposition and accumulation driven by natural and anthropogenic forces. (Red blocks with different width indicate the ranges of net changes in best estimate ± 1 STD; purple error bars indicate the standard deviation of multiple simulation experiments with varied values of key parameters.)
Download figure:
Standard image High-resolution image
Overall, increasing production of grain crops in the Western Corn Belt has been attributed to different reasons before and after 2006. The contribution of extensive farming to production has substantially increased in the past decade, while the impact of crop technology improvement on grain production grew slightly. However, contrary to crop technology improvements that have caused only a small alteration to carbon stocks, cropland expansion and rotation in the most recent decade has led to large SOC loss in this region. Therefore, the resultant soil carbon change per kg of grain production gain has increased by about 40 fold in magnitude but in opposite directions over the two periods. More importantly, nearly three quarters of annual grain production increase was found in the newly-expanded croplands in recent decade, which reduced soil carbon stock considerably by more than 100 g C m−2 yr−1 in the marginal areas of the Western Corn Belt (figure 2). It is not surprising that landowners and operators pursued high economic return by converting non-croplands to croplands once corn price increases, but the loss of ecosystem services is large and may take decades for the soil carbon pool to recover. Besides, loss of grassland and wetlands in the western Corn Belt has threatened wildlife breeding in the Prairie Pothole Region (Wright and Wimberly 2013), such as waterfowl, neotropical migratory shorebirds, and amphibians, implying a severe ongoing or potential biodiversity loss induced by cropland encroachment. In addition to housing different species, Prairie Pothole wetlands served as effective buffer to provide flood storage and recharge groundwater (Gleason et al 2011), alleviating the risks from flooding and drought. Nonetheless, cropland expansion, combined with widespread use of fertilizer and pesticide, could cause further deterioration of wetland ecosystems, leading to eutrophication as well as water and soil degradation (Main et al 2014). Thus, crop production increase during the last decade has enlarged carbon footprint, and requires many years to pay back the carbon debt. Improved crop varieties are anticipated to reduce the carbon footprint of grain production (Stevenson et al 2013), increase resource use efficiency (Grassini and Cassman 2012), and increase crop yield on existing croplands rather than expanding agriculture to new lands (West et al 2010). Our study calls for a comprehensive assessment of the nature and consequences of substantial cropland expansion in response to economic forces.
Acknowledgments
This work has been supported by seed grant (#INRC 2017–06) from Iowa Nutrient Research Center, new faculty start-up fund from Iowa State University, NASA CMS (NNX14AO73G), NASA IDS (NNX10AU06G), NOAA Grants (NA16NOS4780204). Partial support also was provided by the US. Department of Energy under the FACETS project supported by the Regional and Global Climate Modeling program, and by the North Central Climate Science Center unit of the US Geological Survey. We thank two anonymous reviewers for their constructive suggestions to improve this manuscript.