

Abstract
Recent rates of deforestation on private lands in Australia rival deforestation hotspots around the world, despite conservation policies in place to avert deforestation. This study uses causal impact estimation techniques to determine if a controversial conservation policy—the Vegetation Management Act (VMA)—has successfully reduced deforestation of remnant trees in the Brigalow Belt South, a 21.6 Mha biodiversity hotspot in Queensland. We use covariate matching to determine the regulatory effect of the policy on deforestation rates over time, compared to two counterfactual scenarios representing upper and lower estimates of policy impact. The VMA significantly reduced the rate of remnant deforestation in the highest impact scenario, saving 17, 729 ± 1733 ha during 2000–2016. In the lowest scenario, 'panic clearing' before and after enactment of the VMA minimized the amount of remnant forests saved and may have marginally increased deforestation relative to the counterfactual (−404 ± 617 ha). At peak effectiveness, the VMA successfully counteracted the amount of remnant deforestation during 2010–2012, but this only represents 4.78% of the 371, 252 ha of remnant forests cleared in the bioregion since enactment in 1999. Thus, while deforestation rates in the region have substantially reduced since the policy was enacted, our results of positive yet limited direct regulatory impact suggests the policy's effectiveness is strongly confounded by other deforestation drivers, like changing socio-economic or climate conditions, as well as new social signals provoked by the policy. The mechanisms through which the policy influences deforestation behavior must be further investigated to ensure real, desirable change is achieved.
Export citation and abstract BibTeX RIS

Original content from this work may be used under the terms of the Creative Commons Attribution 3.0 licence. Any further distribution of this work must maintain attribution to the author(s) and the title of the work, journal citation and DOI.
Introduction
Policy evaluation is critical for adaptive management and political development, as it can illuminate the successes of policy instruments and identify areas requiring improvement (Bovens et al 2006, Pawson 2006). A crucial component of measuring policy effectiveness is impact evaluation, which investigates the direct influence of policy, unconfounded by other rival explanations (Ferraro 2009); yet such analyses are rare due to policy subjectivity, time and resource limitations (McGrath 2010, Perche 2011), and complex biophysical, demographic, and economic implementation contexts (Pfaff and Robalino 2012, Börner et al 2016). However, naïve before–after or with–without comparisons of impact indicators, such as the amount of remaining habitat or qualitative impact scores, often yield misleading estimates of the intervention's true effects (Ferraro 2009, Miteva et al 2012, Baylis et al 2015).
Robust causal inference approaches (Winship and Morgan, 1999, Imbens and Wooldridge, 2009) are becoming more prevalent in evaluating conservation policy instruments (Miteva et al 2012), particularly for policies implemented under relatively constrained conditions, such as protected areas (Andam et al 2008), payments for ecosystem services (Arriagada et al 2012), and 'hybrid' instruments (Lambin et al 2014). The few studies aimed at estimating impacts of deforestation policies over more variable landscapes, including those largely under private management, show more variable and contrasting results (e.g. Alix-Garcia et al 2015, Sills et al 2015, Bos et al 2017). For instance, conservation regulations reduced deforestation by nearly 50% in the Amazon (Assunção et al 2012), but increased pre-emptive habitat destruction resulting from species' listings under the US Endangered Species Act, contrasting with evidence based upon naïve impact indicators (Ferraro et al 2007). Amidst increasing competition for land and resources around the world, it is critical that the causal impact of conservation policies is robustly evaluated to justify the many direct and indirect costs associated with these interventions and to ensure desirable change is being created for biodiversity conservation and sustainability.
The Vegetation Management Act (VMA) 1999 is a controversial policy that regulates deforestation on private land to achieve its primary purpose of preserving woody remnant vegetation in a globally-significant deforestation hotspot in Queensland, Australia (McGrath 2010). The policy has been highly criticized since its enactment by landholders and lobby groups, arguing its lack of transparency, inflexibility, and ignorance of potential economic outcomes (Productivity Commission 2004, Senate Inquiry 2010), and was hotly debated as recently as March 2018 when new amendments were put forward by the Queensland Government. Remnant vegetation is defined by the Act as an old-growth native tree or plant (excluding grasses and mangroves) covering 'more than 50% of the undisturbed predominant canopy and averaging more than 70% of the vegetation's undisturbed height' (Vegetation Management Act 1999 Qld 2015, sch 5).
The VMA regulates deforestation of remnant vegetation on private land by largely prohibiting broad-scale clearing for agriculture or pasture. The extent of native vegetation clearance is frequently used as an indicator for monitoring the success of the VMA (Evans 2016). This measure, however, is inadequate, as it does not separate the impacts of the policy itself from the confounding effects of changing socio-economic, climatic, or political conditions. While evaluations of the VMA have indicated that the statute may have design limitations and present significant costs to landholders (Productivity Commission 2004, Senate Inquiry 2010), to date, there has been no robust evaluation of the VMA that directly assesses its effectiveness in achieving its primary purpose of conserving remnant vegetation.
This study provides the first robust quantitative analysis of the policy's ability to reduce deforestation of remnant trees, amidst ongoing intense debate surrounding the policy's effectiveness and concerns over its significant costs to local farmers and graziers (Senate Inquiry 2010, Reside et al 2017, Simmons et al 2018a). We illustrate a new application of causal inference techniques to a broad-reaching environmental statute over a temporally dynamic period, using covariate matching to determine how the policy has affected rates of remnant deforestation in the Brigalow Belt South (BBS) bioregion of Queensland, Australia, compared to two counterfactual scenarios—pre-emptive clearing (PC) and social preference (SP) scenarios—representing the lower and upper impact estimates, respectively, over time. We illustrate how our results compare with associative evidence based upon naïve trend analyses and highlight the importance of future studies to apply counterfactual thinking to evaluating similar policies in both developed and developing countries.
Methods
Study area
The BBS (21.6 Mha) is an agricultural area consisting largely of extensive pasture grazing by beef cattle (22.7521°S–28.9991°S, 145.9432°E–152.3913°E) (figure 1). The study area is a flashpoint for nature conservation and development in Australia. It has significant ecological importance as a national biodiversity hotspot (Ponce-Reyes et al 2014) and deforestation hotspot (Evans 2016). As of 2016, the area of woody vegetation in the BBS constitutes 11.1 Mha, with remnant areas covering only 38% of the bioregion.

Figure 1. Study area. The 2016 extent of (a) remnant vegetation and primary land uses, (b) woody vegetation, and (c) remnant and non-remnant deforestation events during 1997–2016 within the Brigalow Belt South bioregion of Queensland. Protected areas consist of national and regional parks, forest reserves, timber reserves, and state forests. Land uses adapted from the Australian Land Use and Management (ALUM) Classification system.
Download figure:
Standard image High-resolution imageData
The VMA is defined and assessed in regulation through the use of the Statewide Landcover and Trees Study (SLATS) dataset (Queensland Spatial Catalogue 2016h). The SLATS data defines woody vegetation clearing outcomes at approximately 25 m resolution according to the type of clearing event (e.g. clearing for pasture, crop, or infrastructure), identifying trees with a minimum foliage projective cover of 8%–11% (Department of Science, Information Technology and Innovation 2016), and is considered to be 95% accurate based on field verification (Macintosh 2007, Scarth et al 2008). In this study, we define 'tree' to represent woody vegetation, and 'deforestation' to represent the observed clearance of woody vegetation identifiable by SLATS. We obtained deforestation data for all available time periods from the SLATS dataset: fiscal-year periods between 2000 and 2016 and combined data for 1997–1999. For simplicity, we identify the annual fiscal years by their latest record (i.e. '1999–2000' = 2000, '2000–2001' = 2001, etc). The earliest map of remnant tree extent was obtained for 1997 from the Queensland Government's spatial catalogue (Queensland Spatial Catalogue 2016g) and SLATS deforestation events subtracted from this to produce annual remnant cover maps. Clearing events due to natural tree death or natural disaster damage, which made up less than 1% of SLATS data, were excluded from impact analysis. We also excluded protected areas (national and regional parks, forest reserves, timber reserves, and state forests; Queensland Spatial Catalogue 2016f), which made up less than 8% of SLATS data. Only freehold and leasehold lands were included in the analysis, making up 85% of the BBS and 91% of all annual clearing events.
Defining protection status
Regulating the deforestation of remnant vegetation on private land is the main mechanism though which the VMA (1999) attempts to achieve its primary purpose—preserving remnant vegetation. Therefore, we define the 'treatment' as aligning with the spatial extent of remnant vegetation on private land, as defined by the data used by Queensland to support and evaluate the policy (Queensland Spatial Catalogue 2016g, 2016h). As nearly all remnant area on private land in the state is effectively treated by the Act, we derive the counterfactual—the assumption of what would have occurred in the absence of policy—from areas of non-remnant tree cover. We define non-remnant trees as all trees that do not meet the aforementioned remnant criteria under the Act. Because the VMA does not regulate deforestation within grassland regional ecosystems (RE), all trees in these ecosystems were assumed to be non-remnant. Our analysis does not distinguish legal and illegal deforestation, as some exemptions from regulation (e.g. clearing for fences, weed control, necessary infrastructure) will be present in the deforestation data.
This represents a simplification of the temporal and thematic coverage of the policy, which has undergone fluctuations in the level of restrictions placed on deforestation (Simmons et al 2018a), including provisions for 'high-value regrowth', and for remnant vegetation on leasehold lands. High-value regrowth—regrowth that had not been cleared since 31 December 1989—also experienced some deforestation regulation during 2009–2013 from an amendment to the policy, but we excluded these trees from our definition of treatment status since they are not remnant trees. The VMA regulated remnant deforestation on freehold lands since enactment, but deforestation on leasehold lands was not covered by the Act until 2004. Therefore, treated forests for 2000–2004 only consisted of remnant trees on freehold land, and treated forests for 2005–2016 consisted of remnant trees on freehold and leasehold lands. Thus, we emphasize that our analysis measures the effectiveness of the policy's overarching goal of reducing deforestation of remnant vegetation since its enactment.
Scenarios and causal impact estimation
The exposure status of a given forest pixel i is determined by the VMA 1999, which provides regulatory protection to remnant woody vegetation. Remnant woody vegetation thus represents the treatment units of the policy intervention (Di = 1). We assume non-remnant trees can represent the untreated units that do not receive explicit protection (Di = 0). Our outcome variable (Yi) represents the deforested status of each pixel. For years 2000–2004, only remnant units on freehold land are considered treated, and remnant units on leasehold land are considered treated for 2005–2016. We estimate the average treatment effect on the treated (ATT) over each time period to measure how effective the policy has been at reducing the deforestation of remnant trees on private land:
where  is the observed remnant deforestation rate under the VMA, and
  is the counterfactual remnant deforestation rate without the VMA (Imbens and Angrist 1994). We assume that in the absence of the VMA, remnant and non-remnant deforestation rates, conditional upon matched covariates (X), would have followed common trends over time (Lechner 2010). The use of observed non-remnant deforestation under the VMA,
  thus serves as an appropriate counterfactual approximation, as the underlying structural similarities of treated and untreated forests can account for the processes influencing deforestation (Sills et al 2015), such that

Two ATT baselines for the period prior to implementation of the VMA (1997–1999) were generated for remnant forests only on freehold tenures (FO) and remnant forests on freehold and leasehold tenures (FL). The ATTs for this pre-intervention period revealed remnant deforestation rates significantly higher than the counterfactual (ATT1999,FO = 4.46%, ATT1999,FL = 3.29%). Two explanations for this preferential clearing of remnant trees compared to similar non-remnant trees in this period are: (1) that this period shows 'pre-emptive' clearing of remnant trees prior to the Act, evidence of which has been reported in previous analyses (Simmons et al 2018a, 2018b) and landholder testimonials (Productivity Commission 2004, Senate Inquiry 2010), or (2) that this is a social preference for clearing of remnant trees versus similar areas of non-remnant trees. We developed two assumption scenarios from these: (1) Pre-emptive Clearing scenario (ATTPC), assuming that elevated pre-emptive clearing of remnant trees is caused entirely by the Act and that the true difference between our treated and counterfactual samples is zero (ATT1999 = 0%), and (2) Social Preference scenario (ATTSP), assuming that there is a fixed social preference for clearing remnant over equivalent non-remnant, which is equal to a constant deforestation rate of SPFO = 4.46% for 2000–2004 and SPFL = 3.29% for 2005–2016. In the latter scenario, we use a difference-in-difference approach commonly used in the impact evaluation literature (Lechner 2010, Miteva et al 2012) to subtract this fixed value from the ATTPC for the calculation of the ATTSP. These two scenarios provide a bound estimate on the ATT of the VMA across time:
where t is in {2000, ..., 2016}, t1 is in {2000, ..., 2004}, and t2 is in {2005, ..., 2016}.
The sensitivity of the ATTPC estimates to hidden bias due to unobserved confounding factors was tested using Rosenbaum's sensitivity test for binary outcomes (Keele 2010), where Γ represents a relative measure of bias ranging from one (no hidden bias) to infinity. The value of Γ at the moment when the effect of bias begins to significantly affect the ATT estimate (p = 0.05) was compared between years. Significance of the annual ATT estimates was tested by applying the Holm–Bonferroni Method to pairwise Pearson chi-square comparisons and associated odds ratios. The amount of avoided remnant tree loss was calculated annually for each scenario according to the representation of our matched sample within the population:
'PC' scenario
'SP' scenario
where  is the additional area of remnant trees that would have been cleared in the counterfactual, n is the number of observations in the population within the matched strata, N is the number of observations in the population within all sampled strata,
  is the rate of remnant deforestation within the matched sample, and
  is the area of remnant trees within the matched strata that was available to be cleared in the previous year. Under the 'SP' scenario, ATTSP corresponds to the respective constant for the 2000–2004 and 2005–2016 treatment distinctions (equations 4 and 5).
Matching
We used the following temporally constant variables—which have previously been shown to explain 54% of the variation in BBS clearing patterns (Simmons et al 2018a)—to match treated and control observations: remoteness (Atlas of Living Australia 2016), slope (Queensland Spatial Catalogue 2016d), parcel size, tenure (Queensland Spatial Catalogue 2016c), frequency of drought declarations (Queensland Spatial Catalogue 2016a), rainfall variability (Queensland Spatial Catalogue 2016b), and RE code (Queensland Spatial Catalogue 2016e). REs are vegetation communities characterized by unique geology, soil, and landform combinations, defined according to their bioregion, land zone, and vegetation community (Sattler and Williams 1999). Because of the large diversity of vegetation communities in the BBS, we developed an RE code that groups vegetation communities based upon the bioregion code, land zone code, and density of the vegetation community—1 = very sparse, 2 = sparse, 3 = mid-dense, or 4 = dense—according to the RE Description Database (Queensland Herbarium 2016). Freehold and leasehold tenure was represented as a binary variable.
Data was collated in ArcGIS v10.3.1 for all periods from 1997 to 2016 within the BBS at the 25 m pixel resolution. We constrained the analysis to the estimated extent of woody vegetation outside protected areas as of 1997, which covers approximately 8.9 Mha, or 47% of the unprotected BBS landscape. Trend impact indicators—clearing extent and mean/maximum clearing patch sizes—were calculated for each year based upon SLATS polygons to compare with causal impact estimates. Stratified random sampling was performed in R (R Core Team 2016) on the population dataset separately for treated and untreated pixels for every year using the 'sampling' (Tillé and Matei 2016) and 'data.table' (Dowle et al 2016) packages. We created annual samples, rather than tracking select observations over time, in order to account for annual changes in deforestation patterns, thus creating samples that would reflect the temporally dynamic clearing behaviors of landholders throughout the bioregion (Simmons et al 2018a). Strata were defined according to outcome, RE code, and tenure variables to ensure adequate matching of categorical variables and adequate representation of the population's true outcome. Strata that consisted of only remnant or non-remnant trees, as well as those that never experienced deforestation, were excluded from the sampling (3% of study area). For each year, the number of observations randomly selected from each stratum was weighted according to its representation in the true population. The final annual sample distributions mirrored those of the true population.
Covariate matching and subsequent evaluations were performed using R packages 'Matching' (Sekhon 2015), 'rbounds' (Keele 2015), and 'rgenoud' (Mebane and Sekhon 2015) on the annual sample datasets. Two methods for matching were compared—nearest neighbor (NN) and nearest k neighbors matching—under multiple caliper conditions. The adequacy of matching methods was evaluated according to multiple empirical and visual match balance estimations (additional details can be found in the supplementary information: stacks.iop.org/ERL/13/124003/mmedia). We selected the NN method using a 0.25 caliper for the causal impact estimation, which produced the best covariate balance (supplementary table 1) and significantly enhanced the comparability of remnant and non-remnant samples across all observed measures (supplementary table 2), but excluded 8%–10% of observations due to a lack of insufficient matches (supplementary table 3).
Results and discussion
Effectiveness of the VMA
Under the 'PC' scenario, remnant deforestation rates relative to matched non-remnant deforestation rates have significantly reduced for most years following the enactment of the VMA, with the lowest rate occurring in 2016 at −1.21% ± 0.14% (ATTPC ± 95% CI), indicating a shift in preference toward non-remnant deforestation (figure 2(a)). Overall, the impact of the VMA relative to the counterfactual is negligible; despite reducing the rate of remnant tree clearance by an average of 0.22% during 2000–2016, increased clearing surrounding the VMA's enactment minimized the cumulative amount of remnant forests saved from deforestation, even potentially increasing deforestation (−404 ± 617 ha) (figure 2(b)).
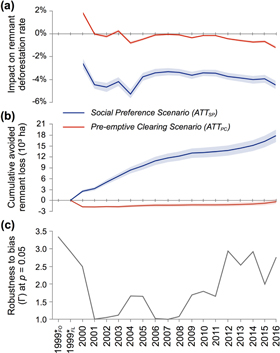
Figure 2. Causal inference results. (a) Annual estimates of the change in remnant deforestation rates due to the Vegetation Management Act 1999, according to two scenarios: the average treatment effect on the treated relative to the non-remnant counterfactual deforestation rate (ATTPC), and the impact relative to the fixed social preference rate of deforestation (ATTSP). (b) Cumulative avoided remnant tree loss over time according to the 'pre-emptive clearing' and 'social preference' scenarios. (c) Robustness of annual ATTPC estimates to potential hidden bias at significance (p = 0.05). Shaded areas for (a) and (b) represent the 95% confidence interval. (*) Period represents all deforestation events during 1997–1999 for only freehold lands (FO) and freehold and leasehold lands (FL).
Download figure:
Standard image High-resolution imageThe continued deforestation immediately following the passing of the Act in 2000 (1.91% ± 0.23%) reflects reported instances of spikes in pre-emptive deforestation rates ('panic clearing') (Simmons et al 2018a) and likely arose, in part, due to the delayed proclamation of the VMA in September 2000, when most statutory provisions commenced. This perverse outcome has also been observed during similar deforestation policy changes in the Amazon (Alston et al 2000, Aldrich et al 2012) and in other sectors of environmental policy (Lueck and Michael 2003, Rivalan et al 2007). Policy effectiveness increased until 2003, when remnant deforestation rates began to increase again (0.26% ± 0.14%), provoking a moratorium issued in the following year (Kehoe 2009). As expected, effectiveness was relatively high while the moratorium was in place (−0.81% ± 0.15%). After the moratorium was lifted, however, the effectiveness of the Act relative to this counterfactual diminished. ATTPC estimates from 2006 and 2007 did not differ significantly from zero, meaning that deforestation rates between equivalent remnant and non-remnant trees were similar, and the impact of the VMA was insignificant (supplementary table 3). This is likely due the government's implementation of a transitional cap of 500 000 ha of broad-scale clearing to be permitted throughout Queensland before the broad-scale clearing ban in 2007 (McGrath 2007). In the years immediately following the ban, the policy displayed limited effectiveness. Negligible changes in policy impact continued through the period of additional protection of high-value forest regrowth on freehold land in 2009–2012 (Simmons et al 2018a). Since 2012, against the backdrop of rising deforestation rates in both remnant and non-remnant vegetation, the VMA has increased in effectiveness relative to the counterfactual, with non-remnant areas experiencing a greater increase in deforestation rates relative to remnants.
Prior to the introduction of the VMA (1999) under the 'SP' scenario, the rate of remnant deforestation in the BBS was 4.46% ± 0.25% higher than similar locations with non-remnant trees on freehold properties, and 3.29% ± 0.12% higher on both freehold and leasehold properties (supplementary table 3). These rates of deforestation reflect historical incentives for preferentially clearing remnant trees, which targeted intact vegetation likely for economic reasons (e.g. to enhance productivity and expand pastoral lands), practical reasons (e.g. switching from degraded or over-grazed pre-cleared land), and/or cultural reasons (Simmons et al 2018a). The temporal pattern of the annual ATTSP estimates reflects those of the ATTPC estimates. Given the greater social preference for clearing remnant vegetation specifically on freehold land, however, 2004 represented peak effectiveness, reducing remnant deforestation rates by −5.26% ± 0.40% (ATTSP ± 95% CI) (figure 2(a)). In this scenario, all ATT estimates following the introduction of the VMA differed significantly and more strongly from the baselines than those of the 'PC' scenario (supplementary table 4). Under the SP scenario, the impact of the VMA has been much more effective, reducing the rate of remnant deforestation by an average of 3.86% during 2000–2016 and avoiding a cumulative loss of 17, 729 ± 1733 ha of remnant forest (figure 2(b)), roughly equivalent to the combined amount of remnant deforestation during 2010–2012.
Impact robustness
ATT results for most years were moderately robust to potential hidden bias (figure 2(c)). For most of the high-impact years, the sensitivity analysis suggests that any potential confounding factor that was excluded from this study would need to exert an influence on the occurrence of remnant trees more than twice that of the other covariates in order to affect the impact estimates (Keele 2010). The years most sensitive to hidden bias coincide with the early years of the VMA timeline, where landholders were subjected to frequent policy uncertainty arising from multiple amendments, a moratorium on clearing permits, withdrawal of Federal Government support for a $150 million structural adjustment package, and implementation of a broad-scale clearing ban (Simmons et al 2018a). Frequent periods of policy uncertainty have been shown to increase deforestation in Queensland (Simmons et al 2018b), which could explain the sensitivity of impact estimates during this period. For these years, other unobserved confounders such as additional socio-economic factors, aesthetic values of nature, or shifts in social or cultural norms could also have a significant effect on the impact of the VMA (Kull et al 2007, Seabrook et al 2008, Marcos-Martinez et al 2017).
The impact estimates of this study are limited by the lack of data on pre-intervention remnant deforestation trends, which would produce a more robust counterfactual. The two scenarios considered in this study, however, represent the potential bounds of policy effectiveness under opposing levels of social influence that could logically represent the true counterfactual. This study also does not distinguish between the most threatened types of vegetation in the landscape. Evidence suggests rarer, threatened forests are still being cleared faster than more common, less threatened forests (Rhodes et al 2017). Under this definition of effectiveness, the impact of the VMA may differ significantly from the overarching definition used in this study. Assessing the effectiveness of the VMA is inherently complex given its multiple objectives and frequent amendments, but at its core purpose of preserving remnant vegetation, we find the direct regulatory impact of policy has had a small (if any) positive effect, yet these impacts of the policy may be increasing with increasing background deforestation rates recently observed in the state.
Complementing trend impact indicators
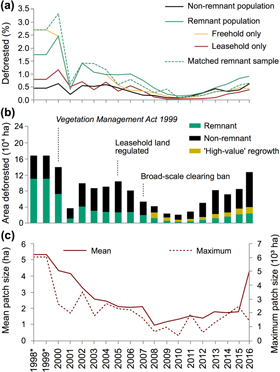
Naïve trend analyses of the rate of remnant deforestation (figure 3(a)) and the area of trees cleared over time (figure 3(b)) show a general decline since the enactment of the VMA until the recent policy relaxations, and this is often used as evidence for the effectiveness of the Act (Evans 2016). When looking at additional indicators of broad-scale clearing, such as mean and maximum patch size of clearing events (figure 3(c)), it is evident that landholders are clearing fewer trees and in smaller patches under the VMA. Like other indicators, however, this also increases following the conservative government's policy relaxation during 2012–2013, potentially representing a wider social shift in landholder clearing preferences in the most recent years.
Figure 3. Trend impact indicators. (a) Comparison of deforestation rates between the population and matched samples, with remnant deforestation rates on freehold and leasehold lands distinguished. (b) Trends in deforestation extent relative to the passing of the VMA 1999, inclusion of leasehold lands under regulation, and broad-scale clearing ban in 2007. (c) Changes in the size of deforestation patches over time. Overall trends for 2000–2004 exclude deforestation on leasehold lands. (*) Deforestation extent represents an average annual estimate for freehold and leasehold lands.
Download figure:
Standard image High-resolution image
Our causal impact estimates of the VMA differ from these trend impact indicators; we show the continued effectiveness of the VMA against the counterfactual, even amidst concerns over the rising rates of deforestation since 2012. The amount of remnant deforestation in the BBS has increased since 2012, but the amount of non-remnant deforestation has increased faster, with high-value regrowth constituting 15%–23% of non-remnant deforestation in the last 3 years (figure 3(b)). Additional discrepancies between our impact estimates and those based upon trend indicators include contrasting trends between ATT estimates and absolute clearing areas; for example, 2004 and 2016 exhibit high reductions in remnant deforestation rates (figure 2(a)) yet relatively high volumes of remnant deforestation (figure 3(b)). This can be explained by examining the differential changes in remnant versus non-remnant deforestation. In 2004, the amount of non-remnant deforestation increased by 45% from the previous year, but remnant deforestation only increased by 11%. Similarly, non-remnant deforestation increased by 82% in 2016, and remnant deforestation by a mere 9%. Our results highlight an increasing division in the rates at which remnant trees and corresponding non-remnant trees are being cleared in the study region: that is, an increase in the direct effectiveness of the policy. The high effectiveness in 2016, however, may still be confounded by a reduction in remnant clearing due to retrospective (i.e. ex post facto) clearing restrictions proposed in a VMA bill introduced that year, which ultimately was not passed in Parliament. Overall, our results show that the perceived effectiveness of the VMA in reducing remnant deforestation rates in the BBS from 2000–2016 is largely due to confounding factors rather than the direct impact of the VMA itself.
Potential mechanisms driving policy effectiveness
It is evident from figure 3(b) that the naïve deforestation trends are highly confounded. Clearing of non-remnant trees is unregulated by the VMA; yet, during 2006–2010, remnant and non-remnant deforestation has changed largely in concert. Most interestingly, remnant deforestation has not increased proportionally to non-remnant deforestation since policy relaxations in 2012. Thus, there must be some confounding factor(s) acting upon landholders that has (1) substantially reduced all deforestation during 2006–2010, even for trees that are permitted to be cleared, and (2) largely dissuaded landholders from preferentially clearing remnant trees during 2012–2016, even when given more legal opportunities to clear.
The BBS experienced the greatest rainfall deficit of any bioregion in Queensland during Australia's 'Millennium Drought' of 2001–2009 (Van Dijk et al 2013), and annual rainfall patterns have been identified as a significant driver of remnant and non-remnant deforestation in the region (Simmons et al 2018b). It is likely that this drought was largely responsible for the reduction of absolute deforestation rates during this period by diminishing the economic incentives to clear, which could explain why the VMA was only marginally effective in those years. Characteristics of landholders' clearing patterns during this period have reflected a preference for maximizing quality over quantity (Simmons et al 2018a), and this may explain the subsequent increase in the quantity of non-remnant deforestation following the end of the drought. These climate constraints could also have flow-on effects on other socio-economic drivers of deforestation, such as food prices and potential profitability, which can ultimately diminish the direct impact of the VMA (Marcos-Martinez et al 2017, Rhodes et al 2017, Simmons et al 2018b).
The increased effectiveness of the VMA following the drought may also be a product of the direct or indirect social impacts on landholders. The SP scenario in this study assumed a norm existed prior to regulation that increased landholders' preference for clearing remnant trees. It is likely that the VMA, its subsequent amendments, or the broad-scale clearing ban would have diminished the strength of this norm over time by altering social conventions toward appropriate deforestation practices and influencing how landholders expect others to change their behaviors (Ensminger and Knight 1997). This could have been facilitated through changes in personal or social norms. The costs of illegally clearing remnant trees imposed by the VMA can reach 1665 penalty units (AU$202, 963.50) (Vegetation Management Act 1999 Qld 2015, s 18); combined with landholders' early protests regarding the accuracy of satellite images used to monitor clearing, limitations on permissible legal defenses, and a reversed onus of proof (Productivity Commission 2004), the majority of landholders may not be willing to accept the risks associated with excessive remnant deforestation, necessitating reluctant compliance as a new personal norm. The VMA may have elicited indirect impacts on collective social norms, as well, leading to increased effectiveness in later years. Seemingly in contrast to other deforestation contexts, where deforestation and property rights regulations have induced pro-deforestation shifts in social norms (e.g. Rudel 1995, Schmidt and McDermott 2015), it appears the VMA may have provoked a redirection of landholders' clearing activities toward non-remnant trees. Despite landholders' severe lack of trust in the Queensland government (Brown 2018), they may have changed their behavior in accordance to the regulations if they recognize the growing social stigma around deforestation and seek to counteract the public's perception of farmers.
Implications and future directions
Our analysis illustrates how robust causal inference techniques can be used to understand how policy effectiveness changes over time amidst a highly dynamic political, climatic, and social environment. The VMA represents a unique and complex conservation statute, where protections fluctuate, clearing restrictions evolve, and private landholders' behavior is involuntarily regulated, largely without compensation. We show impact evaluation techniques can still be robust to hidden biases under these complex conditions, and counterfactuals can be developed even when reliable pre-intervention trends are unavailable through the use of bounded counterfactual scenarios. The significant yet limited effectiveness of the VMA reflects previous impact estimates of the broad-scale clearing ban in the BBS (Simmons et al 2018b), as well as similar deforestation policies around the world, such as the Brazilian Forest Code (Azevedo et al 2017) and numerous REDD+ initiatives (Bos et al 2017), where effectiveness may be limited to a brief period on the policy timeline, or intervention outcomes do not significantly differ from the expected counterfactual.
Policies have the potential to introduce strong social signals into the community (Kinzig et al 2013). If the VMA has managed to directly or indirectly shift current deforestation norms away from preferentially targeting remnant forest—whether it be due to risk aversion (instrument compliance), re-aligning their collective clearing behaviors (norm-oriented compliance), or merely an obligation to follow the law (legitimacy compliance) (Ramcilovic-Suominen and Epstein 2012)—it is important that future interventions reinforce these new norms and avoid crowding out the incentives for retaining remnants. Policy interventions, however, may not be enough to completely reduce landholders' preferred deforestation regimes. The negative cultural associations with the 'red tape' nature of environmental policy is unlikely to change landholders' underlying clearing preferences and may spur desires to rescind what current command-and-control policies do exist, as is being observed in Queensland (Reside et al 2017). Sustainable change in deforestation behaviors will need sufficient, stable, and enforceable underlying conservation statutes supplemented with on-the-ground instruments, incentives, and interventions that can target changes in social norms, attitudes, and other psychosocial characteristics (Beedell and Rehman 1999). Given that the effectiveness of these interventions and programs is largely inconsistent and case-dependent (Miteva et al 2012), ongoing causal inference evaluations will become increasingly valuable for policy development.
Conclusions
Conservation policies often lack thorough evaluation due to an over-reliance on impact indicators or failures to control for confounding factors. Here we show that more robust quantitative impact evaluation techniques could be used to assess whether policy interventions are producing real, effective, and desirable change. We found that the VMA implemented in Queensland, Australia was successful, on average, at reducing deforestation of remnant vegetation in the BBS bioregion. However, the magnitude of the impact is lower than estimates from less-robust analyses. Nevertheless, the results show that landholders are redirecting their deforestation efforts toward unprotected vegetation—an emergent norm that must be sustained for long-term deforestation behavior change. Given the growing efforts towards sustainable development, it is ever important that, in addition to robust techniques for conservation policy assessment, the evaluation of unintended policy effects should be undertaken.
Acknowledgments
We thank Nicola Nearhos for her help investigating the costs of illegal deforestation under the VMA. This work was supported by the Discovery and Future Fellowship programs of the Australian Research Council, and the Australian Research Council Centre of Excellence for Environmental Decisions (CE11001000104), funded by the Australian Government.