

Abstract
China's rapid industrialisation and urbanisation has led to poor air quality. The Chinese government have responded by introducing policies to reduce emissions and setting ambitious targets for ambient PM2.5, SO2, NO2 and O3 concentrations. Previous satellite and modelling studies indicate that concentrations of these pollutants have begun to decline within the last decade. However, prior to 2012, air quality data from ground-based monitoring stations were difficult to obtain, limited to a few locations in major cities, and often unreliable. Since then, a comprehensive monitoring network, with over 1000 stations across China has been established by the Ministry of Ecology and Environment (MEE). We use a three-year (2015–2017) dataset consisting of hourly PM2.5, O3, NO2 and SO2 concentrations obtained from the MEE, combined with similar data from Taiwan and Hong Kong. We find that at 53% and 59% of stations, PM2.5 and SO2 concentrations have decreased significantly, with median rates across all stations of −3.4 and −1.9 μg m−3 year−1 respectively. At 50% of stations, O3 maximum daily 8 h mean (MDA8) concentrations have increased significantly, with median rates across all stations of 4.6 μg m−3 year−1. It will be important to understand the relative contribution of changing anthropogenic emissions and meteorology to the changes in air pollution reported here.
Export citation and abstract BibTeX RIS

Original content from this work may be used under the terms of the Creative Commons Attribution 3.0 licence. Any further distribution of this work must maintain attribution to the author(s) and the title of the work, journal citation and DOI.
Corrections were made to this article on 22 November 2018. An acknowledgment of funding has now been added.
Introduction
Rapid economic growth and large increase in emissions has led to serious air quality issues across China. Annual PM2.5 (mass of particulate matter with a diameter less than 2.5 μm) exceeds 100 μg m−3 in polluted regions of northeast China (Ma et al 2014, Zhang and Cao 2015). Exposure to ambient (outdoor) PM2.5 is estimated to cause 0.87–1.36 million deaths each year across China (Apte et al 2015, Lelieveld et al 2015, Gu and Yim 2016, Cohen et al 2017). Health impacts from exposure to ambient PM2.5 cause losses equal to 1.1% of gross domestic product at the national level (Xia et al 2016) with losses of 1.3% in the Pearl River Delta (PRD) and 1.0% in Shanghai (Kan and Chen 2004, Huang et al 2012).
To address issues of poor air quality, the Chinese government has introduced policies to reduce pollutant emissions and has established ambient concentration targets for provincial and municipal authorities (Jin et al 2016). Despite having developed a comprehensive environmental legal framework to control pollution during the 1980s and 1990s, most control methods were not widely enforced until the 2000s (Florig et al 2002, Beyer 2006, Feng and Liao 2016). Desulfurization of coal-fired power plants, introduction of electrostatic precipitators (Liu et al 2015), closure of polluting power plants and increased efficiency (Guan et al 2014), have resulted in decreases in emissions of sulphur dioxide (SO2) and PM2.5 (Lu et al 2010, Klimont et al 2013, Van Der A et al 2017). Shifts towards cleaner fuels and electricity for cooking and heating in rural areas has contributed to reduced residential PM2.5 emissions (Tao et al 2018). Regulation of nitrogen oxides (NOx) has resulted in installation of NOx filtering systems on power plants, phasing out heavily polluting factories and new emission standards for vehicles (Liu et al 2017, Wu et al 2017). NOx emissions over 48 Chinese cities increased by 52% from 2005 to 2011 before decreasing by 21% between 2011–2015 (Liu et al 2017). In response to the 2012–13 air pollution 'crisis,' where very poor air quality triggered a public outcry, the state council issued the 'Action Plan on Prevention and Control of Air Pollution' that prioritised PM2.5 reduction in megacity regions (Sheehan et al 2014, Wang et al 2018). According to the estimates made in the Multi-resolution Emission Inventory for China, emissions of SO2, NOx, PM2.5, PM10 (mass of particulate matter with a diameter less than 10 μm) and carbon monoxide (CO) have decreased during 2013–2017 (Zheng et al 2018).
Understanding the impacts of changing emissions on pollutant concentrations is necessary to assess past management policies and identify future policy challenges. Longer term records of surface air pollutants are available across the PRD, showing that PM2.5 concentrations increased between 2000–2005 before decreasing from 2005–2010 (Wang et al 2016). Elsewhere across China a lack of widespread surface measurement data prior to 2012 means most previous analyses have relied on satellite data, visibility observations or emission estimates combined with modelling to establish air quality trends.
A number of studies have used satellite retrievals of aerosol optical depth to estimate trends in PM2.5 concentrations. Peng et al (2016) reported increased PM2.5 concentrations across China between 1999–2011. Ma et al (2016a) reported a positive trend in PM2.5 across China between 2004 –2007, followed by a negative trend between 2007–2013. Lin et al (2018) found Chinese PM2.5 concentrations increased between 2001–2005, before decreasing from 2006–2015. Fu et al (2014) used visibility data across the North China Plain (NCP) to show a positive trend in low visibility days between 1980–1995, little trend between 1995–2003 followed by a reduction in low visibility days between 2003–2010, particularly in winter. Visibility data has also been used to estimate that annual mean PM2.5 in Beijing increased between 1973–2013 by an average of 0.6 μg m−3 year−1 (Han et al 2016). A modelling study suggests that population-weighted PM2.5 concentrations across China increased by 53% between 1960–2010 and by 10%–35% between 1990–2010 (Butt et al 2017). Li et al (2017a) use satellite and in situ observations to downscale a global model and estimate that in East Asia, annual population-weighted mean PM2.5 increased significantly by 0.86 μg m−3 year−1 during 1998–2013, with an insignificantly decreasing trend during 2006–2013.
Satellite observations show that SO2 concentrations over the NCP region peaked in 2007, decreasing by 50% between 2005–2015 (Krotkov et al 2016). Declines in SO2 across China are also more widespread, with a 50% decline in SO2 concentrations reported across the most polluted provinces in China between 2005–2015 (Ling et al 2017, Van Der A et al 2017). Li et al (2017b) estimate that SO2 loading over China decreased by a factor of five between 2007–2016, by which time 350 million fewer people were exposed to dangerous concentrations.
Satellite observations have shown that similarly to SO2 and PM2.5, nitrogen dioxide (NO2) has begun to decrease across China (Zhang et al 2012, 2018, Irie et al 2016, Krotkov et al 2016). Across the NCP, NO2 concentrations increased by 50% between 2005–2011, before returning to 2005 levels by 2015 (Krotkov et al 2016). The same trend with a maximum in 2011 was observed when averaging across the whole of China (Irie et al 2016). Gu et al (2013) found that while the trend in NOx emissions was positive across the whole of China during 2005–2010, the more economically developed regions such as the PRD and municipalities of Beijing and Shanghai had comparatively lower concentrations or negative trends.
Satellite observations suggest ozone (O3) concentrations have been steadily increasing across China at a rate of 7% per year between 2005–2010 (Verstraeten et al 2015). Although there are no long term records of surface O3 measurements in urban areas of China, there is evidence of positive trends at background sites. During 2003–2015, maximum daily average 8 h mean (MDA8) O3 concentrations increased at a rate of 1.13 ppb year−1 at a monitoring station 100 km northeast of Beijing (Ma et al 2016b). An increase of 0.25 ppb year−1 was recorded at a remote background site in western China between 1994–2013 (Xu et al 2016), and in southern China, and at a background site in Hong Kong an increase of 0.58 ppb year−1 between 1994–2007 was recorded (Wang et al 2009).
Most of our understanding of recent trends in air pollution across China comes from satellite studies or from relatively few in situ observations. There have been very few attempts to use data from surface monitoring stations to assess recent trends. Here we use data from >1600 surface monitoring stations across China and Taiwan for the period 2015–2017 to explore recent trends in the concentrations of air pollutants.
Methods
Three year time series (January 2015–December 2017) of hourly concentrations of PM2.5, PM10, CO, O3, SO2 and NO2 were downloaded for stations operated by the environmental protection departments for Mainland China (MC), Hong Kong (HK) and Taiwan (TW). Data for MC was downloaded from http://beijingair.sinaapp.com/ which had obtained the data from http://pm25.in, a mirror of data from the official Ministry of Ecology and Environment download platform (http://106.37.208.233:20035/). Similar data has been used in other studies (e.g. (Rohde and Muller 2015, Liang et al 2016, Leung et al 2018)). HK data was downloaded from the HK Environmental Protection department (https://cd.epic.epd.gov.hk/EPICDI/air/station/) and TW data was downloaded from the TW Environmental Protection Agency (https://taqm.epa.gov.tw/taqm/en/YearlyDataDownload.aspx). MC data has been described in detail by Zhang and Cao (2015). TW data (excluding aerosol measurements) was reported as a mole fraction, so these were converted into mass concentration to match MC and HK data by using meteorological data (73 stations), and assuming standard pressure and a temperature of 25 °C where this was unavailable (4 stations). Together these sources provided data from 1689 monitoring stations, with 13 from HK (the roadside stations are not used), 75 from TW and 1601 from MC. Locations of the stations are shown in figure 1.
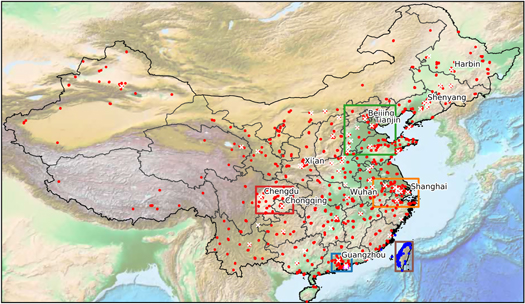
Figure 1. Location of air quality stations in Mainland China (red), Taiwan (blue) and Hong Kong (magenta) used in this analysis. The 60 largest cities by population are marked with white crosses, of which the 10 largest are labelled.
Download figure:
Standard image High-resolution imagePreviously there have been doubts about the reliability of air quality monitoring data from China, due to manipulation of data by local environmental protection bureaus which resulted in discontinuities around air quality targets (Andrews 2008, Ghanem and Zhang 2014). However, by comparing Chinese data with data from United States Embassy and Consulate monitoring stations, it has been shown that data is more reliable since 2013 (Liang et al 2016, Stoerk 2016). Other quality issues with the MC data have been previously noted including a high proportion of repeating values at some sites (Rohde and Muller 2015), and periods when reported PM2.5 concentrations exceed PM10 concentrations (Liu et al 2016b).
To address potential quality issues we applied the following procedure to all the data used in the study. First, we removed consecutive repeats from the data. Values were removed from NO2 and PM2.5 time series when there were >4 consecutive repeats, and for O3 where there were >24 consecutive repeats. 148 and 100 stations contained >5% consecutive repeats for NO2 and PM2.5 respectively and 1 station contained >5% repeats for O3. The data contain a small fraction (<0.04%) of zero values, which are unlikely to be accurate and could be caused by lower precision around the detection limit. We remove zero values from the time series. After consecutive repeats and zeroes have been removed, if <90% of hourly data is available for the whole time series, it is removed. Finally, to remove day-to-day repeats, data were flagged if the daily mean had a low coefficient of variation in a certain period (see supplementary figure 1 examples, available online at stacks.iop.org/ERL/13/114012/mmedia). If >60 d were flagged, the station is removed. The number of stations identified at each stage of data quality checking are shown in table 1. The thresholds used were chosen by applying the procedure with a range of thresholds, and manually examining the datasets to verify whether suspect data were removed. The thresholds applied for the different pollutants are given in supplementary table 1. We test the sensitivity of our analysis to these thresholds and find the magnitude of the trends we calculate are not sensitive to the values of the thresholds we choose (supplementary table 2).
The hourly data is used to calculate monthly averages. We then deseasonalised the data (the results using non-deseasonalised data are shown in supplementary figure 2). To analyse the three-year time series for monotonic, linear trends, the Mann-Kendall test was used to assess the significance of trends (using a threshold of p < 0.05), and the Theil–Sen estimator was used to calculate the magnitude of the trend. Both tests are resistant to outliers, and do not require any assumptions about the data used (Carslaw 2015, Fleming et al 2018). Absolute trends were converted to relative trends by dividing by the 2015 to 2017 mean. For O3, the trend tests were also applied to the MDA8 metric, which is used in the World Health Organisation's (WHO) air quality guidelines (AQGs). The R package 'openair,' which contains a set of tools developed specifically for analysing air quality data, was used to perform this stage of the analysis (Carslaw and Ropkins 2012).
We specifically analyse trends for large urban clusters: Pearl River Delta (PRD), Yangtze River Delta (YRD), North China Plain (NCP), and Sichuan Basin (SCB). Additionally, we analyse trends for the Hong Kong Special Administrative Region (HK) (which is within the PRD domain) and Taiwan (TW).
Air pollutant concentrations and trends
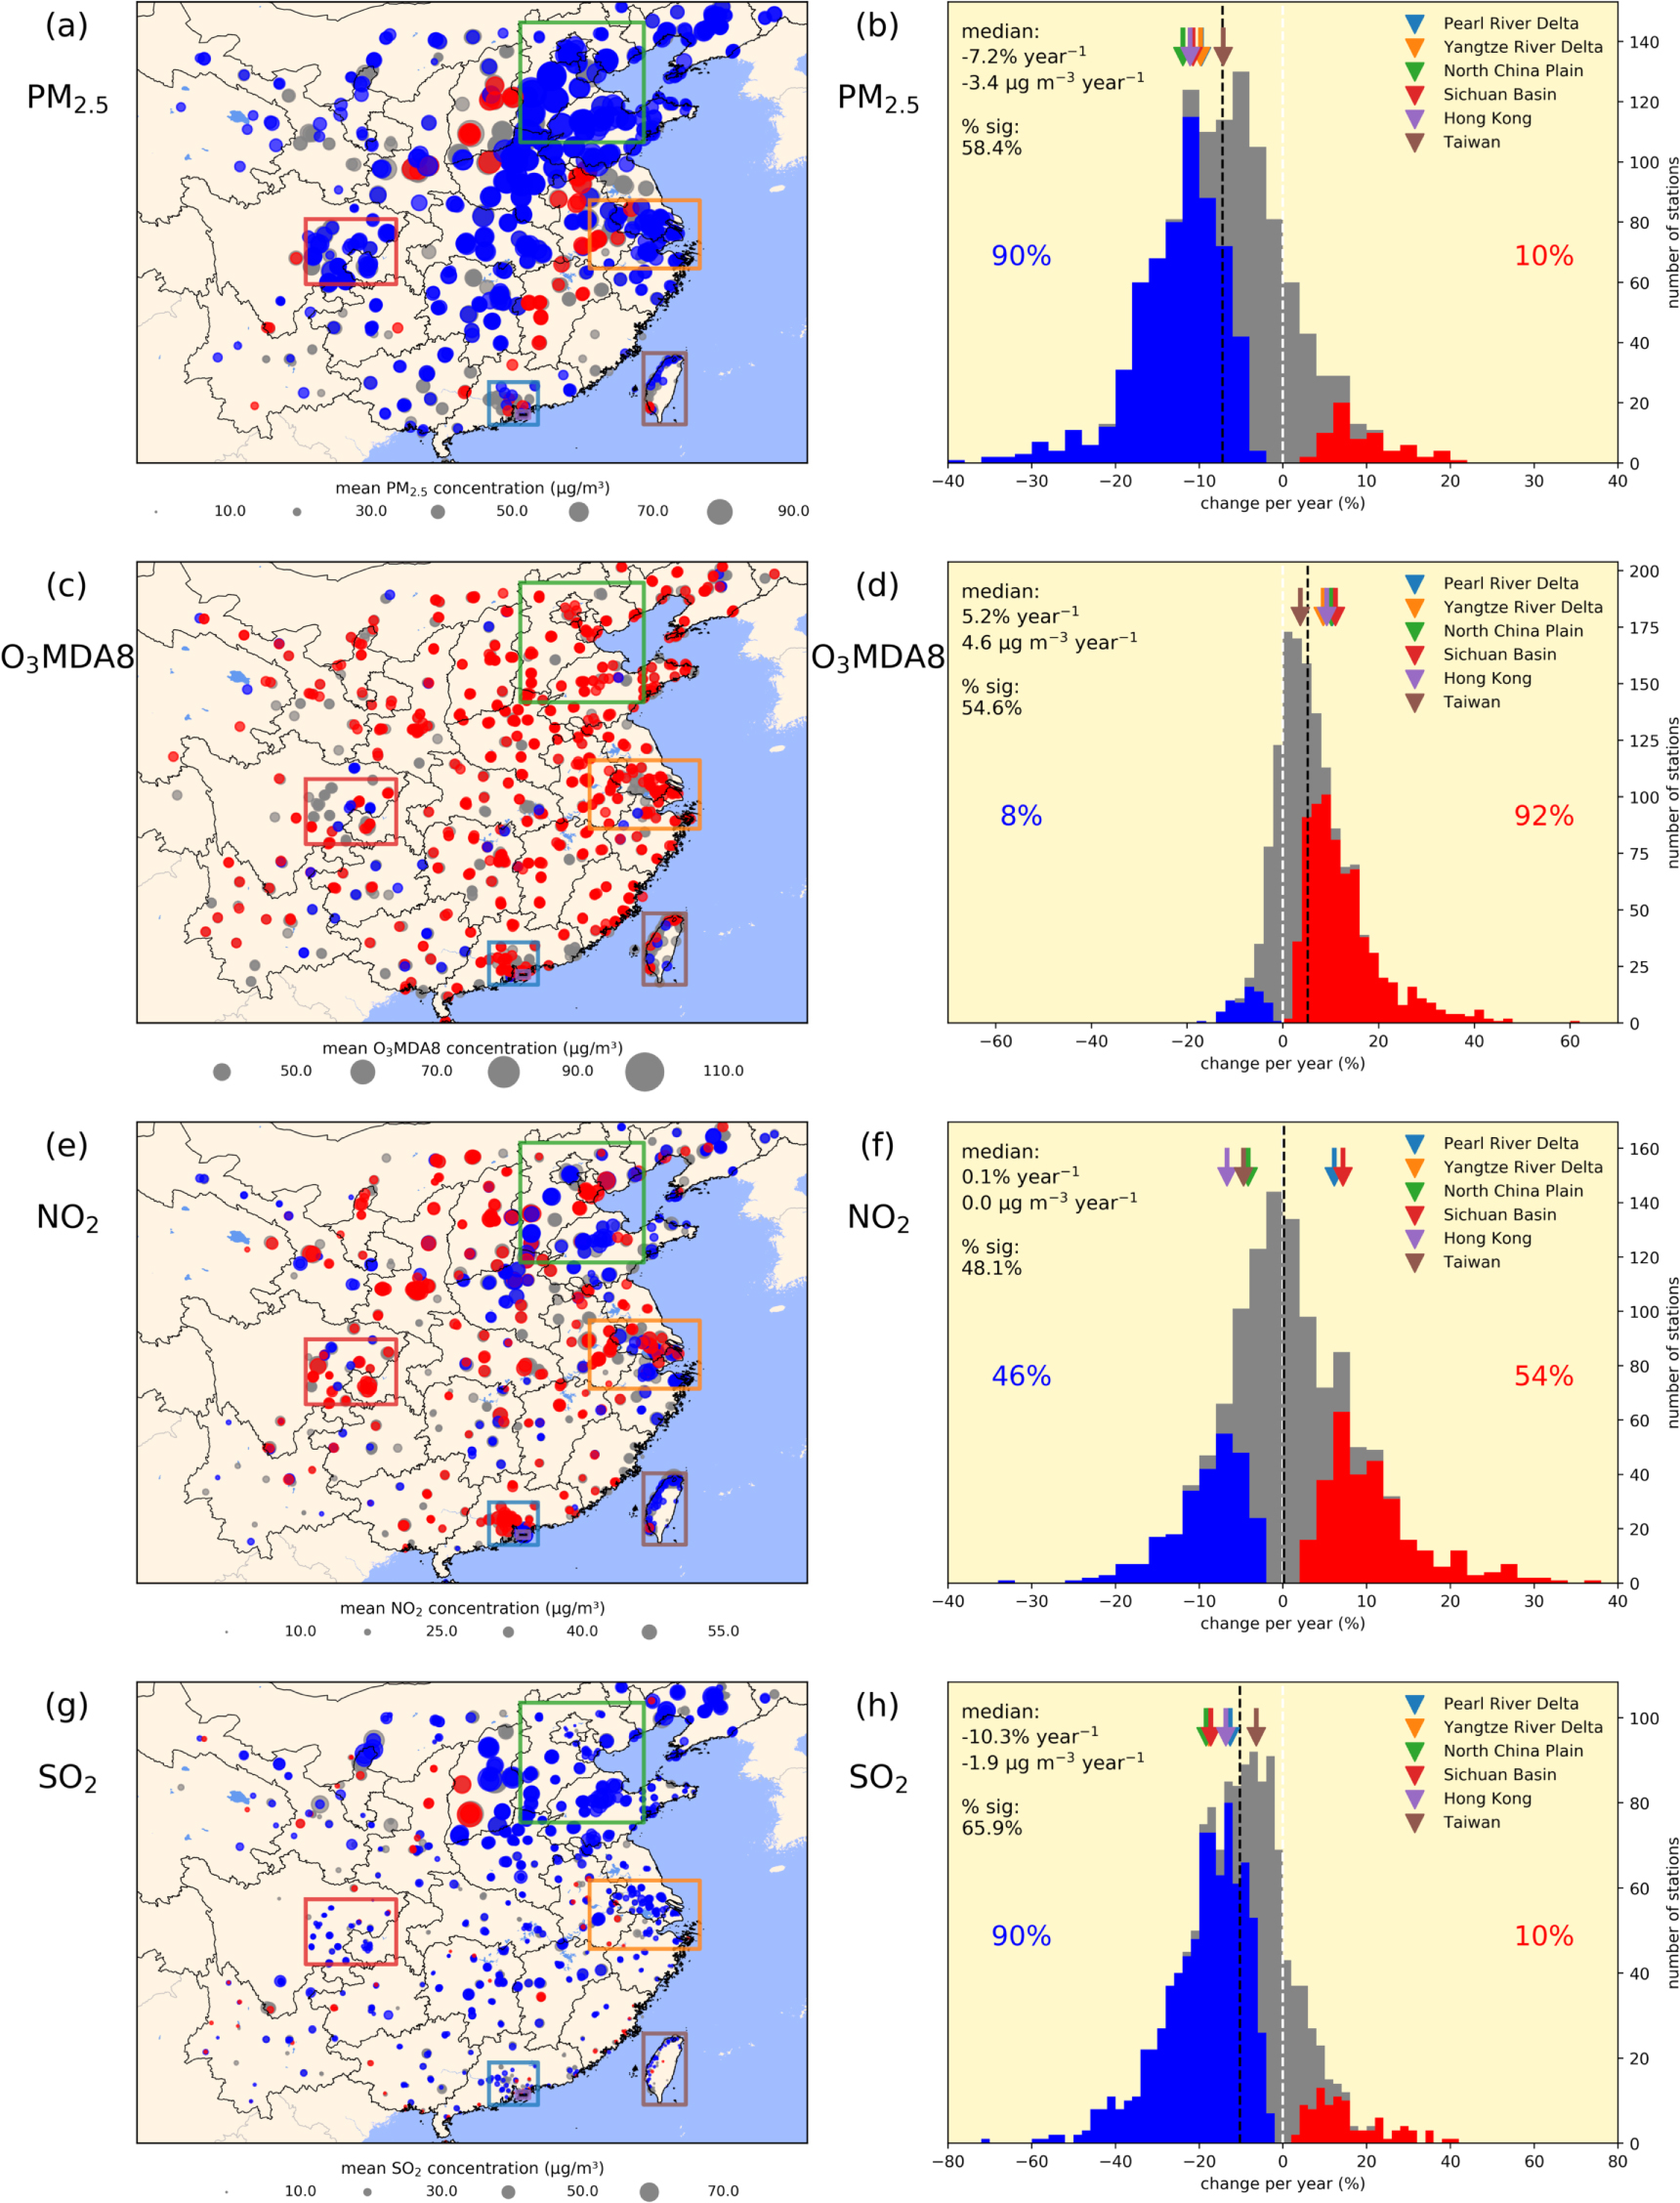
Annual mean concentrations of air pollutants during 2015–2017 are shown in figure 2 and supplementary figures 3 and 4. Highest annual mean PM2.5 concentrations are found in the provinces of Hebei, Henan and Shandong, which all have a median concentration of >60 μg m−3. Stations in Shanghai and Guangdong have lower PM2.5 concentrations, while the lowest PM2.5 concentrations (20–25 μg m−3) are found in Hong Kong, Taiwan and Xizang. The highest concentrations of SO2 are found in Shanxi, which has a median concentration of >60 μg m−3, and in Hebei which has a median concentration of 37 μg m−3. High NO2 concentrations are found across the Tianjin, Hebei and Beijing region, as well as Shanghai, Hong Kong and Chongqing. The provinces with the highest median O3 concentrations are the high elevation provinces of Xizang and Qinghai. Hong Kong and Chongqing have some of the lowest O3 concentrations.

Figure 2. Trends in concentrations of (a), (b) PM2.5, (c), (d) O3 MDA8, (e), (f) NO2, (g), (h) SO2 across Mainland China, Hong Kong and Taiwan during 2015–2017. Left-hand panels (a), (c), (e), (g) show the sign of trend (blue: significant negative, red: significant positive, grey: insignificant) and mean concentration (size of circle). Right hand panels (b), (d), (f), (h) show the frequency of stations against the relative trends. The median relative and absolute trend as well as the percentage of stations with significant trends is shown on each panel. The percentage of significant trends that are negative (blue) or positive (red) are also shown. The black dotted line shows the median trend across all sites. Triangles show the median trend for the regional domains shown in the left-hand panels: Pearl River Delta (PRD), Yangtze River Delta (YRD), North China Plain (NCP), Sichuan Basin (SCB), Hong Kong Special Administrative Region (HK) and Taiwan (TW). The left panels are zoomed to show the trends over the more populous regions of China, while median trends and % of significant sites on the right panels refer to all Mainland China, Hong Kong and Taiwan.
Download figure:
Standard image High-resolution imageFigure 2 also shows trends in air pollutants during 2015–2017. The median trend in annual mean PM2.5 concentration across all stations is −3.4 μg m−3 year−1 or −7.2% year−1. This is comparable to Zheng et al (2017), who find that the annual mean PM2.5 across 74 Chinese cities decreased by 23.6% between 2013–2015 (−7.9% year−1). Lin et al (2018) used satellite data to suggest the Chinese PM2.5 trend steepened from −0.65 μg m−3 year−1 between 2006–2010 to −2.3 μg m−3 year−1 between 2011–2015. Our work suggests that the rate of PM2.5 decline has been sustained, or possibly even become faster, between 2015–2017. We find 58.4% of stations have significant PM2.5 concentration trends, and of these, 90% are negative. PM10 concentrations exhibit similar trends (supplementary figure 5). The fraction of stations meeting the WHO's first Interim Target for annual average PM2.5 concentration of 35 μg m−3 rose from 15% in 2015 to 20% in 2017.
Figure 3 shows the relative trends in air pollutants at the province level (supplementary figure 6 shows absolute trends). Negative trends in PM2.5 concentrations are widespread, with all provinces experiencing negative median trends except Shanxi and Jiangxi. Most provinces had trends of around −10% year−1, with faster reductions in some areas including Beijing municipality (−14.4% year−1). Widespread reductions in PM2.5 concentrations are consistent with trends estimated from satellite data for the period 2011–2015 (Lin et al 2018).

Figure 3. Relative trends in (a) PM2.5, (b) O3 MDA8, (c) NO2 and (d) SO2 by province or region (bolded). The median (red line), interquartile range (IQR) (box) and IQR ± IQR*1.5 (whiskers) of the trend across the stations in each province/region is shown. The number of stations in each province/region is indicated at the top of the plot.
Download figure:
Standard image High-resolution image
The median trend in annual mean SO2 concentration across all stations is −1.9 μg m−3 year−1 or −10.3% year−1. 66% of stations have significant trends, and of these, 90% are negative. The mean exceedance rate of the WHO 24 h AQG fell from 10.8% in 2015 to 7.6% in 2017. Similarly to PM2.5, negative trends in SO2 concentrations are widespread across provinces (figure 3), with all having median negative trends apart from Hainan and Fujian, both of which have low absolute concentrations (supplementary figure 3).
There is no median trend in annual mean NO2 concentration (0.0 μg m−3 year−1 or 0.1% year−1). 48% of stations have significant trends, and of these, 54% are positive. The percentage of the stations that comply with the WHO's annual mean AQG of 40 μg m−3 has declined, from 71% in 2015 to 66% in 2017. There is more heterogeneity in the spatial distribution of trends, with median positive trends in the SCB, YRD and PRD domains, but median negative trends in HK, NCP and TW (figure 2). The greater spatial heterogeneity of NO2 trends could be partly due to its comparatively shorter lifetime, so that neighbouring regions can have opposing trends (e.g. HK and the PRD). The NO2 concentration trends we report for 2015–2017 are more variable that the consistent declines in NOx emissions (Liu et al 2016a, Van Der A et al 2017) and NO2 concentrations (Krotkov et al 2016) reported for the period 2011–2015.
In contrast to PM2.5 and SO2, annual mean O3 MDA8 has a positive median trend of 4.6 μg m−3 year−1 or 5.2% year−1. 55% of stations have significant trends, and of these, 92% are positive. Averaging across all stations, the percentage of days where the WHO AQG (100 μg m−3) was exceeded for MDA8 rose from 9.8% in 2015 to 12.4% in 2017. Annual mean O3 concentrations show similar relative and absolute trends (supplementary figures 7 and 8). The Tropospheric Ozone Assessment Report, which did not aggregate trends specifically for China due to lack of stations with long records, also reports significant positive trends over East Asia, (Chang et al 2017, Fleming et al 2018). All the megacity regions highlighted in figure 2 have medians greater than the overall median, and there are only 4 regions in figure 3 with median negative trends. During 2005–2013, Chinese megacity clusters shifted from a VOC-limited (NOx saturated) O3 production regime towards a mixed regime, due to reductions in NOx emissions, which has lessened the NOx titration effect resulting in increases in O3 concentration (Jin and Holloway 2015). Meanwhile, increasing NOx emissions in less developed cities has led to a shift from NOx limited regimes towards mixed regimes, which have high O3 production efficiency (Jin and Holloway 2015).
Discussion and conclusion
We find substantial changes in the concentrations of air pollutants across China during the period of 2015–2017. We report negative trends in annual mean PM2.5 (−3.4 μg m−3 year−1) and SO2 (−1.9 μg m−3 year−1) concentrations and positive trends in annual mean O3 MDA8 (4.7 μg m−3 year−1) concentrations. The observed trends are widespread across China and occur consistently across most of the country. In contrast we find spatially variable changes in NO2, with no overall trend across China. Trends in PM2.5 and SO2 concentrations are consistent with previous studies, that report negative trends in both PM2.5 (Ma et al 2016a, Lin et al 2018) and SO2 (Krotkov et al 2016, Van Der A et al 2017) between ∼2007 and 2015. Our study therefore suggests that declines in PM2.5 and SO2 concentrations that have been reported for 2007–2015 continued between 2015 and 2017.
Table 1. The number of monitoring stations available for each pollutant and the number of stations that were removed during data checking.
| Pollutant | ||||
|---|---|---|---|---|
| Type | NO2 | PM2.5 | O3 | SO2 |
| Initial number of stations | 1689 | 1689 | 1687 | 1689 |
| Number of stations with >5% consecutive repeats | 148 | 100 | 1 | N/A |
| Number of stations removed due to <90% of data being present | 520 | 505 | 339 | 296 |
| Number of stations removed due to 'day-to-day' repeats | 10 | 37 | 11 | 25 |
| Number of stations remaining in the analysis | 1159 | 1147 | 1337 | 1368 |
The trends we report are calculated over a relatively short period and could be caused by a variety of different factors. Air pollution is strongly dependent on weather. Interannual variability in meteorology and synoptic weather conditions (Leung et al 2018) may therefore play a role in the trends we observe here. Air pollution over China is influenced by variability in atmospheric circulation such as El Nino Southern Oscillation (ENSO) (Cao et al 2015, Zhao et al 2017) and the Asian monsoon (Li et al 2016, Cai et al 2017). El Nino years are associated with greater surface PM2.5 in southern China and lesser PM2.5 in northern China compared to La Nina years (Zhao et al 2017). ENSO variability is therefore unlikely to cause the spatially extensive trends in air pollutants across all of China that we report. It is possible that ENSO may have retarded the reduction in surface PM2.5 over northern China during 2015–2017. Changes in land cover and local meteorological conditions also alter the emissions of natural aerosol and trace gases (Fu et al 2016), including dust and biogenic volatile organic compounds that can form secondary organic aerosol and alter concentrations of O3. Leung et al (2018) suggest that PM2.5 across the NCP will decrease by 0.5 μg m−3 by the 2050s due to climate change, substantially less than the changes we report over the past 3 years. Since the trends over the period 2015–2017 are consistent with trends over the period 2007–2015, occur consistently across the country and coincide with declining Chinese anthropogenic emissions (Zheng et al 2018), we suggest that the trends are likely dominated by these emission changes. Future work needs to use air quality models to fully assess the contribution of different drivers of the trends reported here. It will be particularly important to establish what is causing the widespread increase in O3 concentrations, so that emissions control policies can be most effectively targeted.
Acknowledgments
We acknowledge AIA Group and Natural Environment Research Council (NE/N006895/1) for funding.