

Abstract
Understanding linkages between river chemistry and biological production in arctic coastal waters requires improved estimates of riverine nutrient export. Here we present the results of a synthesis effort focusing on relationships between watershed slope and seasonal concentrations of river-borne dissolved organic carbon (DOC), dissolved organic nitrogen (DON), and nitrate ( ) around the pan-Arctic. Strong negative relationships exist between watershed slope and concentrations of DOC and DON in arctic rivers. Spring and summer concentration-slope relationships for DOC and DON are qualitatively similar, although spring concentrations are higher. Relationships for
  are more variable, but a significant positive relationship exists between summer
  concentrations and watershed slopes. These results suggest that watershed slope can serve as a master variable for estimating spring and summer DOC and DON concentrations, and to a lesser degree
  from drainage areas where field data are lacking, thus improving our ability to develop pan-arctic estimates of watershed nutrient export.
Export citation and abstract BibTeX RIS
1. Introduction
Land-ocean coupling is strong in the Arctic, where north-flowing rivers account for over 10% of the global runoff and connect a land area of ∼20.5 × 10⁶ km2 to an ocean basin that contains only ∼1% of the global ocean volume (Aagaard and Carmack 1989, Shiklomanov 1998). Together these rivers transport globally significant quantities of dissolved organic matter (DOM), which is reported herein as dissolved organic carbon and nitrogen (DOC and DON), to the Arctic Ocean resulting in markedly high concentrations of land-derived organic matter relative to other major ocean basins (Opsahl et al 1999, Dittmar and Kattner 2003, Benner 2004, McClelland et al 2012).
Major efforts have been made to characterize fluvial biogeochemistry at a variety of scales and locations within the pan-arctic watershed during the past 20 years (e.g., Gordeev et al 1996, Lobbes et al 2000, Dornblaser and Striegl 2007, Frey et al 2007, Bowden et al 2008, McClelland et al 2014, McClelland et al 2015, Lehn et al 2017). Data from these studies have improved understanding of land-water connectivity in permafrost-influenced watersheds and established a basis for predicting potential climate change impacts on watershed nutrient export. The majority of annual riverine fluxes of water, organic matter, and inorganic nutrients to the Arctic Ocean occur during a short snowmelt period in the spring (Finlay et al 2006, McClelland et al 2006, Townsend-Small et al 2011, Holmes et al 2012, McClelland et al 2016). A large fraction of this river-borne DOM is labile (Holmes et al 2008, Mann et al 2012) and may provide a substantial carbon subsidy to coastal food webs in the Arctic (Dunton et al 2012, Casper et al 2014, Harris et al 2018). Fluvial transport of dissolved inorganic nitrogen also merits attention as it has been identified as an important N source supporting primary production in arctic estuaries (Amon and Meon 2004, Tank et al 2012, Le Fouest et al 2013).
Despite recent efforts to characterize arctic river biogeochemistry and land to ocean fluxes, a lack of concentration measurements in remote locations still hinders our ability to estimate fluxes from approximately one third of the pan-arctic watershed (Holmes et al 2013). This limits our ability to understand contemporary linkages between river inputs and biogeochemical cycling in the Arctic Ocean as well as our ability to forecast how changes in river inputs may influence biogeochemical cycling (including carbon storage/release and food web dynamics) in the future.
Defining watershed characteristics that correlate with fluvial chemistry may prove useful for estimating river concentrations of nutrients in these remote, largely inaccessible, data-poor regions. Previous studies have demonstrated that topography, hydrology, and wetland coverage play a major role in regulating the release of DOC, DON, and nitrate ( ) in monitored catchments of temperate forests and can be used as indicators to estimate concentrations in other forested regions (Hinton et al 1998, Schiff et al 2002, Inamdar and Mitchell 2006, 2007, Creed et al 2008, Creed and Beall 2009, Winn et al 2009). Likewise, variability in DOM and inorganic nutrients across landscape gradients in Alaska have been attributed to differences in catchment topography and hydrology, wetland and permafrost coverage, features of soils and vegetation, and seasonal thaw (McNamara et al 2008, McClelland et al 2014, D'Amore et al 2016, Harms et al 2016, Khosh et al 2017, Lehn et al 2017). Watershed slope has been highlighted as a particularly promising indicator of variations in fluvial DOM and
  among catchments (e.g., Schiff et al 2002, Inamdar and Mitchell 2006, Winn et al 2009, Harms et al 2016, Khosh et al 2017).
Here, we present results of a synthesis effort focusing on DOC, DON, and  concentration measurements from 70 drainage areas within the pan-arctic watershed spanning seven orders of magnitude (ranging from <1 km2 to 2.67 × 10⁶ km2). These drainages are primarily located on the North Slope of Alaska but also include the Yukon and Mackenzie in North America and the Ob', Yenisey, Lena, and Kolyma in Eurasia. We quantify seasonal relationships between watershed slope and fluvial concentrations of DOM and
  and examine similarities and differences in these relationships across basins. Our analysis considers relationships between watershed slope and concentrations of DOM and
  over a much wider range of catchment sizes and geographic locations than previously considered in arctic regions, thus facilitating broader conclusions about the robustness and generality of these relationships. Additionally, we examine whether an underlying relationship between watershed slope and soil organic matter content helps to explain spatial variability in fluvial DOC, DON, and
  Lastly, we consider the utility of these relationships for estimating river concentrations and fluxes from remote areas of the pan-Arctic where field data on water chemistry are lacking. To demonstrate the application of these tools, concentrations calculated from slope-derived regression relationships were paired with discharge data to estimate annual fluxes from the Pechora, Mezen, Severnaya Dvina, Olenek, and Yana rivers on the Eurasian side of the Arctic.
2. Materials and methods
2.1. Concentration data collection and analysis
River chemistry data from sites visited between 2003 and 2014 are included in this study (figure 1). Concentration data for the six largest arctic rivers (2003–2014) are from the Arctic Great Rivers Observatory (Arctic-GRO) project (http://arcticgreatrivers.org). Water samples were collected from the Yukon at Pilot Station, Mackenzie at Tsiigehtchic, Yenisey at Dudinka, Ob' at Salekhard, Lena at Zhigansk, and Kolyma at Cherskiy (n = 270). River chemistry data from the North Slope of Alaska were collected from downstream locations on the Colville, Kuparuk, and Sagavanirktok in 2006 and 2007 (n = 123) (McClelland et al 2014); six catchments in the headwaters of the Kuparuk and Sagavanirktok (upper Kuparuk, Imnavait, Atigun, Roche, Oksrukuyik and Trevor) in 2009 and 2010 (n = 480) (Khosh et al 2017, Lehn et al 2017); and eight rivers east of the Sagavanirktok (Kavik, Canning, Hulahula, Okpilak, Jago, Aichilik, Kongakut, and Turner) in 2011–2014 (n = 48). In total, data from 921 samples were included in this synthesis effort.
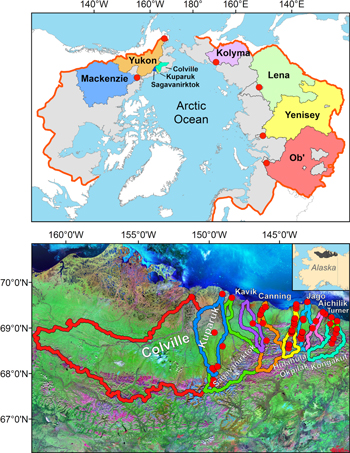
Figure 1. Sampling locations (red dots) within drainage basins of the 20.5 × 10⁶ km2 pan-arctic watershed (top; bold red line) and the North Slope of Alaska (bottom). Watershed boundaries on the North Slope of Alaska are superimposed on a false color composite image that displays bare soil and rock as pink/magenta and vegetation as bright green.
Download figure:
Standard image High-resolution imageProcedures for sample collection and analysis for the eastern North Slope rivers are described in the supplementary information (Text S1 is available online at stacks.iop.org/ERL/13/104015/mmedia). Refer to Holmes et al (2012), McClelland et al (2014), and Khosh et al (2017) for details on the other river systems. Concentration data for each sampling location were binned into seasons that correspond to distinct hydrologic phases: winter low flow from 1 October to 15 May, spring high flow between 16 May and 30 June, and summer intermediate flow from 1 July to 30 September. Although there is variability in the timing of seasonal river discharge across the pan-Arctic (McClelland et al 2012), these bins successfully capture the major seasonal transitions in flow that have been documented in all of the regions included in this study (Holmes et al 2012, McClelland et al 2012, McClelland et al 2014, Khosh et al 2017). However, winter flow only applies to the larger rivers included in this study since none of the rivers draining the North Slope of Alaska exhibit appreciable flow during the winter period. Each sampling location was assigned a single concentration value for DOC, DON, and  for each season where data were available (seasonal coverage varied among sites). In some catchments east of the Sagavanirktok River, seasonal concentration values were from single sampling events. Where several days within a season and/or multiple years of data were collected at the same site, mean values were calculated for each season. In these cases, seasonal and yearly coverage ranged from two to 33 discrete samples collected per season throughout a 1–10 year time period. All three constituents were measured with exception of
  and DON for eight of the 52 summer sites and two of the 35 spring sites east of the Sagavanirktok. Although it would have been desirable to account for concentration changes related to river discharge variability within seasons (Eimers et al 2008, McClelland et al 2014), discharge data were not available for most of the sites included in this study.
2.2. Slope-concentration regression models
Methods used to define watershed boundaries, slopes, and soil organic matter content for the contributing areas upstream of each sampling location are described in the supplementary information accompanying this paper (Text S2). Season-specific regression relationships between watershed slope values and constituent concentrations were examined using two different datasets: (1) an 'all data' case where data from all sites were used and (2) a 'balanced' case where only data from sites with equal spring and summer sampling coverage were included. The number of data points in each case can be found in table S1. This approach allowed us to characterize relationships using maximum data coverage while also accounting for potential differences between regression relationships that could result from unbalanced seasonal sample coverage. Relationships between watershed slope and concentrations of DOM were best explained using a natural log-linear fit of the data. The relationships between  concentration and watershed slope were best defined using a standard linear fit. An analysis of co-variance (ANCOVA) was employed using R software to test for significant differences in slopes and intercepts between spring and summer regression lines for relationships using all available data and the balanced dataset. Regression coefficients can be found in the supplementary information (table S1). We could not determine relationships between winter river concentrations and watershed slope using the small subset of available data (n = 6), although it is possible patterns would emerge with better data coverage. To observe scale-dependent effects, data were additionally grouped for assessment within the following watershed size intervals: 0–100 km2, >100–2000 km2, >2000–5000 km2, >5000–60 000 km2, and >60 000–2700 000 km2.
2.3. Estimation of DOM fluxes for select Eurasian arctic rivers
Daily discharge measurements for the Pechora, Mezen, Severnaya Dvina, Olenek, and Yana rivers were gathered from the ArcticRIMS stream discharge database (http://wsag.unh.edu/arctic/RIMS-Old/group/real_time/) and from personal communications with A Shiklomanov (University of New Hampshire). Average annual discharge was calculated during the 2001–2008 timeframe for the Pechora, 2003–2013 for the Mezen, 2002–2013 for the Severnaya Dvina, 2002–2008 for the Olenek, and 2002–2013 (except 2008) for the Yana. In a few cases where daily values were missing, mean values from the same month were used for interpolation.
Spring and summer DOC and DON concentrations for the Pechora, Mezen, Severnaya Dvina, Olenek, and Yana rivers were estimated using the 'balanced' regression relationships reported in table S1. Winter concentrations for these rivers were estimated by averaging winter data from the six largest arctic rivers (5.4 ± 2.3 SD mg DOC l−1 and 0.16 ± 0.05 SD mg DON l−1). Seasonal discharge was estimated by the sum of daily discharge values corresponding to the season-specific concentration bins and then multiplied by these concentrations to estimate seasonal fluxes. Annual fluxes were estimated from the sum of winter, spring, and summer fluxes and averaged across years.
3. Results and discussion
Our analysis revealed that concentrations of DOM are tightly coupled to mean watershed slope across a wide range of catchment sizes and geographical locations in the Arctic. Strong negative nonlinear relationships exist between watershed slope and concentrations of DOC and DON, where lower catchment slopes correspond with higher concentrations and steeper catchment slopes correspond with lower concentrations (figure 2). These relationships are qualitatively similar between the spring and summer periods; however, concentrations are higher during the spring. This seasonal difference is particularly evident in the balanced dataset for DOC, where the ANCOVA test identifies that regression line slope values are the same, but a significant difference in y-intercept values exists between the spring and summer periods (table S1). This demonstrates that there is a consistent offset between spring and summer concentration data across the range of catchment slopes. The observed seasonal shift is consistent with previous findings for arctic regions, where frozen ground constrains snowmelt to surface and shallow soil flow paths that facilitate leaching of organic-rich soils and overlying vegetative material from the previous growing season (Guo and Macdonald 2006, Spencer et al 2008, Khosh et al 2017, Lehn et al 2017). Overall, watershed slope explains a remarkable 75% and 70% of the variability in spring concentrations of DOC (mg C l−1) and DON (mg N l−1) and 62% and 65% of the variability in summer concentrations of DOC and DON across catchments that span seven orders of magnitude and a broad geographic scope (figure 2). Moreover, the 95% confidence intervals bounding these relationships (table S1; dashed lines in figure 2) demonstrate that the regression models are well constrained across the wide range of conditions represented. These results are consistent with the more regionally-focused results reported by D'Amore et al (2016), revealing that catchment slope was the best predictor of spring and fall stream DOC concentrations of the Alaskan perhumid coastal temperature rainforest.
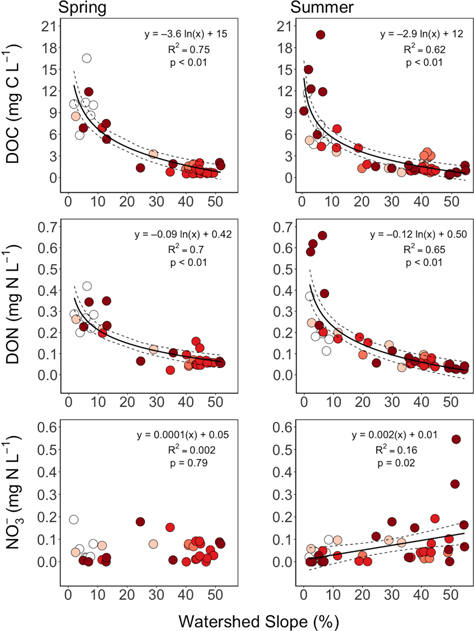
Figure 2. Spring (left) and summer (right) relationships between watershed slope and concentrations of fluvial dissolved organic carbon (DOC; top), dissolved organic nitrogen (DON; middle), and nitrate ( bottom) of river water collected from catchments of various sizes using all available data: 0–100 km2 (
 ), >100–2000 km2 (
 ), >2000–5000 km2 (
 ), >5000–60 000 km2 (
 ), and >60 000–2700 000 km2 (
 ). Dashed lines mark the upper and lower limits of the 95% confidence interval bands.
Download figure:
Standard image High-resolution imageWhile seasonality accounts for much of the temporal variability in DOM concentrations observed in arctic rivers, and a large proportion of annual DOM export occurs during the spring (Holmes et al 2012), this analysis demonstrates that seasonal variations within individual rivers are relatively small compared to variations in DOM concentrations across catchments with different morphometry. For example, concentrations of DOC at specific watershed slope values differ by one to two-fold between spring and summer (balanced dataset), while DOC concentrations differ by an order of magnitude across the full range of slopes represented in this study (figure 2). As a more specific example, consider two adjacent rivers with very different watershed slope values: the Kuparuk has a slope of 2.5% whereas the Sagavanirktok has a slope of 29%. Differences between spring and summer DOC concentrations for the Kuparuk (8.5 and 5.1 mg DOC l−1 respectively) and Sagavanirktok (3.3 and 1.3 mg DOC l−1 respectively) are much smaller than season-specific differences in DOC concentrations between these two rivers.
Changes in DOM concentrations among catchments generally reflect differences in proportional contributions of peatland and/or coastal plain versus mountainous terrain and may be more specifically related to contrasts in soil organic matter content and water flow through soils among drainage basins (Judd and Kling 2002, Neff and Hooper 2002, Frey and Smith 2005, McGuire et al 2005). These gradients in terrain can be seen visually in figure 1 (bottom panel), where watershed coverage by coastal plain tundra and vegetation (green areas) decreases relative to coverage by mountainous terrain (pink areas) moving from west to east across the North Slope of Alaska. Our analysis of variations in soil organic carbon content (SOCC) among the study watersheds shows that SOCC is significantly related to watershed slope (figure 3), with a markedly similar negative nonlinear relationship compared to DOM relationships. Overall, watershed slope explains 57% of the variability in SOCC among the drainage basins analyzed in this study. The extent to which high SOCC is related to watershed DOM concentrations, however, depends on the pervasiveness of soil saturation and water flow from land to streams (Creed et al 2003, 2008). Longer water residence times have the potential to facilitate more leaching of DOM from soil organic matter stocks in low relief peatland terrain, which is shunted to stream and river networks during periods of high hydrologic connectivity (Ågren et al 2008, Creed and Beall 2009, Winn et al 2009). The linkage between watershed slope and fluvial DOM concentrations around the pan-Arctic likely reflects a strong correlation with functional wetland coverage that integrates variability in SOCC as well as hydrologic connectivity to stream and river networks (D'Amore et al 2016, Harms et al 2016). This is supported by a substantial body of literature demonstrating that low relief regions or wetlands play a key role in regulating DOM export and are a major source of DOM to rivers (e.g. Dillon and Molot 1997, Gorham et al 1998, Hinton et al 1998, Gergel et al 1999, Xenopoulos et al 2003, Pellerin et al 2004, Inamdar and Mitchell 2006, 2007). We do not see clear evidence of scale-dependent effects on slope-concentration relationships for DOM that would allow us to determine how (if at all) watershed size correlates to fluvial DOM concentrations (figure 2). However, as additional catchment slope and fluvial DOM concentration data are collected in the future, some aspects of scale dependence may emerge.

Figure 3. Relationship between watershed slope and SOCC of all watersheds and sub-catchments included in this study except the Ob'. Dashed lines mark the upper and lower limits of the 95% confidence interval bands. Symbol colors are as defined in figure 2.
Download figure:
Standard image High-resolution image
Patterns for  are more variable, but a significant positive relationship exists between summer
  concentration (mg N l−1) and watershed slope (figure 2). The lack of a relationship between watershed slope and
  concentration during the spring suggests that sources and losses of
  do not differ among catchments when water flow paths are constrained to near-surface soil layers and cold temperatures moderate biological uptake rates. A positive relationship between
  and watershed slope emerges in the summer, when thawing soils allow water penetration to deeper soil layers. In general, this is consistent with steeper catchments having (1) a greater proportion of mineral soils relative to organic soils and (2) short water residence times in soils. This is supported by previous studies demonstrating that lower
  concentrations are expected where low slopes promote water-saturated anoxic conditions that facilitate denitrification and low flow rates that facilitate
  uptake by primary producers (Jones et al 2005, Inamdar and Mitchell 2006, Creed and Beall 2009, Harms and Jones 2012, Louiseize et al 2014, Harms et al 2016). On the other hand, fluvial
  concentrations are typically higher in catchments with steeper slopes because rapid water transit during rain events promotes the export of stored
  in mineral soils that make up a greater portion of the seasonally thawed active layer (Schiff et al 2002, Inamdar and Mitchell 2006, Harms et al 2016, Khosh et al 2017). Thus, as for DOM, differences in water residence times, hydrologic connectivity to surface waters, and the proportion of mineral to organic soils (expressed as SOCC) are factors that help explain the positive relationship between summer
  concentrations and watershed slope. However, the relatively weak relationship between concentration and watershed slope for
  as compared to DOM suggests that additional factors contribute to the variability in fluvial
  concentrations across catchments. In contrast to DOM, there is some evidence for scale dependence of watershed slope-concentration relationships for
  the overall increase in summer
  concentrations as a function of watershed slope appears to be, in part, driven by data from catchments <5000 km2 (figure 2). This may reflect increasing (cumulative) process/removal effects as
  is transported downstream within large catchments.
Concentration and flux estimates for the Pechora, Mezen, Severnaya Dvina, Olenek, and Yana rivers in Eurasia demonstrate how the generalized relationships between DOM and watershed slope can be applied to other drainage basins within the pan-arctic domain. Estimates of DOC and DON concentrations for these rivers ranged from 5.3 to 14.2 mg C l−1 and 0.19 to 0.39 mg N l−1, respectively (table 1). In combination with river discharge data, these concentrations translate into flux estimates of 183 to 998 Gg per year for DOC and 5 to 29 Gg per year for DON (table 1). In most cases, our slope-based concentration estimates are similar to concentration values previously reported in the literature (table 1). One notable exception is the Yana, where our estimates of DOM concentrations are substantially higher. This may be due to a difference in seasonal representation: samples for the Yana were collected during August for the Lobbes et al (2000) study, when lower values would be expected. Recent DOC estimates from a seasonally-explicit field study of the Severnaya Dvina River (Johnston et al 2018) may provide the best opportunity for comparison since temporal transitions in discharge were considered and samples were collected multiple times within a season over several years (2013–2016). Our estimates of DOC concentrations for the Severnaya Dvina are similar to field measurements from Johnston et al (2018) for the spring (14.6 ± 0.8 mg C l−1), but are lower than their measurements for the summer (13.7 ± 1.1 mg C l−1). This suggests that our slope-based model may be over-estimating spring to summer decreases in DOC concentrations in the Severnaya Dvina region. Comparing our flux estimates to other studies (e.g., review by Dittmar and Kattner 2003) is challenging because inter-annual variations in water-borne constituent fluxes primarily reflect differences in water discharge between years (McClelland et al 2012). The study by Johnston et al (2018) does, however, provide one recent opportunity for comparing flux estimates. Our annual DOC flux and discharge estimates for the Severnaya Dvina (896 ± 54 Gg and 99 ± 5.8 km3 yr−1 between 2002 and 2013) are similar to the 1190 ± 72 Gg and 86 ± 3.7 km3 yr−1 estimates between 2014–2016 from Johnston et al (2018). For the other rivers in table 1, our flux values can be considered updates to the older estimates because they are based on more recent discharge data and explicitly address seasonal differences in concentrations.
Table 1. Average annual water discharge (km3 yr−1), estimated annual fluxes (109 g), and spring and summer concentrations (mg l−1) of dissolved organic carbon (DOC) and nitrogen (DON) for the Mezen, Olenek, Pechora, Severnaya Dvina, and Yana rivers. Concentrations were calculated using the balanced regression models defined in table S1.
| DOC (mg C l−1) | DON (mg N l−1) | DOC (109 g) | DON (109 g) | Q (km3 yr−1) | |||||
|---|---|---|---|---|---|---|---|---|---|
| River | Spring | Summer | Other studies | Spring | Summer | Other studies | Average annual estimates between 2000 and 2013 | ||
| Mezen | 13.6 ± 1.7 | 10.0 ± 1.2 | 12(a) | 0.37 ± 0.04 | 0.34 ± 0.04 | 0.22(a) | 183 ± 15 | 5.3 ± 0.42 | 20 ± 1.1 |
| Olenek | 10.5 ± 2.2 | 7.6 ± 1.5 | 10(a) | 0.30 ± 0.05 | 0.26 ± 0.05 | 0.25(a) | 401 ± 23 | 12 ± 0.70 | 44 ± 2.6 |
| Pechora | 11.8 ± 2.0 | 8.6 ± 1.4 | 13(b) | 0.33 ± 0.05 | 0.30 ± 0.04 | . | 998 ± 62 | 29 ± 1.8 | 108 ± 6.4 |
| S Dvina | 14.2 ± 1.6 | 10.4 ± 1.1 | 14–15(c) | 0.39 ± 0.04 | 0.35 ± 0.03 | . | 896 ± 54 | 26 ± 1.6 | 99 ± 5.8 |
| Yana | 7.4 ± 2.7 | 5.3 ± 1.9 | 2.8(a) | 0.22 ± 0.07 | 0.19 ± 0.06 | 0.09(a) | 221 ± 12 | 7.3 ± 0.37 | 37 ± 1.8 |
Note. Concentration estimates from (a) Lobbes et al (2000), (b) Gordeev et al (1996), and (c) Johnston et al (2018) are included for comparison. Values are ± 1 standard error. Standard errors for concentration values reflect estimates of error in the modeled concentration data, while standard errors for flux values reflect inter-annual variability in discharge.
4. Conclusions
In this paper, we synthesize data from a wide variety of rivers within the pan-arctic watershed that differ in location and size to quantify relationships between watershed slope and fluvial concentrations of DOM and  We find that variations in spring and summer concentrations of DOC and DON are strongly related to variations in watershed slope across a broad range of geographic locations and catchment sizes in the Arctic. Summer concentrations of
  also correlate with watershed slope, but greater variability in this relationship points to other dominant factors contributing to differences in fluvial
  among catchments. It appears that watershed slope serves as a master variable for estimating concentrations of DOM in rivers across the pan-arctic domain and that slope-related variability in soil organic matter content helps to explain this linkage. Owing to the remote locations and challenges associated with working in the Arctic, there is a general lack of river chemistry data that can be used as a basis for modeling and assessing contemporary watershed nutrient export. The relationships defined herein provide a tool for deriving first-cut estimates of DOM concentrations in arctic watersheds where undertaking direct field measurements is logistically prohibitive. Furthermore, when paired with gauged, modeled, or remotely sensed river water discharge data, these relationships enable improved DOM flux estimation for catchments without chemistry data.
Although our data did not show clear geographic differences in slope-concentration relationships for DOM, it is likely that regional distinctions related to other basin characteristics such as wetland abundance, hydrologic connectivity, permafrost coverage, and dominant vegetation types, which interestingly may also be directly controlled by watershed slope, would emerge with better data coverage. As additional concentration data are collected across the pan-Arctic, the development of region-specific relationships would be desirable. Given that the arctic system is rapidly changing, these relationships cannot be reliably applied to future scenarios. They do, however, provide a basis for near-term estimation of DOM concentrations as well as an opportunity for longer-term assessment of integrated changes in watershed biogeochemistry. In particular, tracking changes in slope-concentration relationships over time may be useful as an indicator of permafrost thaw, associated shifts in hydrology, and the transport of stored nutrients and organic matter from land to sea. Where water flow through mineral soils of low relief terrain or steeper catchments is enhanced, DOM export could decrease while fluxes of dissolved nutrients increase. Where organic-rich soils extend deep into permafrost, on the other hand, thawing coupled with changes in subsurface flow may actually mobilize large stores of soil organic matter and increase the delivery of DOM to stream and river networks. These landscape-scale changes may be visible from an upward or downward shift in relationships between fluvial DOM and  concentrations and watershed slope.
Acknowledgments
We thank several people and organizations for their help in this synthesis effort: Greg Fiske, Alexander Shiklomanov, Matt Nolan, Roy Churchwell, Randy Brown, Josh Koch, Matthew Schellekens, and Derek Frohbieter, the Arctic Wild LCC, Nuka Research and Planning Group, LCC, and Beverly Boynton and Adventure Scientists. This work was supported by NSF grants PLR-1602680, OPP-0436118, OPP-1107774, OPP-0732821, and OPP-0806827, as well as funding from the North and West Alaska Cooperative Ecosystem Studies Unit. Data used to generate figures 1–3 are made available in the supplementary information section.