

Abstract
China has experienced considerable economic losses from a severe deterioration in air quality. To solve this, a comprehensive understanding of the impacts and sources of air pollution is necessary. This study aimed to quantify the environmental and human health impacts of PM2.5 and O3 pollution from the six major emission-producing sectors in China. We utilized a chemical transport model to simulate the air quality impacts engendered by sectoral emissions. The consequent impacts on public health and crop production, as well as the corresponding collateral economic costs, were quantified by concentration-response functions. The results show that the sectoral emissions in 2010 caused approximately 1 143 000 (95% confidence interval (CI): 168 000–1 796 000) premature mortalities and a 20 035 (95% CI: 6776–32 166) Gg crop production loss. Of the six sectors, the industrial sector was the largest contributor of air pollution, accounting for 36% of the total impact on health, as well as 41% of crop production loss due to O3 exposure. The impacts attributable to sectoral emissions in China were estimated to cost ∼267 (95% CI: 180–360) billion yuan (0.66% of the annual GDP). Our findings suggest an urgent need to reduce anthropogenic emissions in China, particularly those of the industrial sector. The varying characteristics of impact due to emissions of various sectors highlight the importance of evaluating cobenefits when formulating emission control policies.
Export citation and abstract BibTeX RIS

Original content from this work may be used under the terms of the Creative Commons Attribution 3.0 licence.
Any further distribution of this work must maintain attribution to the author(s) and the title of the work, journal citation and DOI.
Introduction
Numerous studies have shown the adverse environmental and public health impacts associated with the exposure of fine particulate matter (PM2.5) and tropospheric ozone (O3) pollution in China (Zhang et al 2017, Apte et al 2015, Kan et al 2012). A thorough appreciation of the pathways and contributions from sectoral emissions to air pollution is essential to formulate effective emission control policies. A number of studies have investigated the health impacts of the respective emissions-producing sectors in China (Yamaji et al 2010, Wang et al 2008, 2009, Lei et al 2011, Hao et al 2007, Pozzer et al 2017), as well as potential emission control strategies (Fujii et al 2013, Peng et al 2017b, Ji et al 2012, Zhang et al 2013). For example, Liu et al (2016) investigated the impacts of household emissions on air quality in the winter (January and Feburary) of 2010. They reported that residential emissions were a major source of pollution in Beijing, Tianjin, and the Hebei region during the study period. Their study revealed that a substantial portion of the emissions originated from household heating and cooking activities in the North China Plain. Lelieveld et al (2015) estimated the contribution of various sectors on global premature mortalities. Their study reported that the residential energy and agriculture sectors were the two largest global contributors to premature mortalities in China, followed by the power generation sector. Pozzer et al (2017) estimated that outdoor air pollution caused approximately 1.3 million premature mortalities in China, of which an estimated 300 000 were due to emissions from the agriculture sector.
In addition to the public health damages, anthropogenic air pollutant emissions have other environmental impacts. Recent research has reported that anthropogenic emissions threaten food security by exerting a remarkable impact on crop production. Feng et al (2015) performed a comprehensive review of the impacts of surface O3 on food crops in China. They concluded that O3 pollution caused a wheat yield loss of 6.4%–14.9% in China. Wang and Mauzerall (2004) investigated the cost of crop production loss due to the exposure of O3 in China, Japan, and South Korea from the past to the future. The study concluded that the cost of O3 exposure on crop loss would increase significantly in the near future. Recent studies further linked the significant loss of crop productions with multiple health endpoints, particularly for kids (Lloyd et al 2011, Lake et al 2012).
This study evaluated the long-term impacts of sectoral emissions in China. In particular, this study examined the impacts on air quality, public health, and crop production, and quantified the associated economic costs. The impacts of various sectors were compared, providing opportunities to formulate co-beneficial emission control policies in China.
Methods
This study applied a well-established regional air quality model (the Community Multiscale Air Quality Modeling System) to simulate air quality in China. A number of simulations were performed, including a baseline case that included all emissions and six sector scenarios whereby the emissions of each sector were removed in sequence. The six sectors were defined as: (1) agriculture (AGR) (agriculture and agricultural waste burning); (2) power generation (PG) (electricity generation); (3) ground transportation (GT) (road transportation, rail, pipelines, and inland waterways); (4) industrial (IND) (energy production other than electricity generation, industrial processes, solvent production and application); (5) residential and commercial (RAC) (heating, cooling, equipment, and waste disposal or incineration related to buildings); and (6) other sectors (OS) (other sectors that are not included above such as biogenic sources, fire, dust, and aviation). Differences in PM2.5 and O3 between the baseline simulation and the simulation for each sector were considered as the contribution of that particular sector. The consequent impacts on public health, in terms of premature mortalities, crop production loss, as well as the associated economic costs, were quantified by concentration-response functions, with quantification of uncertainties presented at a 95% confidence interval. Further details of the data and methods are provided in detail as follows.
Air quality model
This study adapted the chemical transport model, Community Multi-scale Air Quality (CMAQ) Model v4.7.1 (Byun and Schere 2006) to simulate the air quality in China in 2010 and the contributions from different emission sectors. In each case a 7 day spin-up simulation was conducted. Hourly meteorological fields were extracted from the outputs of the weather research and forecasting model v3.7 (Skamarock and Klemp 2008). Note that the original land cover information from USGS was updated by the land use datasets from the Data Center for Resources and Environmental Sciences, Chinese Academy of Sciences (RESDC), which has a better representation of land information at a 1 km resolution (Liu et al 2014). Boundary and initial conditions were derived from outputs of a global chemical transport model, GEOS-Chem v8.3.2 (Wang et al 2004, Bey et al 2001). Photolysis rates were calculated by the JPROC module, based on radiative forcing and chemical mechanism scheme. The model performance was evaluated by comparing model results with available observations. The model evaluation is provided in section 1.4 in the supporting information (SI) available at stacks.iop.org/ERL/13/084008/mmedia.
The baseline emission inventory for China in 2010 was compiled by anthropogenic air pollutant emissions from HTAP-V2 dataset (Janssens-Maenhout et al 2012), biogenic emissions from MEGAN-MACC dataset (Sindelarova et al 2014), and fire emissions from FINN v1.5 dataset (Wiedinmyer et al 2014). The anthropogenic emission dataset contained annual emissions from agricultural fertilization, road transport, aviation, shipping, energy generation, industry production, and domestic living. The fire emissions dataset recorded the emissions from both biomass burning and waste burning with the assistance of satellite observations. The dust emissions were estimated by the in-built windblown dust emission module of the CMAQ model. The summation of these emission sources was processed to construct a three-dimensional inventory, covering the whole of China except for the southern part of the Spratly Islands, see figure 1. The model was configured to have a 27 km gridded space with 26 vertical layers. CB05 and AE5 were chosen for gas-phase chemistry and aerosol chemistry mechanism, respectively. The speciation was also conducted in accordance with the chemical mechanism framework of air quality model. The information of emissions in our compiled model-ready emission inventory is provided in table S14 in the SI.
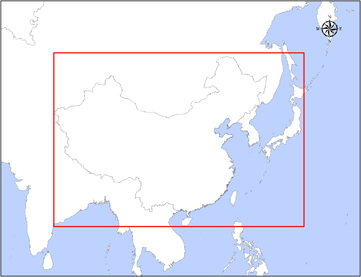
Figure 1. The model domain of this study was indicated by the red frame. The domain covered the whole of China, except for the southern part of the Spratly Islands.
Download figure:
Standard image High-resolution imageThe model performance was comprehensively evaluated by satellite-retrieved products and available ground measurements. We employed widely used statistical indicators to quantify the model performance. The statistical indicators included mean bias, correlation coefficient, and index of agreement. In general, the evaluation results show that the model results were robust in this study. The detailed discussion is provided in section 1.4 in the SI. The evaluation results were taken into account in our uncertainty quantifications as discussed later.
We calculated the baseline emission impact due to all emission sectors based on a simulation that included all the emission sources. Six sector scenarios whereby the emissions of each sector were removed in sequence. We note that a direct sum-up of all sector impacts may not be equivalent to the results of baseline simulation due to the nonlinear effect of emission to concentration. The relative contribution to PM2.5 and O3 concentration of a sector was calculated by dividing the impacts of the sector by the total impacts summed up of all the sectors. The relative contribution was then multiplied by the baseline emission impact to estimate the relative impact of the respective sector. On the other hand, the contributions to human health impact of a sector was estimated by multiplying the baseline health impact by the corresponding sector's contribution to baseline concentration. This method was widely used in air quality studies, such as Lelieveld et al (2015). The uncertainty of nonlinearity was further addressed and discussed in the uncertainty qualification section.
Human health impact
Different health endpoints were assessed in response to the sectoral contributions to PM2.5 and O3 concentration, which have been reported to have a direct link with cardiopulmonary disease and lung cancer (Pope et al 2009). Here we adapted China-specific concentration-response functions (CRF) (Gu and Yim 2016) to estimate the impact of PM2.5 on mortalities due to chronic obstructive pulmonary disease, ischemic heart disease, lung cancer, and stroke. Note that the toxicity of various PM2.5 species was assumed to be identical due to the lack of solid corresponding information in current epidemiological research. The mortality numbers due to the exposure of O3 were quantified by the log-linear form of CRF, specifically adapted for China. The basic form of this CRF for health endpoints (E) was shown as follows:
where RR for PM2.5 was resolved by:
RR for O3 was resolved by:
where k refers to the index of the domain grid; P refers to the population size based on various population datasets (Fu et al 2014, Columbia University 2005, 2013, Population Census Office 2012) for different area; and f refers to the baseline incident rate above 30 years of age based on the statistic results of Mainland China, Hong Kong, and Taiwan in 2010 (MOH 2011, DGBAS 2011, Census and Statistics Department of the Hong Kong Special Administrative Region (CSDHK 2015). Note that historical records of the regional incident rates in China were classified into urban and rural categories. The urban-rural division was therefore based on the land use types, derived from the Data Centre for RESDC (Liu et al 2014) and the Centre for International Earth and Science Information Network (Center for International Earth Science Information Network (CIESIN)/Columbia University 2013).
RR refers to relative risk. Xk and X0 are the pollutant concentration (µg m−3) in the target scenario and the threshold value, below which no additional risk was assumed to exist, respectively. The parameters α, β, and δ were fitted by nonlinear regression in our previous efforts (Gu and Yim 2016). The parameter γ was fitted by meta-regression based on the previous epidemiological study for China. The detailed information is provided in sections 1.5.1 and 1.5.2 in the SI.
Crop production loss
The crop production loss (CPL) of four major crop types: rice, wheat, maize, and soybeans due to O3 exposure were estimated by the product of annual yield (γ) and yield loss ratio (YLR):
where annual yield and growing calendar data for four types of crops in China were retrieved from Monfreda et al (2008). YLR was calculated based on the exposure-relative yield (ERY) relationships according to O3 exposure and specific types of crops (Wang and Mauzerall 2004). Crop exposure to tropospheric O3 was quantified by five exposure indices, including M7, M12, SUM06, AOT40, W126. The corresponding calculation method was provided in section 1.5.3 in the SI. These indices were initially proposed and mostly applied in the national crop loss assessment network (NCLAN) experimental studies in the US. ERY equations for rice, wheat, maize, and soybeans are provided in table S13 in the SI.
Economic costs
The social cost of the air pollution-attributable public health impact and crop production loss, due to one-year air pollutants emissions in China were estimated through different impact pathways of sectoral emissions.
The cost of public health damages was assessed in consideration of hospital expenditure (HE) and absence work loss (AWL). Hospital expenditure of a single morbidity or mortality case includes outpatient fee and hospitalization fee, which were estimated by a factor of local per capita gross domestic product (GDP). Such factor and residue were derived from linear regression between the statistics of local per capita GDP and local expenditure per mortality and morbidity (Xie et al 2016):

where PCGDP refers to per capita GDP; f denotes the categories of health expenditure; k refers to the index of the domain grid; E refers to two health endpoints: mortality and morbidity. α and β are the regression coefficients extracted from Xie et al (2016). The spatial distribution of GDP in 2010 was derived from the data center for RESDC (Liu et al 2014).
On the other hand, AWL refers to the incomplete production due to the absence of working. Such loss for morbidities is the fraction of GDP proportional to the average per capita work loss days (WLD) out of annual per capita total working days (WD: 260 days year−1). The rest of work loss comes from the accumulative work loss years for mortalities aged from 15–65 years old. The summation of work loss due to morbidities and mortalities contributes to the total work loss, which is expressed as:
where WLD was concluded as linear with annual average PM2.5 concentration, at the magnitude of 0.0207 (95% CI: 0.0176–0.0238) (Hurley et al 2005); y is mortality age estimated via China health statistics (MOH 2011).
The cost of crop production loss for four major crops was quantified as the product of the loss amount and crop value in the corresponding year. In this study, crop value by unit was calculated as the total crop value over the annual crop productions in 2010 extracted from the Food and Agriculture Organization of United Nations (FAO 2015).
Uncertainty quantification
The Monte-Carlo approach was applied to assess the uncertainties of health outcomes and crop production loss. We calculated a central estimation with 95% confidence intervals (95% CI) of overall uncertainty for each impact, which was realized 20000 times randomly assuming a triangular probability distribution T (low, nominal, high). Specifically, model uncertainty was adjusted by the normalized mean bias of model evaluation result: T (0.99, 1.14, 1.31) for PM2.5 and T (0.76, 0.98, 1.24) for O3; Spatial varied factors for addressing nonlinearities between sum-up of all sectoral impacts and baseline emission impacts were included for PM2.5 and O3, with the confidential range T (0.37, 2.24, 2.46) and T (2.26, 4.16, 15.95), respectively. Uncertainties of health impact estimation were originated to the coefficient uncertainties of concentration-response functions, which were resolved by the variety of nonlinear fitting. The detailed information is described in the section 1.5 in the SI. The results together with work loss days: T (0.0176, 0.0207, 0.0238) constructed the uncertainty in the economic cost of health impacts; in terms of crop production loss, uncertainties were attributable to the different O3 exposure estimation methods; the uncertainty of climate impacts was estimated by the coefficients uncertainty of response function. Each uncertainty factor was modeled through 20 000 realizations, each of which was picked up randomly to calculate impacts, and forming an approximate probability distribution. The ultimate impact uncertainty was estimated based on the median and 95% confidential interval of impact distribution. We note that the chemical mechanism of PM2.5 formation has yet to be fully understood, especially in the winter haze periods (Cheng et al 2016). This may induce some uncertainties in our PM2.5 calculation.
Results and discussion
Impacts on air quality
Figure 2 depicts the spatial distributions of annual surface PM2.5 and O3 concentration contributed by the various sectors in China. The industrial sector was the largest contributor to the annual surface PM2.5 in China, accounting for, on average, 32.0% of annual surface PM2.5 in China. The largest impact occurred in northern China, Sichuan and some metropolises in southern China. The second contributor was the residential and commercial sector, accounting for 24.9% of annual surface PM2.5 in China. Such impact dominantly came from the space heating and in-house cooking, which were particularly impacted in the winter season. The agriculture and power generation sectors exerted a similar level of contribution to annual surface PM2.5 in China, ranking the third and the fourth largest contributors, respectively. When combined, the two sectors (the agriculture and the power generation sectors) accounted for 28.4% of the annual surface PM2.5 in China. We note that the PM2.5 related to the agriculture sector was dominated by ammonium nitrate (see table S15 in SI). Ammonia (NH3) is predominantly emitted by cultivation activities due to the volatilization of fertilizers. Fu et al (2017) reported that excessive NH3 emissions could enhance the formation of PM, especially secondary inorganic PM. This supports our findings, as the agriculture sector had a relatively high level of secondary PM2.5 (shown in table S15 in SI). The ground transportation sector was estimated to contribute 7.3% of the annual surface PM2.5 in China. The remaining 7.4% of the annual surface PM2.5 was attributable to other sectors.

Figure 2. Annual surface PM2.5 (µg m−3) (upper panel) and O3 (ppb) (lower panel) due to various emission sectors in China. The numbers shown in the bottom right corner in the figures represent the corresponding population-weighted annual average.
Download figure:
Standard image High-resolution imageThe spatial patterns of sectoral contributions to the annual surface of O3 and PM2.5 were different. The industrial sector remained the largest contributor of annual surface O3 in China, accounting for 32.4% of the annual surface O3 concentration. Despite the significant sectoral impact on the annual surface O3, a reduction in O3 due to the industrial emissions occurred in major cities. The reduced production of O3 arose from urban O3 titration (Seinfeld and Pandis 2012), which occurred when excessive NOx was emitted in an environment with a relatively high ratio of nitrogen oxides (NOx) and volatile organic compounds. The second and third largest contributors were the power generation sector and the resident and commercial sector, which respectively contributed 28.7% and 9.5% of the annual surface O3. These three sectors together accounted for more than 70.0% of the annual surface O3 in China. The ground transportation sector contributed marginally (3.1%), whereas the agriculture sector caused a slight reduction in O3 (−2.0%), as mentioned (see figure 2). Agricultural emissions denote to the excessive NH3 emission due to the usage of fertilizer. Previous studies have reported the impacts of NH3 on O3. Makar et al (2009) and Wang et al (2011) reported that NH3 could affect aqueous chemistry by providing a weak base condition, thus enhancing the O3-induced cloud SO2 oxidation rate because O3 exhibits a higher oxidation rate under a weak base condition. Therefore, the concentration of O3 was reduced slightly while the concentration of SO42− increased, as shown in our results. Other sectors accounted for the remaining 28.3% of the annual surface O3 concentration in China.
Impacts on human health
We calculated the public health impacts of PM2.5 and O3 pollution due to emissions of the six studied sectors, which are summarized in figures 3 and 4. The results show that the emissions from the six sectors collectively caused an estimated 1 143 000 (95% CI: 168 000–1 796 000) premature mortalities, accounting for 12.0% of all-cause mortalities in 2010 in China. 76.3% of air pollution-related mortalities were due to PM2.5 pollution, while the remaining was attributable to O3 pollution. In general, the spatial distribution pattern of PM2.5-attributable mortalities and O3- attributable mortalities are similar, see sub-figure A of figures 3 and 4. The largest health impact attributed to PM2.5 and O3 pollution all appeared in the urban areas in eastern China, such as the Yangtze River Delta region and the Pearl River Delta region. Rural areas in Hebei, Henan, and Sichuan provinces (see their locations in figure S8) were also identified to receive noticeable health impact from PM2.5 and O3 pollution. By contrast, marginal impacts were found in western China due to its complex topography and smaller emission amount relative to the eastern part (Gu and Yim 2016). In terms of the sectoral contributions to pollution-related mortality, as shown in sub-figure B of figures 3 and 4, industrial sector contributed to the most of prominent PM2.5-attributable premature mortalities, while other sectors contributed to the most of prominent O3-attributable premature mortalities. Such difference may be due to the different nature of PM2.5 and O3 formation, as mentioned in the section of air quality impact.
Provincial health impact pattern due to PM2.5 and O3 pollution were also varied. The industrial and the residential commercial sector were estimated as the dominant sectors to the PM2.5-attributable mortalities for almost all provinces in China, except for some developed provincial divisions with the ground transportation as the second-largest contributor, including Shanghai, Zhejiang, Taiwan, Hong Kong, and Macau. Shandong, Henan, and Hebei were recognized to receive the top-three PM2.5-attributable mortalities in China, because the high exposure of PM2.5 pollution. As for O3-attributable mortality, the major contributing sectors were typically the industrial, power generation, and other sectors. Note that the industrial and other sectors exerted prominent negative impacts on ozone-attributable mortalities in some provinces, like Henan, Jiangsu, Zhejiang, and Chongqing. Such reductions probably due to the emissions of NH3 that enhance the oxidation rate of O3 and urban O3 titration, as described in the section of air quality impact. Shandong, Henan, and Sichuan were recognized to receive the top-three O3-attributable mortalities in China.
Our results show that the industrial sector and the residential and commercial sector were identified as major contributors to total health impacts, accounting for 36.2% (∼414 000 (95% CI: 61 000–640 000)) and 20.0% (∼229 000 (95% CI: 34 000–354 000)) of the total values, respectively. In terms of spatial distribution, the premature mortalities caused by these two sectors showed more spatial heterogeneity, compared with the other four sectors. A possible explanation for this is the higher ambient air pollution in urban areas resulting from the aggregation of the residential and commercial sector and the industrial sector near urban areas. Overall, 43.8% of the total health impacts apportioned to the remaining sectors are outlined as follows: power generation (∼183 000 (95% CI: 27 000–288 000)), ground transportation (∼73 000 (95% CI: 11 000–115 000)), agriculture (∼129 000 (95% CI: 19 000–203 000)), and other sectors (∼115 000 (95% CI: 16 000–196 000)).
Impacts on crop production
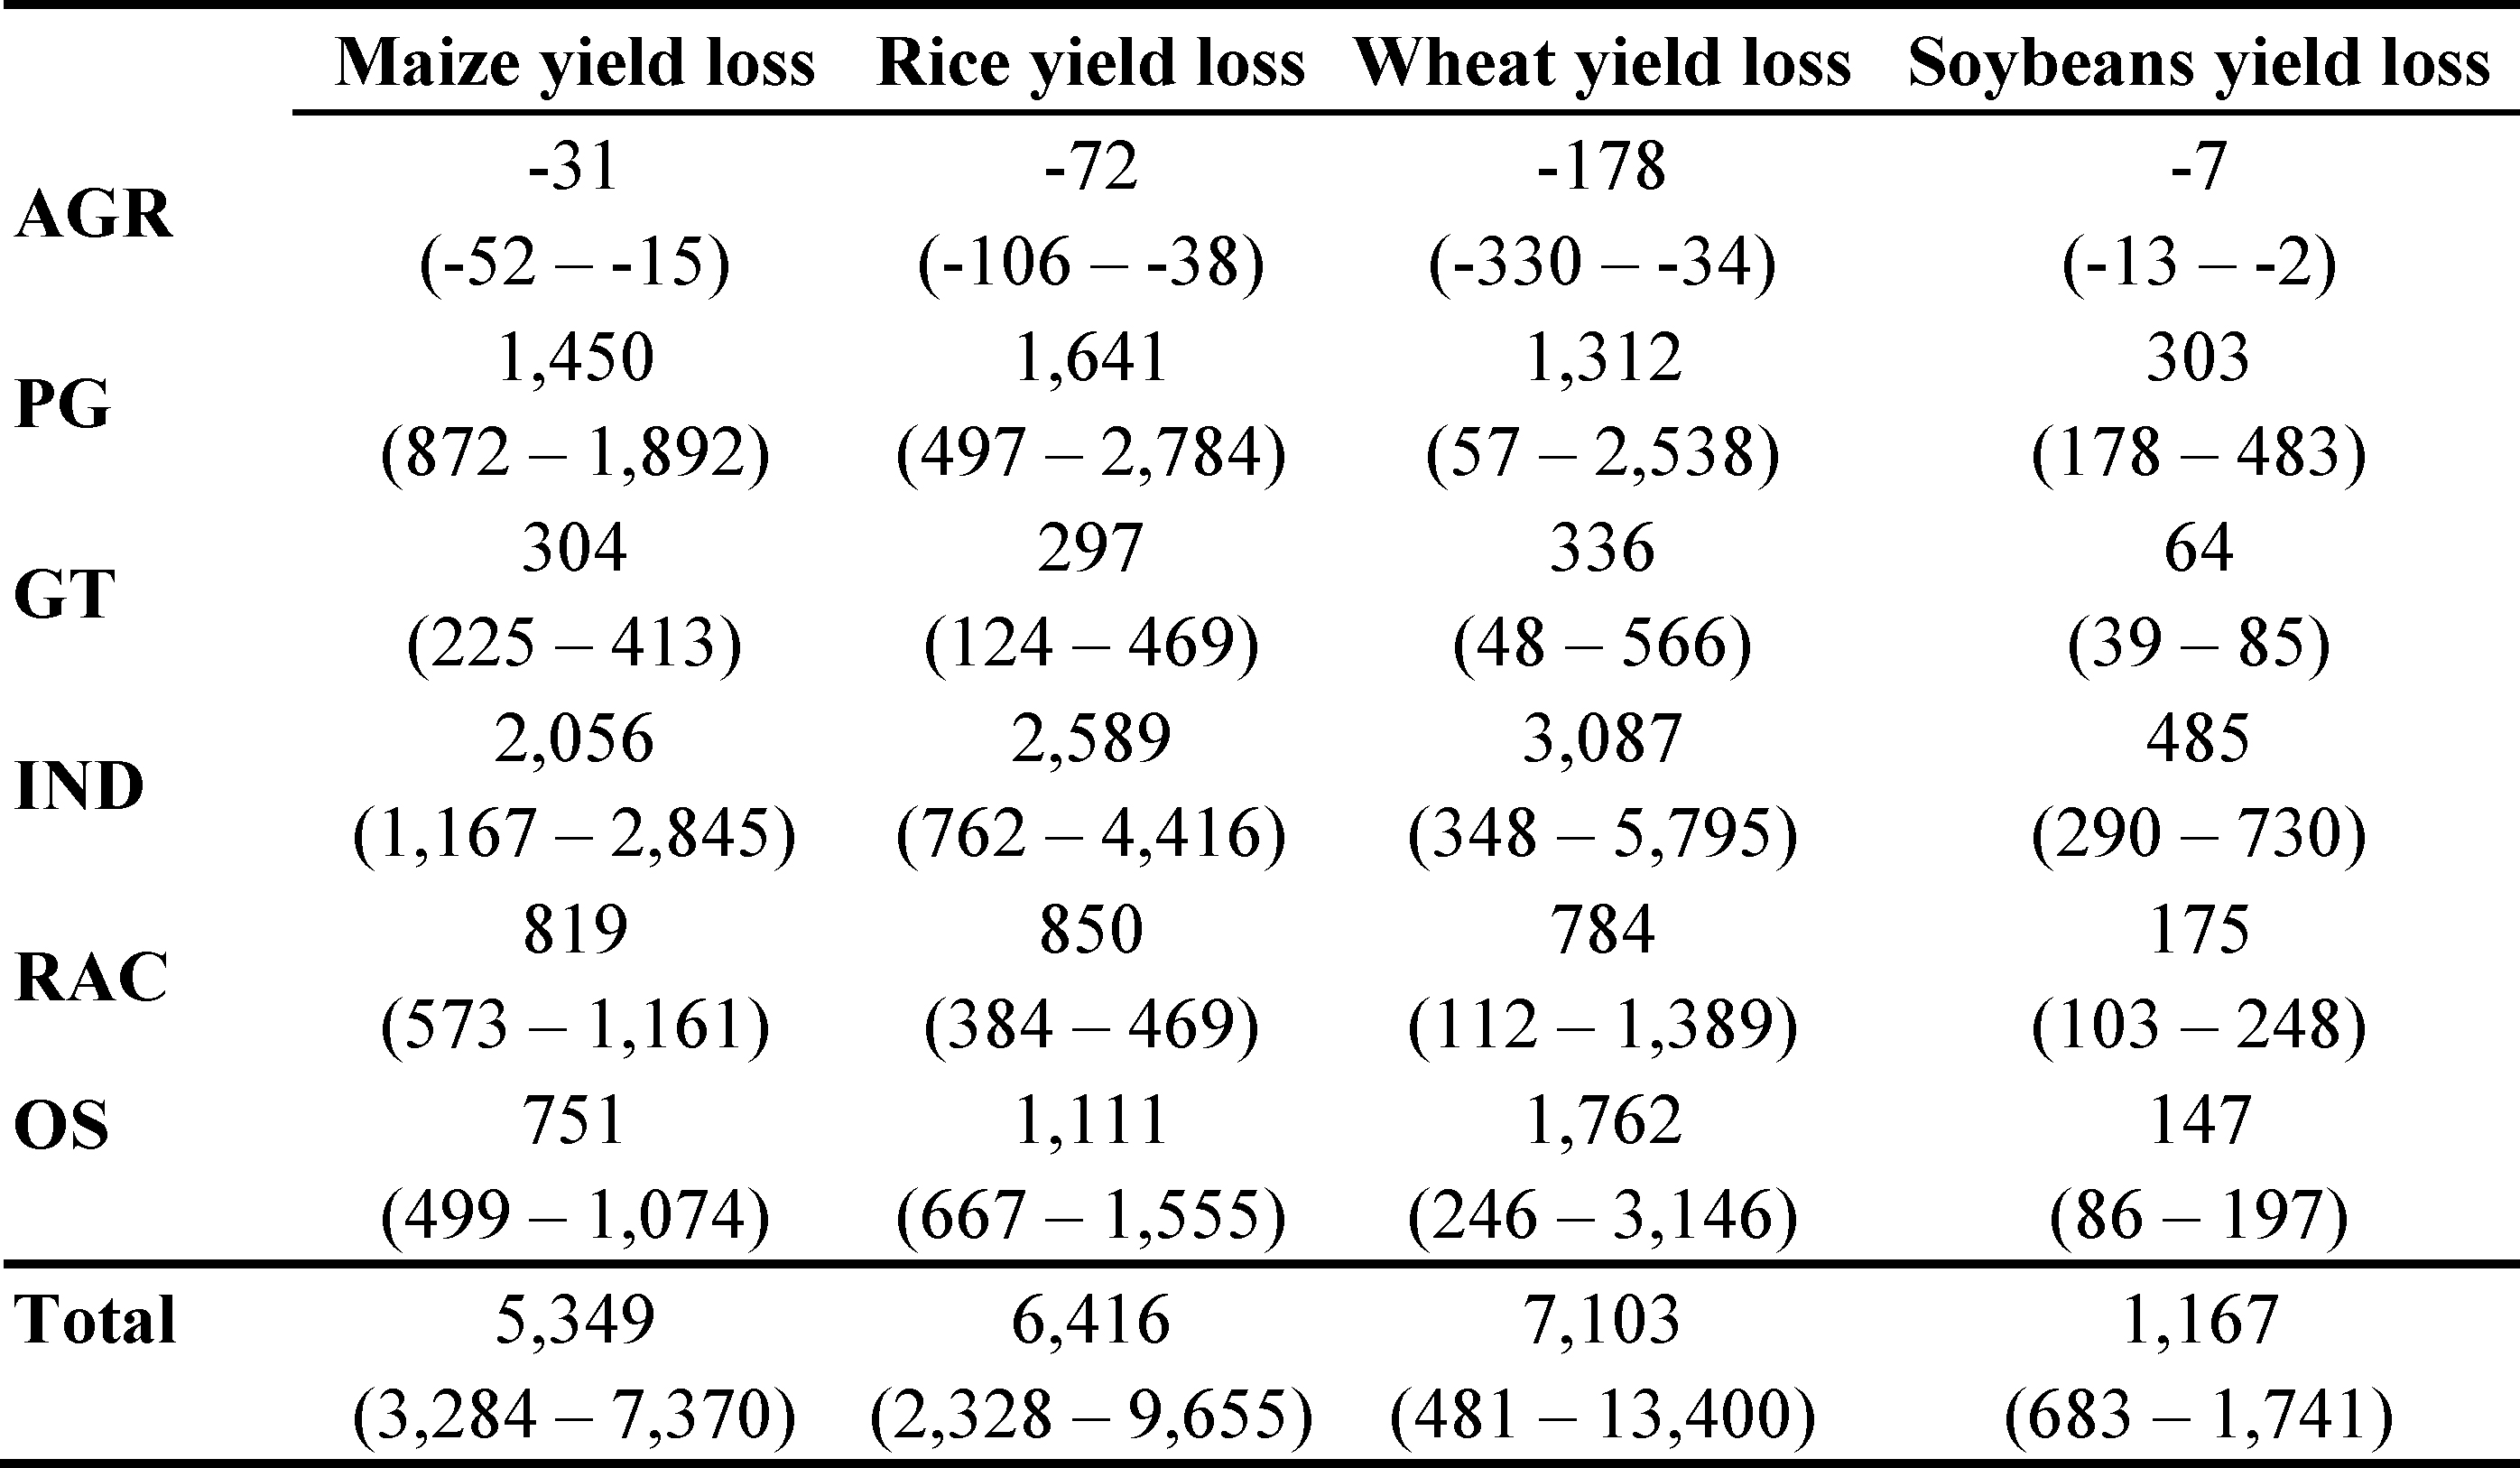
O3 pollution affects crop production in various ways, including damaging foliage, decreasing photosynthetic efficiency, reducing nutrient and water uptake, and increasing grain abortion (Wargent and Jordan 2013). Figure 5 and table 1 show the spatial distribution and summary of production losses of four major crop type due to sectoral emissions in China, respectively. Our calculations show that the total crop production loss majorly occurred in northeastern, eastern, and southwestern China. Industrial sector was the dominant sector of this impact for almost all of China, while the power generation and other sectors showed their dominance in the northern China and some sporadic regions in the southwest part of China, respectively, see the lower panel of figure 5. For different crop type, rice production loss happened in the southern part of China, dominantly affected by industrial emissions. Soybean production loss occurred in the northeastern and southwestern part of China, majorly contributed by industrial and other sectors' emissions. Wheat production loss located in the central and western part of China, mainly due to the emissions from industrial and power generation sectors. Maize production loss mainly took place in the northeastern and western part of China, which was attributable to the industrial and power generation emissions. Based on our results the industrial sector (41% of the total impact) and the power generation sector (23% of the total impact) were the two largest contributors. With the exception of agriculture, all the sectors had a negative effect on crop production. Previous section has explained the fact of positive impact of agriculture sector on O3 concentration. The positive impact of NH3 emissions on O3 pollution compensated for the total O3-induced crop production loss due to sectoral emissions. In summary, the emissions from the six major sectors caused the loss of approximately 20 035 (95% CI: 6776–32 166) Gg crops in China. The industrial sector caused the most damage to crop production (41%), and the corresponding estimates are outlined as follows: wheat (approximately 3087 crops (95% CI: 348–5795)) Gg, rice (approximately 2589 (95% CI: 762–4416)) Gg, and maize (approximately 2056 (95% CI: 1167–2845)) Gg.
Table 1. Total crop production loss (Gg) caused by sectoral emissions in China (95% confidence intervals) of each sector to the impacts. The crop types include maize, rice, wheat, and soybeans. The results were rounded up to the nearest integer. The values in the parentheses are the 2.5th and 97.5th percentiles.
 |
Economic cost and policy implication
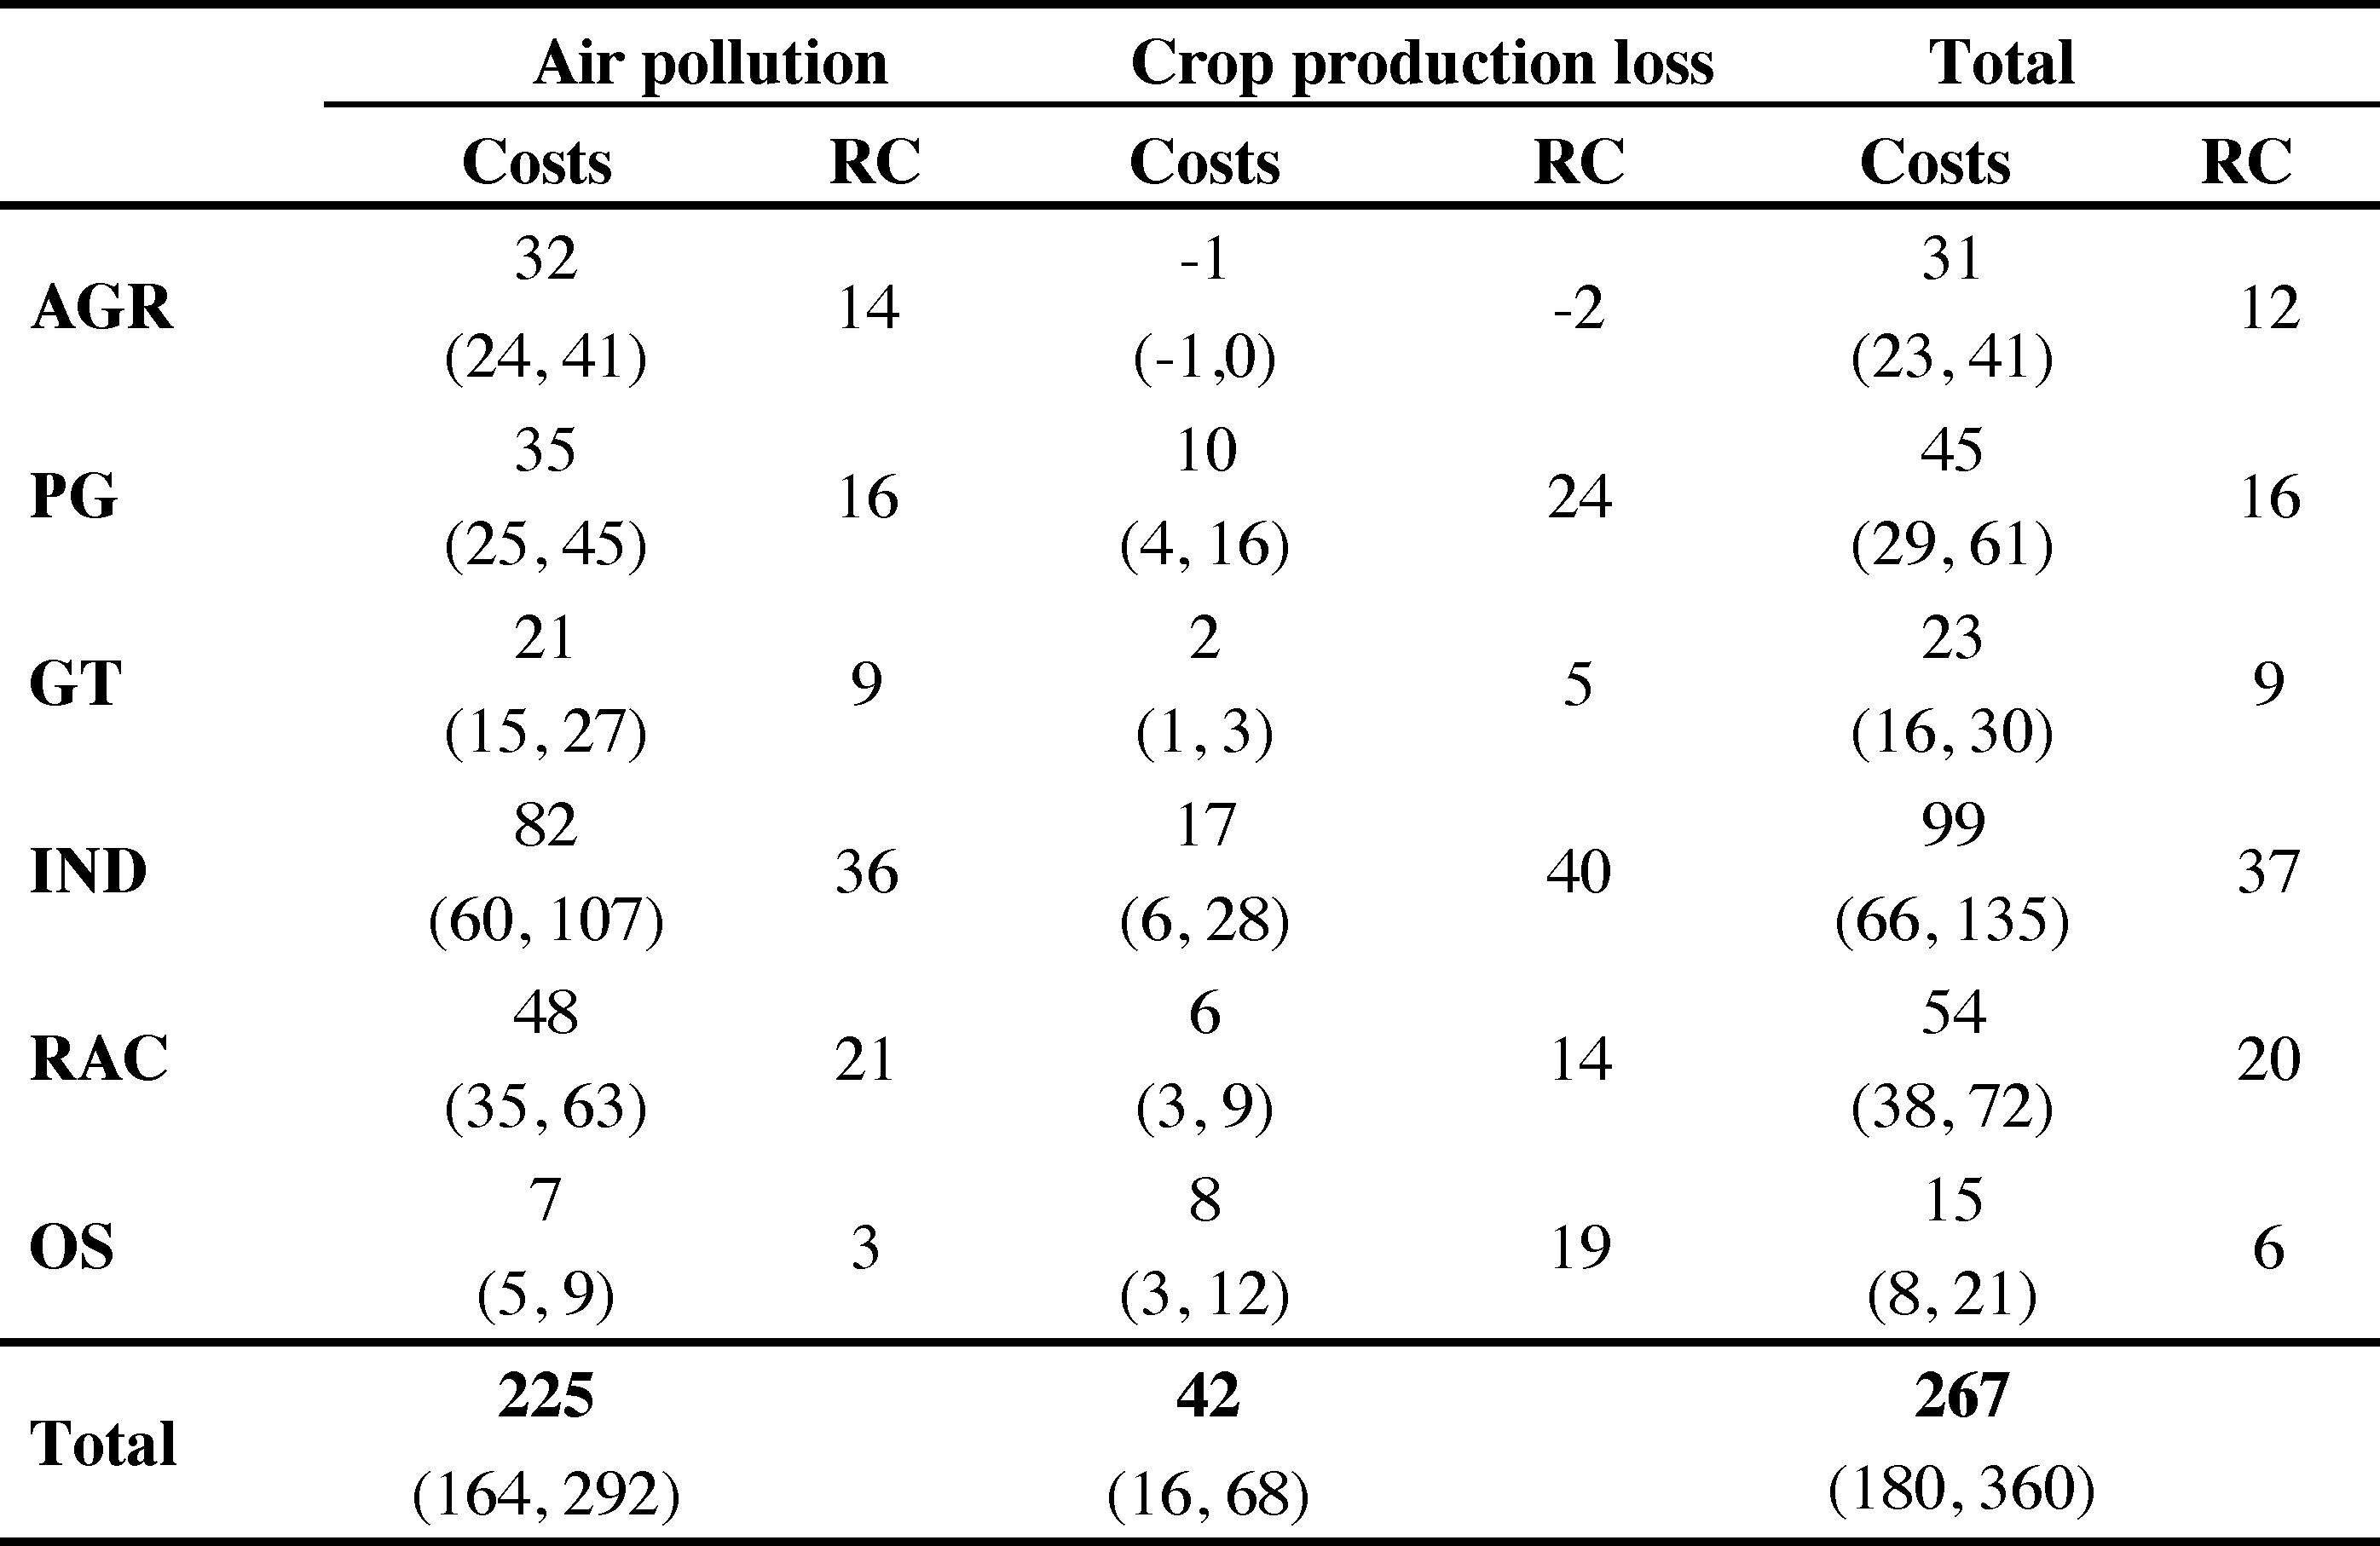
Table 2 shows the economic cost of air pollution-related premature mortality, and crop production loss due to sectoral emissions in China. Our estimation indicates that the sectoral air pollutants emissions in China led to an economic cost of ∼267 (95% CI: 180–360) billion yuan (0.66% annual GDP) in 2010. These findings suggest an urgent need to reinforce efforts to reduce anthropogenic emissions in China.
The industrial sector and residential and commercial sector were the two largest contributors, together accounting for 57% of the total economic cost. More effort should be thus put on controlling the emissions of these two sectors. The breakdowns show that the relative contributions of power generation emissions to air pollution were lower than those of the residential and commercial sector, while power generation was one of the dominant contributors of crop production loss, larger than residential and commercial sector. When combining, the economic cost of power generation sector and residential and commercial sector were similar. Here, we provide the detailed cost table for each breakdown, which is anticipated to serve as a useful reference for enacting cobeneficial emission control strategy with different emphasizing aspects to maximize its effectiveness.
Except for the aforementioned three sectors (the industrial, power generation, residential and commercial sectors), the agriculture and ground transportation sectors also show the comparable impacts on public health and crop production. These results highlight a higher potential to formulate cobenefit emission control policies for these two sectors. Even though agricultural emissions exerted a positive impact (negative number in table 2) on crop production due to the associated O3 reduction, the agricultural sector shows a larger impact on public health than on crop production loss. More stringent emission control policies on agricultural sector may thus have an important implication on air quality due to its NH3 emission that is a key precursor of secondary inorganic particulate matter. Emissions of other sectors accounted for merely 6% of the air pollution-related health impact, while their contribution to crop production loss can be as high as 25%, which reflect their considerable impact on O3 and the corresponding spread spatial pattern.
Table 2. Economic costs (billion RMB, 2010 currency rate) of various impact types due to sectoral emissions in China in 2010 and the relative contributions (RC) (%) of each sector to various impacts. The results are at a 95% confidence interval and rounded up to the nearest integer. The values in the parentheses are the 2.5th and 97.5th percentiles.
 |
Discussion
The overall estimations of public health impact and crop production lost in this study were consistent with previous study. Global Burden of Disease study concluded that 1 163 000 premature mortalities in China in 2010 were attributed to the ambient PM2.5 and O3 (Cohen et al 2017), similar to the 1 143 000 estimated in this study. Estimated total crop production lost and detailed breakdown for different crop types due to the exposure of ambient ozone pollution was also compatible with previous finding (Wang and Mauzerall 2004). However, the estimations of health outcomes due to sectoral emissions were varied because of the continuous updating of concentration-response correlations with different coefficient configuration. We compared our health impact results with those reported in the literature. GBD MAPS Working Group reported that ambient PM2.5 pollution due to the emissions of the industry, energy, domestic, and transportation sectors contributed to 224 000, 78 000, 200 000, and 123 000 premature mortalities in China in 2013, respectively (GBD MAPS Working Group 2016). We note that their study reported lower mortalities due to emissions of the industry and energy sectors. It may be because of the implementation of saving energy consumption and emission reduction measures between 2010 and 2013. On the other hand, their reported mortality due to the transportation sector was higher, which may be because of the rapid growth of vehicle number from 2010–2013 that increased emissions of the transportation sector. Nevertheless, our estimation was consistent with their findings, especially for that due to emissions of the domestic sector. Liu et al (2016) estimated that residential emissions were the largest contributor among all the sectors in China in Jan and Feb. Our results (40.5%) for these two months agreed with their findings (53%) as expected due to the substantial emissions from domestic heating during the period. Our results further show that the impact of residential emissions became smaller than that of the industrial sector in most of other months. Pozzer et al (2017) estimated that premature mortalities in China due to outdoor PM2.5 were ∼1.3 million, of which 19.7% were attributable to agricultural emissions, showing a consistent result with our finding (15.4% is due to agricultural sector). Lelieveld et al (2015) estimated that the global residential and agricultural sectors were the two major contributors in term of public health impact in China due to air pollution. Our results show that the China industrial sector was the largest contributors to its public health impact due to outdoor PM2.5 and O3 pollution, which was consistent with previous measurement study (Karagulian et al 2015). These results indicate the various natures of air quality impacts due to emissions of all sectors. Peng et al (2017a) evaluated the effectiveness of various emission control scenarios on mitigating public health problems due to outdoor air pollution. They estimated that the scenario that mainly reduces industrial emissions would provide the largest air quality benefit among various studied scenarios. Their findings supported our results, implying that more afford on controlling industrial emissions is required to mitigate the health impacts due to outdoor air pollution.
Our estimations highlight that emissions of one sector may have different impacts on various aspects, see table 3. For example, the industrial sector was the major contributor of both health impact of outdoor air pollution and crop production loss. The residential and commercial sector was the second contributor to the health impact of outdoor air pollution, but this sector became the fourth contributor of crop production loss. These pinpoint varying characteristics of emissions from various sectors, implying the importance of evaluating cobenefits when formulating emission control policies.
Table 3. The summary of various types of impact due to sectoral emissions in China in 2010 and the relative contributions (RC) (%) of each sector to various impacts. The results were rounded up to the nearest integer. The values in the parenthesis are the 2.5th and 97.5th percentiles.

Figure 3. PM2.5-attributable mortalities caused by sectoral emissions in China in 2010. Sub-figure A shows the spatial distribution of PM2.5-attributable mortalities. Sub-figure B indicates the dominant sector of PM2.5-attributable mortalities in China. Bar chart summarizes the PM2.5-attributable mortalities caused by sectoral emissions in different provinces in China.
Download figure:
Standard image High-resolution image
Figure 4. O3-attributable mortalities caused by sectoral emissions in China in 2010. Sub-figure A shows the spatial distribution of O3-attributable mortalities. Sub-figure B indicates the dominant sector of O3-attributable mortalities in China. Bar chart summarizes the O3-attributable mortalities caused by sectoral emissions in different provinces in China. Negative values indicate a reduction in air pollution-attributable premature mortality due to the corresponding sectoral emissions. Red dots denote to the net premature mortalities due to all sectoral emissions.
Download figure:
Standard image High-resolution image
Figure 5. (a) Spatial distribution of O3-induced total crop production loss per kilometer square (tonne km−2) and (b) the dominant contributing emission sectors and crop types (maize, rice, wheat, and soybeans) in China in 2010. The major damaged crop types were shown by various patterns.
Download figure:
Standard image High-resolution image
Acknowledgment
This work is jointly funded by the Improvement on Competitiveness in Hiring New Faculties Fund (2013/14) of The Chinese University of Hong Kong; The Vice-Chancellor's Discretionary Fund of The Chinese University of Hong Kong (grant no. 4930744) and the Early Career Scheme of Research Grants Council of Hong Kong (grant no. ECS-24301415). We would like to thank the Hong Kong Environmental Protection Department and the Hong Kong Observatory for providing air quality and meteorological data, respectively. We acknowledge the support of the CUHK Central High Performance Computing Cluster, on which computation in this work have been performed.