

Abstract
In this study, the interhemispheric sea surface temperature (SST) signature of the Atlantic Multidecadal Oscillation (AMO) is analyzed and compared between observations and slab ocean model (SOM) simulations. Observational analysis suggests a robust interhemispheric SST dipole across the Atlantic associated with the AMO, manifested by a strong inverse relationship between the AMO and subpolar South Atlantic decadal SST anomalies. None of the SOMs analyzed could reproduce the observed interhemispheric dipole of the AMO; instead, they consistently simulate an interhemispheric coherent SST pattern. In the SOMs, the North Atlantic decadal SST anomalies synchronize the variations of South Atlantic SST through a cross-hemispheric atmosphere teleconnection and thermodynamic processes. This discrepancy between the SOM simulations and the observation is possibly due to deficiencies in representing ocean dynamical processes. Further analyses of the fully coupled versions of the SOMs suggest that the observed interhemispheric dipole of the AMO can be reproduced only by including ocean dynamics related to the Atlantic meridional overturning circulation. Our findings highlight that the ocean dynamics play a non-negligible role and should be taken into consideration in better understanding the observed feature of the AMO.
Export citation and abstract BibTeX RIS

Original content from this work may be used under the terms of the Creative Commons Attribution 3.0 licence.
Any further distribution of this work must maintain attribution to the author(s) and the title of the work, journal citation and DOI.
1. Introduction
The twentieth century global climate change is significantly influenced by both anthropogenic forcing and multidecadal modes of natural internal climate variability (Li et al 2013, Chen and Tung 2014, Dai et al 2015). One of the most important modes of decadal climate variability is the Atlantic Multidecadal Oscillation (AMO), which occurs mainly over the Atlantic. The AMO is characterized by a spatially coherent pattern of sea surface temperature (SST) anomalies across the North Atlantic basin (Enfield et al 2001, Sun et al 2018) and shows a quasi-periodic fluctuation between warm and cold phases with a period of 50–80 years (Schlesinger and Ramankutty 1994, Sun et al 2015a). The AMO has received extensive attention from the climate research community because it is often regarded as an important source of decadal climate predictability (Latif et al 2006a, Keenlyside et al 2008, Latif and Keenlyside 2011). The persistent basin-wide SST anomalies associated with the AMO have profound impacts on the surface climate not only over the surrounding continents (Sutton and Hodson 2005, Knight et al 2006, O'Reilly et al 2017), but also extending to the remote regions, such as Siberia and East Asia (Li and Bates 2007, Lu et al 2006, Sun et al 2015b, Sun et al 2017a).
The AMO is most pronounced over the North Atlantic, and thus an AMO index can be simply defined as the basin-wide average of Atlantic SST anomalies north of the equator (Enfield et al 2001). Even though, there is substantial evidence that the SST variations over other basins are closely tied to the AMO, leading to SST signatures of the AMO outside North Atlantic. A strong trans-basin SST teleconnection from North Atlantic to Pacific arises at multidecadal time scales (Zhang and Delworth 2007, Kucharski et al 2015, Sun et al 2017b), and observational and modeling studies have suggested a multidecadal SST dipole between the North and South Atlantic (Latif et al 2004, Latif et al 2006b, Keenlyside et al 2008, Thompson et al 2010, Sun et al 2013, Sun et al 2015c, Lopez et al 2016). This interhemispheric SST dipole indicates an inverse correlation between the AMO and South Atlantic SST, which can be physically explained by the ocean heat redistribution caused by changes in the Atlantic meridional overturning circulation (AMOC), and several studies have adopted the dipole as a proxy for AMOC variations (Latif et al 2006a, 2006b, Kamykowski 2010, Rahmstorf et al 2015). Meanwhile, the variations of AMOC and associated changes in northward ocean heat transport have been widely recognized as one of the most important driving mechanisms of the AMO (Delworth and Mann 2000, Knight et al 2005, Ba et al 2014, McCarthy et al 2015), which is referred to as ocean dynamics mechanism (Zhang 2017).
An atmosphere-forced thermodynamics mechanism has recently been proposed by Clement et al (2015, 2016) to explain the origin of the AMO. They found that the AMO can be reproduced in mixed-layer thermodynamic ocean-coupled climate models (hereafter referred to as slab ocean models) with exclusion of the role of ocean circulation, and their findings suggest that the ocean dynamics are not necessary for generating the AMO. This hypothesis is apparently contradictory with the ocean dynamics mechanism. Several follow-up studies have identified some key features associated with the AMO (e.g. high coherence at low frequency among North Atlantic SST, sea surface salinity, upper ocean heat/salt content and ocean-driven surface turbulent heat fluxes) to distinguish between the two mechanisms and provided evidence that the ocean dynamics mechanism still plays the dominant role (Zhang et al 2016, O'Reilly et al 2016, Zhang 2017, Delworth et al 2017, Drews and Greatbatch 2016, Sun et al 2018). Nevertheless, it should be noted that these previous studies only focused on the features of the AMO confined over the North Atlantic basin. The interhemispheric signature of the AMO and its role in distinguishing the driving mechanism have not been analyzed yet. It is still unknown whether the interhemispheric SST dipole associated with the AMO can be used as a key indicator to identify the AMO mechanism, and this is clearly important for better understanding the relative roles of atmospheric versus oceanic forcing in the interhemispheric SST anomalies of the AMO. This study aims to address this issue through a combined analysis of long-term observations and simulations from both slab ocean models and fully coupled models.
2. Data and methodology
We used slab ocean model (SOM) simulation data obtained from the CMIP3 archive, and only the six models with at least a 60 year length simulation are analyzed. This secures a long enough sample size for the analysis of multidecadal variability and to provide a relevant comparison with the observations in terms of the statistical significance of correlations (Sun et al 2018). The six SOMs (simulation length in years) analyzed includes: MPIM-ECHAM5 (100), GFDL-CM2.1 (100), NASA-GISS-ER (120), INM-CM3 (60), MRI-CGCM2-3-2 (150) and UKMO-HADGEM1 (70). The pre-industrial control simulations from the fully coupled versions of the models are also obtained from the CMIP3 archive, and only the models providing AMOC streamfunction (four out of the six: GFDL-CM2.1, NASA-GISS-ER, INM-CM3, MRI-CGCM2-3-2) are used in order to investigate the role of AMOC-related ocean dynamics. The final 130 years of each of the fully coupled model simulations are analyzed. Description of these models and experimental designs are available from the CMIP website (www-pcmdi.llnl.gov/ipcc/about_ipcc.php). Monthly mean fields from the model output are interpolated to the T42 grid, and the annual cycle are removed before calculating the January to December averaged annual mean anomalies. In both observations and model simulations, the AMO index is defined as the area-weighted average of SST anomalies over the North Atlantic (north of the equator, between 0°–60°N and 80°W–0°).
Three different observational data sets of global SST are employed including the COBE SST (Hirahara et al 2014), the Hadley Centre SST (HadSST3, Kennedy et al 2011) and the extended reconstruction SST version 3 (ERSST v3b, Smith et al 2008). Results from all three SST data sets are similar, so we show the results based on the ERSST data unless specified otherwise. The Twentieth Century Reanalysis version 2 (20CR2) was also used to analyze the sea surface heat flux in the present study, and all fluxes are defined positive downward. Because uncertainties in surface observations prior to 1900 are relatively large and the data before 1900 are deemed less reliable, we confine our analysis to the post-1900 period for the datasets (1900−2015). We remove the long-term linear trend in the variables using the least squares method, and our intent is to remove the centennial scale trends to better isolate and highlight the signal of decadal to multidecadal variability.
Due to the absence of long-term and continuous direct observations of historical AMOC variability, this study employs a previously identified indicator of AMOC as a proxy for the variations of AMOC and the associated ocean heat transport. Previous studies have provided compelling evidence that the Atlantic Ocean integrates the atmospheric variability of North Atlantic Oscillation (NAO) and causes changes in the AMOC and associated ocean heat transport in response to the accumulated effect of the NAO forcing (Li et al 2013, Sun et al 2015b, Delworth et al 2016, 2017, McCarthy et al 2015). Therefore, a time-integrated NAO index, which describes the accumulated effect of NAO forcing on the Atlantic Ocean circulation, can represent the multidecadal fluctuations in the strength of the AMOC (Mecking et al 2013, 2015, McCarthy et al 2015, Gulev and Latif 2015, Sun et al 2018). In this study, similar to Sun et al (2018), we calculated the time-integrated NAO index (∫t0tNAO(t)dt, where t0 corresponds to the starting year and t represents the years afterward) to construct the observational proxy index of AMOC variation during the twentieth century, and this is referred to as AMOCNAO hereafter. The observed NAO index is provided by the Climate Analysis section of NCAR (Hurrell 1995).
The data are low-pass filtered by applying an 11 year running mean in the analyses to focus on the multidecadal variability. The statistical significance of the linear regression coefficient and correlation between two auto-correlated time series is accessed via a two-tailed student's t-test using the effective number of degrees of freedom (Li et al 2013). The effective number of degrees of freedom Neff is given by the following approximation:
where N is the sample size and ρXX (j) and ρYY (j) are the autocorrelations of two sampled time series X and Y at time lag j.
3. Results
Although the concept of Atlantic interhemispheric SST dipole has already been proposed in the literature (Latif et al 2004, Latif et al 2006b, Keenlyside et al 2008, Sun et al 2013, Sun et al 2015c, Muir and Fedorov 2014), the detailed structure of the dipole and its association with the AMO have not been fully analyzed and compared across different observational SST data sets. Figures 1(a)−(c) show the observed correlation map between the AMO and decadal SST anomalies over the whole Atlantic, which is characterized by a clear interhemispheric dipole structure with strong positive correlations over North Atlantic and negative correlations over South Atlantic. The results from the three different SST observational data sets are highly consistent with each other. The observed SST signature of the AMO exhibits a significantly high degree of spatial coherence across the North Atlantic basin (Sun et al 2018), while for the South Atlantic counterpart, the AMO SST signature is most pronounced over the subpolar region (45°−65°S, 70°W−10°E). The cross correlation between the observed decadal SST anomalies averaged over the subpolar South Atlantic (SSA) and AMO is further analyzed (figure 2(a)). There is a clear out-of-phase relationship between decadal AMO and SSA SST anomalies in all SST products. The inverse correlation is statistically significant across all the three data sets and can reach up to −0.8 for the ERSST data set, and for the COBE SST data set the correlation is not only simultaneous but is also significant and larger when the AMO leads by up to several years. The observational analysis suggests that the SST signature of the AMO is not only confined over the North Atlantic basin, but also extends to South Atlantic, showing an interhemispheric SST dipole with opposite decadal variations between North Atlantic and SSA. Thus, we identify the interhemispheric dipole as a key feature associated with the observed AMO, and this is robust across different SST products.
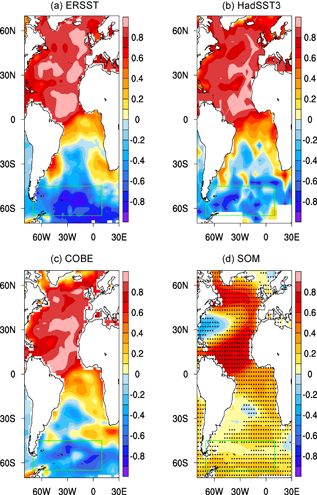
Figure 1. (a) Correlation map between decadally filtered AMO index and SST anomalies over the whole Atlantic basin for the period 1900−2015 based on the ERSST data set. (b) and (c) As in (a), but based on the HadSST3 and COBE SST data sets, respectively. (d) Multi-model ensemble mean correlation of decadally filtered AMOs with Atlantic SST anomalies based on the six SOM simulations (see Data and Methodology). Dots in (d) denote the area where at least four of the six models agree on the sign of the correlations.
Download figure:
Standard image High-resolution image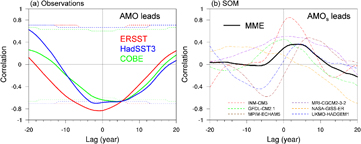
Figure 2. (a) Lead-lag correlations between the decadally filtered AMO and SSA regionally averaged SST in the three observational SST data sets. Dashed lines denote the 95% confidence levels for the correlations using the effective numbers of degrees of freedom. (b) Lead-lag correlations between the decadally filtered AMOs and SSA regionally averaged SST in the six SOM simulations (dashed lines in colors) and the multi-model ensemble mean (black solid line). In (a) and (b), negative (positive) lags indicate that the SSA SST is leading (lagging).
Download figure:
Standard image High-resolution image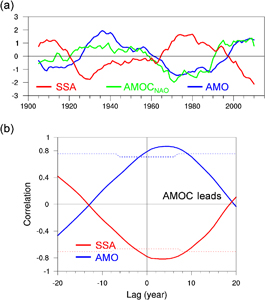
Figure 3. (a) Time series of the AMOCNAO (green), decadally filtered AMO (blue) and SSA SST (red) indices for the period 1900−2015. The definitions of the three indices are given in the text. All indices are scaled to unit variance and the long-term linear trends are removed. (b) Cross correlations of the AMO (blue) and SSA SST (red) indices with the AMOCNAO index at decadal time scales. Positive (negative) lags indicate that the AMOC is leading (lagging). Dotted lines denote the 95% confidence level.
Download figure:
Standard image High-resolution imageThe Atlantic SST signature of the AMO simulated by the SOMs is further analyzed and compared with the observations (figure 1(d)). The AMO in the SOMs is referred to as AMOs to distinguish the observed AMO. There is a clear discrepancy in the spatial structure between the observed AMO and AMOs over the North Atlantic basin, and the high degree of spatial coherence is missing in the SOM simulations. This discrepancy has been revealed and analyzed by Sun et al (2018), and here we focus more on the interhemispheric signature of the AMO. There exists a remarkable discrepancy in the interhemispheric SST variability associated with AMO between the SOMs and observations, and the SOMs fail to reproduce the observed interhemispheric dipole pattern of the AMO. Oppositely, most of the SOMs simulate unrealistically positive correlations between the AMOs and South Atlantic decadal SST anomalies, and over the key SSA region the positive correlation is also evident, suggesting an interhemispheric coherence of Atlantic SST variations associated with the AMOs. The cross correlation of AMOs with the SSA decadal SST anomalies in the SOMs is also analyzed (figure 2(b)). None of the six SOMs reproduce the observed inverse relationship between the AMO and SSA SST, and four SOMs simulate a simultaneous positive correlation. Although the other two SOMs (MPIM-ECHAM5 and UKMO-HADGEM1) simulate a rather weak zero-lag correlation between AMOs and SSA SST, a considerably strong positive correlation is also found in the two SOMs when the AMOs leads SSA SST by several years. The multi-model ensemble (MME) mean of the cross correlations indicates that the covariability between the AMOs and SSA SST in the SOMs is not only synchronous but is also strong and larger when the AMO leads by up to several years. Therefore, the SOMs cannot reproduce the observed interhemispheric SST dipole of the AMO but simulate an unrealistic interhemispheric synchronization of Atlantic decadal SST variations across the models.
The physical mechanism for the interhemispheric SST dipole associated with AMO can be explained by using the observational AMOC proxy (i.e. AMOCNAO). Figure 3 shows the time series of the AMOCNAO, AMO and SSA SST indices since the beginning of the twentieth century, and the lead-lag correlations among them are also analyzed, which indicate that the AMOC precedes the AMO and SSA SST indices by several years. The lagged correlations of SST anomalies with the AMOC are strong and significant in both hemispheres but clearly opposite in sign between North and South Atlantic. This suggests that the strengthening (weakening) of AMOC may lead to SST warming (cooling) in the North Atlantic and cooling (warming) in the South Atlantic. Previous studies suggested that the contrasting impacts of AMOC on the two hemispheres are related to the bipolar seesaw in temperature anomalies. Many indirect proxy records have revealed that there is an out of phase relationship between the temperature in the North Atlantic and subpolar Southern Hemisphere (Crowley 1992, Broecker 1998, Barker et al 2009). Modeling studies provides a plausible physical mechanism for the bipolar seesaw that changes in the strength of the AMOC may lead to anomalous oceanic heat transport converging towards one hemisphere and thus give rise to opposite temperature tendencies between the two hemispheres (Vellinga and Wood 2002, Stouffer et al 2007, Delworth and Zeng 2012). We further use observational data to verify this mechanism by investigating the role of AMOC in driving the SST tendencies over the Atlantic basin. Figure S1 in the supplementary information available at stacks.iop.org/ERL/13/074026/mmedia shows the regression of observed tendency of decadal SST anomalies on the AMOCNAO index, which is clearly characterized by an interhemispheric seesaw pattern of SST tendencies, most pronounced over the subpolar regions. Therefore, this is consistent with the previous findings and provides further observational evidence that the ocean heat transport convergence associated with the AMOC may be a leading cause of the interhemispheric SST dipole of the AMO.
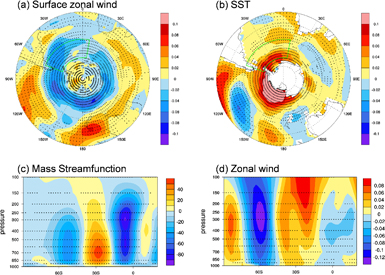
Figure 4. Multi-model ensemble mean regressions of Southern Hemispheric (a) surface zonal wind (m s−1), (b) SST (K), (c) zonally-averaged mass streamfunction (108 kg s−1) and (d) zonally-averaged zonal wind (m s−1) onto the normalized AMOs index at decadal timescales based on the six slab ocean model simulations. Dots in (a)−(d) denote the area where at least four of the six models agree on the sign of the regressions.
Download figure:
Standard image High-resolution imageBesides the role of AMOC, we also analyzed observational surface heat fluxes to investigate whether the thermodynamic process plays a role in the interhemispheric SST dipole. Figures S2(a)−(b) in the supplementary information show the regressions of net surface heat flux (turbulent plus radiative fluxes, and positive sign denotes downward heat flux into the ocean) on the AMO and SSA SST indices over North and South Atlantic, respectively. The regression pattern over the North Atlantic is dominated by negative values, particularly for the subpolar region. The heat flux regression over the SSA region is also characterized by negative flux anomalies, similar to its North Atlantic counterpart. Since the 20CR2 data set is less reliable during the first half of the twentieth century, we repeated the regression analysis for the post-1950 period, and the results appear independent of the analysis period (figures S2(c)−(d) in supplementary information). Moreover, we find that the turbulent fluxes contribute more to the negative heat flux anomalies than the radiative components (figures S3−4 in supplementary information). The negative regression between net surface heat flux and SST anomalies at low frequencies indicates that the heat flux acts to damp the decadal SST anomalies for both North Atlantic and SSA regions, and hence that the observed interhemispheric SST dipole of AMO is unlikely induced by the surface heat flux anomalies. This is consistent with previous findings that thermodynamic process plays a damping (rather than forcing) role in the multidecadal SST variations over the subpolar North Atlantic (Gulev et al 2013, O'Reilly et al 2016, Zhang et al 2016, 2017) and in turn implies that the interhemispheric dipole may be induced by the ocean dynamical process (i.e. the AMOC-related process revealed in the above analysis). Therefore, these evidences suggest that the SOM may have considerable deficiencies in simulating the interhemispheric SST dipole. The ocean circulation variability is clearly not present in the SOM simulations. Meanwhile, the SOM simulated SST variation is obviously a passive response to the thermodynamic forcing by net surface heat flux (O'Reilly et al 2016, Zhang et al 2016), and thus the SOM shows an intrinsic deficiency in representing the observed damping effect of heat flux on the multidecadal SST variations over North Atlantic and SSA regions.
The physical mechanism for the SOM simulated interhemispheric coherent SST variation associated with the AMOs is further investigated. In SOMs, the SST variation is driven only by the thermodynamic processes. The surface wind plays a crucial role in the surface energy exchange between ocean and atmosphere through the wind-evaporation-SST (WES) effect (Xie and Philander 1994). Figure 4(a) displays the Southern Hemisphere (SH) surface zonal wind anomalies associated with the AMOs in the SOMs. The surface zonal wind shows clear easterly anomalies over the key SSA region during the warm AMOs phase, and these anomalies are not only confined to the SSA region but exhibit a zonally symmetric pattern over the whole subpolar SH. The easterly anomalies weaken the wind speed of climatological subpolar westerlies, and through the WES effect, the SST over the subpolar Southern Ocean should become warmer-than-normal in response to the wind speed reduction. As expected, the SH decadal SST anomalies associated with the AMOs show a zonally uniform warming over the entire subpolar Southern Ocean (figure 4(b)), which is in good agreement with the pattern of surface zonal wind anomalies and consistent with the role of the WES mechanism in linking wind and SST anomalies. Thus, the simulated interhemispheric coherent SST variations associated with the AMOs can be understood via the atmospheric bridge mechanism, and the SH subpolar wind plays a key role in bridging teleconnection from AMOs to the SSA SST.
How can the AMOs influence the zonal wind over the subpolar SH? There has been some modeling evidence that North Atlantic SST anomalies can have a significant remote influence on the SH atmospheric circulation through a cross-hemispheric atmosphere teleconnection (Lee et al 2011, Chiang and Friedman 2012, Chiang et al 2014, Ceppi et al 2013). The North Atlantic SST warming (cooling) can induce a northward (southward) shift of the ITCZ and a strengthening (weakening) of the SH Hadley circulation. The strengthened (weakened) SH Hadley circulation increases (reduces) the angular momentum transport from the tropics to the subtropics, accelerating (decelerating) the SH subtropical jet, and the changes in the subtropical jet in turn, alter the propagation of extratropical waves, affecting eddy momentum fluxes and subsequently the eddy-driven subpolar westerlies, which corresponds to a dynamical inverse relationship between the strength of subtropical jet and eddy-driven subpolar westerlies (Lee and Kim 2003). This cross-hemispheric atmosphere teleconnection mechanism is further examined in this study by using the SOM simulations. Figure 4(c) and d show the decadal anomalies of zonally-averaged meridional circulation and zonal wind associated with the AMOs. During the warm AMOs phase, the tropical meridional circulation anomalies indicate an enhanced SH Hadley circulation, and its ascending branch moves slightly to the north of the equator, corresponding to a northward shift of the ITCZ (figure 4(c)). The enhanced SH Hadley circulation leads to a strengthening of SH subtropical jet through the angular momentum transport, and oppositely, the SH subpolar westerly is shown to weaken in response to the subtropical change (figure 4(d)), consistent with the dynamical inverse relationship between subtropical and subpolar SH westerlies (Lee and Kim 2003). Moreover, the SH zonal wind anomalies show an equivalent barotropic structure extending from the upper troposphere down to the surface (figures 4(a) and (d)). Therefore, the cross-hemispheric atmosphere teleconnection mechanism proposed in previous modeling studies is reproduced in the SOM simulations, and it explains the atmospheric bridge for the remote influence of AMOs on the SH subpolar westerlies through changes in the tropical Hadley circulation and subtropical jet stream.
The above analysis suggests an atmospheric bridge mechanism, which explains the interhemispheric coherent SST variations associated with the AMOs in the SOM simulations. Although this mechanism is physically reasonable, it clearly cannot explain the observed interhemispheric dipole of the AMO. An obvious deficiency in the SOM simulations is that the SOMs exclude ocean dynamics and only include thermodynamic processes at the ocean-atmosphere interface. Thus, a reasonable hypothesis is that the ocean dynamics may play the fundamental role in generating the interhemispheric dipole of the AMO. To further verify this hypothesis, we performed similar analyses but using the simulations from the fully coupled models. These simulations are the pre-industrial control integrations of the fully coupled version of the SOMs (see Data and Methodology). The two versions of each model (SOM and fully coupled model) share the same atmosphere component and only differ in the inclusion of ocean circulation, and thus a comparison between them may highlight the role for ocean dynamics. Figure 5 shows the correlation map between the AMO and Atlantic decadal SST anomalies in the fully coupled models. In contrast to the results from the SOM simulations, the fully coupled models simulate a qualitatively similar interhemispheric seesaw pattern to that observed (figure 5(a)). Nevertheless, the simulated inverse relationship between the AMO and South Atlantic decadal SST anomalies is much weaker than the observed one. Thus, we further examined the SST correlation map of the AMO in each model (not shown here), and the fully coupled models are divided into two classes depending on the strength of the interhemispheric SST relationship associated with the AMO. We define Class-I models as those with a strong inverse correlation between the AMO and South Atlantic decadal SST anomalies, and two out of the four models fall into the Class-I models (INM-CM3 and GFDL-CM2.1). The other two models fall into the Class-II models (MRI-CGCM-2-3-2 and NASA-GISS-ER), in which the interhemispheric SST correlation is much weaker. Figure 5(b) shows the results based on the simulations from Class-I models. The observed interhemispheric dipole pattern associated with the AMO is reasonably reproduced, and the simulated interhemispheric SST correlation of the AMO is comparable to that observed and becomes more realistic.

Figure 5. (a) Multi-model ensemble mean correlation of decadally filtered AMO with SST anomalies over the whole Atlantic based on the four fully coupled model simulations (see Data and Methodology). Dots in (a) denote the area where at least two of the four models agree on the sign of the correlations. (b) As in (a), but for the Class-I fully coupled models (see text for the definition of the Class-I models).
Download figure:
Standard image High-resolution imageWe identified two key processes in association with the interhemispheric SST dipole of AMO by using the observational data: the damping process by the surface heat flux and the forcing process by the AMOC. Therefore, a detailed comparison between Class-I and Class-II models in terms of these two key processes is necessary to understand why the simulation ability is model dependent. Figure S5 in supplementary information shows the regressions of net surface heat flux anomalies on the AMO and SSA SST indices for the Class-I and Class-II models, respectively. The Class-I models reasonably reproduce the observed damping effect of net surface heat flux on the Atlantic multidecadal SST anomalies, consistently showing negative regressions between heat flux and SST anomalies at decadal time scales over both North and South Atlantic basins. The negative regressions are most pronounced over the subpolar basins, which are the key regions for the damping effect (Gulev et al 2013). In contrast, the Class-II models fail to reproduce the observed heat flux–SST relationship. Opposite to the observational results, the Class-II models consistently show positive regressions between decadal surface heat flux and SST anomalies over subpolar North and South Atlantic basins, indicating a forcing role of stochastic net surface heat flux on SST. Thus, the Class-I and Class-II models differ in representing the SST-heat flux relationship at low frequencies, and the unrealistic thermodynamic forcing of SST in Class-II models may also influence simulation of the dynamical effect of the ocean circulation on the Atlantic multidecadal SST variations and hence the interhemispheric SST dipole.
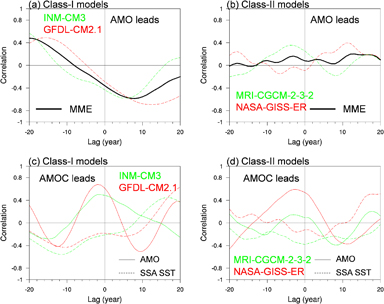
Figure 6. (a) Lead-lag correlations between the decadally filtered AMO and SSA regionally-averaged SST in the Class-I model simulations (dashed lines in colors) and the multi-model ensemble mean (black solid line). (b) As in (a), but for the results in the Class-II model simulations. In (a) and (b), negative (positive) lags indicate that the SSA SST is leading (lagging). (c) Lead-lag correlations of the simulated SSA SST (dashed line) and AMO (solid line) with the AMOC index at decadal time scales in the Class-I model simulations. (d) As in (c), but for the Class-II model simulations. In (c) and (d), negative (positive) lags indicate that the AMOC is leading (lagging).
Download figure:
Standard image High-resolution image
Further comparison between Class-I and Class-II models indicates that only a model that properly simulates the dynamical AMOC–SST relationship can reproduce the observed interhemispheric dipole of the AMO. The cross correlations between the AMO and decadal SST anomalies over the key SSA region and their relationships with the AMOC are analyzed and compared between Class-I and Class-II models. For Class-I models, the negative correlation between the AMO and SSA SST is not only simultaneous but is also strong and larger when the AMO leads by up to several years (figure 6(a)), and the AMOC has opposite forcing effects on the two-hemispheric Atlantic SSTs, showing lead positive and negative correlations with the decadal SST anomalies over the North and South Atlantic, respectively (figure 6(c)). The results from Class-I models are consistent with the observational analysis using the AMOC proxy (figure 3) and previous modeling studies that changes in the strength of the AMOC can induce warming in one hemisphere while the other cools due to the anomalous northward heat transport, forming an interhemispheric SST dipole pattern (e.g. Knight et al 2005, Latif et al 2004, Latif et al 2006b, Stouffer et al 2007, Sun et al 2013, Sun et al 2015c). The Atlantic multidecadal SST anomalies induced by the AMOC-related ocean heat transport convergence are further damped by the surface heat flux anomalies (figure S5 in supplementary information). Different from the Class-I models, there is a lack of consistency between the results from the two Class-II models, and the simulated interhemispheric SST relationship associated with the AMO is rather weak and unrealistic (figure 6(b)). Moreover, the simulated AMOC–SST relationships do not indicate a clear effect of AMOC on the Atlantic decadal SST variations. Although the NASA-GISS-ER simulate a high positive correlation between AMOC and AMO, the correlation between AMOC and SSA SST is very low and close to zero; the simulated AMOC-SST relationship in MRI-CGCM-2-3-2 is weak for both hemispheres (figure 6(d)). Thus, in Class-II models, the effect of AMOC on Atlantic SST variations is negligible either in one hemisphere or in both hemispheres, possibly due to the fact that in Class-II models the thermodynamic process by the stochastic surface heat flux plays the driving role in the Atlantic multidecadal SST anomalies (figure S5 in supplementary information). The forcing effect of interhemispheric Atlantic SST seesaw by the AMOC-related ocean dynamics is well simulated in Class-I models but is missing in Class-II models. This not only explains why there is a sharp contrast in the simulation of the AMO interhemispheric signature between Class-I and Class-II models, but also indicates that the AMOC-related ocean dynamics mechanism is crucial for the formation of interhemispheric SST dipole associated with the AMO.
4. Conclusion and discussion
In this study, the interhemispheric SST signature of the AMO is analyzed and compared between observations and SOM simulations. Observational analysis suggests a robust interhemispheric SST dipole across the Atlantic associated with the AMO, manifested by a strong inverse relationship between the AMO and SSA decadal SST anomalies. None of the SOMs analyzed could reproduce the observed interhemispheric signature of the AMO, instead, they consistently simulate an interhemispheric coherent SST pattern, opposite to the observations. This unrealistic SST pattern found in the SOMs can be explained by the atmospheric bridge mechanism; that is, the North Atlantic SST anomalies can induce a cross-hemispheric atmosphere teleconnection, leading to changes in SH subpolar westerlies, and these changes in turn affect the SST beneath through thermodynamic processes. Further analyses of the fully coupled versions of the SOMs suggest that the observed interhemispheric dipole of the AMO can be reproduced only by including the AMOC-related ocean dynamics. Our findings highlight that the ocean dynamics play a non-negligible role and should be taken into consideration in better understanding the observed feature of the AMO.
This study provides observational and modeling evidence to identify the interhemispheric SST dipole of AMO as a key feature that can be used to distinguish the AMO driving mechanism. To highlight the role of ocean dynamics, we employed the CMIP3 coupled models that share the same atmospheric model but have different ocean models with or without the presence of a dynamical ocean. Compared to the CMIP3 models, CMIP5 fully coupled models show notable changes in terms of higher spatial resolutions and better physics representation, and thus we further performed a preliminary analysis using the preindustrial control simulations from the CMIP5 fully coupled models. We found that, consistent with the CMIP3 fully coupled models, the analyzed CMIP5 models have the ability to simulate the interhemispheric SST dipole associated with the AMO variability (figure S6 in supplementary information), further confirming that the presence of a dynamical ocean in couple models is necessary. A more systematic evaluation of the CMIP5 models and comparison with the CMIP3 models warrant future study.
Based on model simulations, this study shows that the AMOC-related ocean dynamics may play an important role in shaping the observed interhemispheric dipole structure associated with the AMO. A limitation of this study is that only two of the CMIP3 fully coupled models analyzed can reproduce the dipole and simulate a reasonable correlation between the AMOC and the dipole. A recent study based on current CMIP5 fully coupled models has also suggested that there is modest, but model-dependent, skill in simulating the relationship (Muir and Fedorov 2014). Thus, a systematic comparison between the CMIP3 and CMIP5 fully coupled models are necessary to examine whether there is some improvement in the simulation of the relationship between AMOC and Atlantic interhemispheric dipole from CMIP3 to CMIP5 models. This is also helpful for identifying the key process that influences the simulation of AMOC-SST relation. In addition, we emphasize that the ocean dynamics induced interhemispheric climate variations proposed in this study are not at the exclusion of the climate impacts resulting from the atmospheric teleconnection mechanism. Our view is that both may be operating in the real world, but at different time scales. Some recent studies have suggested that at interannual time scales, the climate variations over Southern Ocean are tightly connected to the SST anomalies over the tropical North Atlantic (Li et al 2014, 2015a, 2015b), and this teleconnection can be well explained by the atmospheric bridge mechanism. Our hypothesis of the role of ocean dynamics only applies at decadal to multidecadal time scales. Future studies will be needed to incorporate both the atmospheric and ocean-mediated interhemispheric teleconnections in understanding the SH climate variability over broad time scales.
Acknowledgments
This work was jointly supported by the National Science Foundation of China (41775038, 41790474), the National Programme on Global Change and Air–Sea Interaction (GASI-IPOVAI-06 and GASI-IPOVAI-03), and the State Key Laboratory of Tropical Oceanography, South China Sea Institute of Oceanology, Chinese Academy of Sciences (Project No. LTO1801).