

Abstract
Permafrost (perennially frozen) soils store vast amounts of organic carbon (C) and nitrogen (N) that are vulnerable to mobilization as dissolved organic carbon (DOC) and dissolved organic and inorganic nitrogen (DON, DIN) upon thaw. Such releases will affect the biogeochemistry of permafrost regions, yet little is known about the chemical composition and source variability of active-layer (seasonally frozen) and permafrost soil DOC, DON and DIN. We quantified DOC, total dissolved N (TDN), DON, and DIN leachate yields from deep active-layer and near-surface boreal Holocene permafrost soils in interior Alaska varying in soil C and N content and radiocarbon age to determine potential release upon thaw. Soil cores were collected at three sites distributed across the Alaska boreal region in late winter, cut in 15 cm thick sections, and deep active-layer and shallow permafrost sections were thawed and leached. Leachates were analyzed for DOC, TDN, nitrate (NO3−), and ammonium (NH4+) concentrations, dissolved organic matter optical properties, and DOC biodegradability. Soils were analyzed for C, N, and radiocarbon (14C) content. Soil DOC, TDN, DON, and DIN yields increased linearly with soil C and N content, and decreased with increasing radiocarbon age. These relationships were significantly different for active-layer and permafrost soils such that for a given soil C or N content, or radiocarbon age, permafrost soils released more DOC and TDN (mostly as DON) per gram soil than active-layer soils. Permafrost soil DOC biodegradability was significantly correlated with soil Δ14C and DOM optical properties. Our results demonstrate that near-surface Holocene permafrost soils preserve greater relative potential DOC and TDN yields than overlying seasonally frozen soils that are exposed to annual leaching and decomposition. While many factors control the fate of DOC and TDN, the greater relative yields from newly thawed Holocene permafrost soils will have the largest potential impact in areas dominated by organic-rich soils.
Export citation and abstract BibTeX RIS

Original content from this work may be used under the terms of the Creative Commons Attribution 3.0 licence.
Any further distribution of this work must maintain attribution to the author(s) and the title of the work, journal citation and DOI.
1. Introduction
The vulnerability of permafrost soil carbon (C) and nitrogen (N) to biogeochemical processing upon thaw is a focus of intense research due to their enormous stocks and heterogeneous characteristics across landscapes, and the implications for ecosystem function and climate (Grosse et al 2011, Harden et al 2012, Jorgenson et al 2013). Considerable emphasis has been on the production and emission of greenhouse gases carbon dioxide (CO2) and methane (CH4) to the atmosphere (Schuur et al 2015). A less-studied vector of mobilization is the release of solutes from thawing soils into the environment (Vonk and Gustaffson 2013). Dissolved organic carbon (DOC) and total dissolved nitrogen (TDN; as dissolved organic and inorganic N; DON, DIN) broadly influence terrestrial and aquatic ecosystem function and greenhouse gas emissions as they are biogeochemically cycled within soils (van Hees et al 2005, Weintraub and Schimel 2005), transported laterally to aquatic systems, and processed (Aufdenkampe et al 2011) and/or exported to coastal environments (Holmes et al 2011). Mineralization of DOC in soils and surface waters produces CO2 and CH4 that are emitted to the atmosphere (Chasar et al 2000, Bengtson and Bengtsson 2007, Drake et al 2015), and DON and DIN are essential nutrients that enhance primary production (Keuper et al 2012, 2017) and decomposition (Mack et al 2004, Wickland et al 2012). Given the importance of DOC, DON and DIN to terrestrial and aquatic ecosystem function and gaseous and lateral fluxes, it is critical to quantify sources that become newly available as permafrost thaws.
Approximately 45% of circumpolar permafrost-affected soils are currently modeled as having near-surface (<1 m depth) permafrost and this is projected to decline to 5%–25% by 2100 due to climate-induced permafrost thaw (Harden et al 2012). Near-surface permafrost soils store substantial C and N stocks (Harden et al 2012, Hugelius et al 2014) that are vulnerable to soluble C and N release upon thaw. Circumpolar studies document differences in DOC and dissolved N concentrations, solute chemical properties, and DOC biodegradability of surface waters draining areas having deep active layers or thermokarst features when compared to areas having shallow stable permafrost (Abbott et al 2014, 2015, Harms et al 2013, Spencer et al 2015, Wauthy et al 2018). Changing terrestrial sources with thaw are commonly invoked as the cause. However, systematic comparative examination of potential DOC and TDN release, dissolved organic matter (DOM) properties, and biodegradability of DOC from permafrost and active-layer soils across a wide range of soil types is needed to more definitively understand how observed patterns in surface water chemistry are related to changing terrestrial sources. Studies of soil leachates in circumpolar regions have focused primarily on potential DOC release from active-layer soils (Neff and Hooper 2002, Michaelson and Ping 2003, Guo et al 2007, Vonk et al 2015, O'Donnell et al 2016) and from deep Pleistocene yedoma soils (Dutta et al 2006, Drake et al 2015, Ewing et al 2015). Only a small number of studies have compared solute leachate chemistry and/or biodegradability from paired active-layer and shallow permafrost soils (Ward and Cory 2015, Reyes and Lougheed 2015, Selvam et al 2017) and those studies are limited to soils collected from a single location.
Here we assess potential DOC, DON and DIN release upon thaw from Alaska boreal active-layer and near-surface permafrost soils spanning a wide range of soil C and N content, age, and spatial distribution to advance understanding of permafrost soils as sources of dissolved C and N upon thaw. We address three questions: (1) How much DOC and TDN (DON plus DIN) is released upon initial thaw of near-surface Holocene permafrost soils, and how does that compare with deep active-layer soils?; (2) What is the chemical character of released DOM?; and (3) What is the biodegradability of released DOC? We put bounds on DOC and TDN yields from diverse permafrost and active-layer soils and assessed DOM chemistry and DOC biodegradability. We targeted specific depths within the upper 1 m soil profile to include deep active-layer soils that thaw in mid- to late- summer and near-surface permafrost soils that will thaw with active-layer deepening and/or thermokarst formation.
2. Methods
Soils were collected from three sites in interior Alaska (table 1, figure 1). The most northern site, Coldfoot (67.20°N, 150.27°W), is an upland forested site in the continuous permafrost zone. Soils are organic and mineral in the active layer (organic layer thickness = ~30–35 cm), transitioning to permafrost mineral soils. The Hess Creek site (65.67°N, 149.08°W) is located just south of the Yukon River in discontinuous permafrost and is a deep peatland (>3 m peat) having organic active-layer and permafrost soils. The Smith Lake site (64.87°N, 147.86°W) is a forested area in Fairbanks, AK, and contains organic and mineral soils in active-layer and permafrost horizons (organic layer thickness = ~34–45 cm, with spatially variable deeper organic layers). Following USDA Soil Taxonomy (Soil Survey Staff 1999), all soils are Gelisols (permafrost within 1 m of the surface); soils from Coldfoot are Orthels (non-cryoturbated mineral soil suborder), soils from Hess Creek are Histels (organic soils suborder), and soils from Smith Lake are Turbels (cryoturbated soils suborder). We refer to the sites as CF (Coldfoot), HC (Hess Creek), and SL (Smith Lake).
Table 1. Soil properties.
| Site name | Core | Sample depth (cm) | Soil horizona | Thermal horizon | Active layer depth (cm) | Bulk density (g cm−3) | Soil % C | Soil % N | Bulk soil Δ 14C (‰) | Radiocarbon age (ybp) |
|---|---|---|---|---|---|---|---|---|---|---|
| Coldfoot | C-1 | 35–50 | Fibric/mineral | Active Layer | 63 | 0.95 | 2.22 | 0.13 | −402.8 | 4085 |
| Coldfoot | C-2 | 35–50 | Fibric/mineral | Active Layer | 63 | 0.39 | 4.80 | 0.31 | −278.9 | 2570 |
| Coldfoot | C-3 | 35–50 | Fibric/mineral | Active Layer | 63 | 1.11 | 2.78 | 0.17 | −352.5 | 3435 |
| Coldfoot | C-1 | 65–80 | Mineral | Permafrost | 63 | 0.41 | 1.79 | 0.13 | −684.3 | 9205 |
| Coldfoot | C-2 | 66–80 | Mineral | Permafrost | 63 | 0.44 | 2.10 | 0.13 | −614.9 | 7610 |
| Coldfoot | C-3 | 67–80 | Mineral | Permafrost | 63 | 0.50 | 1.75 | 0.11 | −463.1 | 4940 |
| Hess Creek | H-1 | 35–50 | Fibric/mesic | Active Layer | 61 | 0.15 | 36.1 | 1.48 | −62.2 | 460 |
| Hess Creek | H-2 | 35–50 | Fibric/mesic | Active Layer | 61 | 0.18 | 41.4 | 1.60 | −62.9 | 465 |
| Hess Creek | H-3 | 35–50 | Fibric/mesic | Active Layer | 61 | 0.17 | 43.4 | 2.30 | −104.7 | 830 |
| Hess Creek | H-1 | 85–100 | Fibric/mesic | Permafrost | 61 | 0.10 | 34.2 | 1.47 | −149.0 | 1240 |
| Hess Creek | H-2 | 86–100 | Fibric/mesic | Permafrost | 61 | 0.16 | 40.1 | 1.80 | −164.1 | 1385 |
| Hess Creek | H-3 | 87–100 | Fibric/mesic | Permafrost | 61 | 0.10 | 42.5 | 0.94 | −145.4 | 1205 |
| Smith Lake | S-1 | 30–45 | Humic/mineral | Active Layer | 55 | 1.16 | 0.78 | 0.05 | −375.5 | 3725 |
| Smith Lake | S-2 | 35–50 | Humic/mineral | Active Layer | 55 | 0.33 | 14.1 | 0.80 | −262.5 | 2390 |
| Smith Lake | S-3 | 35–50 | Humic/mineral | Active Layer | 55 | 0.49 | 4.80 | 0.26 | −210.8 | 1845 |
| Smith Lake | S-1 | 87–102 | Mineral | Permafrost | 55 | 0.51 | 0.84 | 0.06 | −539.3 | 6170 |
| Smith Lake | S-2 | 78–90 | Mineral | Permafrost | 55 | 0.23 | 9.95 | 0.64 | −281.1 | 2595 |
| Smith Lake | S-3 | 74–89 | Mineral | Permafrost | 55 | 0.69 | 0.78 | 0.05 | −534.7 | 6090 |
aSoils are described according to methods of Soil Survey Staff (1951) and Canadian Agricultural Services Coordinating Committee (1998).

Figure 1. Sample site locations (a), and Gelisol soil organic carbon (SOC) mass to 100 cm depth across Alaska. Soil spatial data are from the Northern Circumpolar Soil Carbon Database (http://bolin.su.se/data/ncscd/shape.php; Hugelius et al 2013a, 2013b).
Download figure:
Standard image High-resolution imageSoil cores were collected in March when active-layer soils were still frozen (maximum active-layer thicknesses at each sampling site were measured the previous September; Waldrop et al 2010). Three cores were collected from 0–1 m depth at each site within a 100 m2 area using a SIPRE (Snow, Ice, and Permafrost Research Establishment) corer, and were kept frozen during transport to a −10 °C cold room at Fort Wainwright Army Base in Fairbanks, AK for processing. Soil cores were cut into segments using a band saw, and two 15 cm-thick segments were extracted from each core: a deep active-layer horizon (~15–30 cm above the permafrost boundary) and a shallow permafrost horizon (~15–30 cm below the permafrost boundary). Samples were cut lengthwise and splits were shipped on dry ice to USGS labs in Boulder, CO and Menlo Park, CA and kept frozen until analysis.
Soil sample splits were analyzed for moisture content, bulk density, C and N content, and radiocarbon content. Moisture content and bulk density were determined by drying a known volume of soil at 65 °C (organic) or 105°C (mineral) for 48 hours and measuring the weight before and after drying. C and N content were measured on a C/N analyzer (CE Elantech, Lakewood, NJ, USA). Subsamples were sent to the W.M. Keck Accelerator Mass Spectrometry Laboratory at University of California-Irvine for oxidation to CO2 and CO2 purification, graphitization, and radiocarbon measurement. Radiocarbon Δ14C (‰), and radiocarbon age as years before present (ybp) were reported.
A second set of soil sample splits were leached by placing pre-weighed frozen soils in glass beakers with 500 ml of deionized water and allowing them to thaw at 5°C in the dark for 24 hours on shaker tables. The mass ratio of field-moist soil to water (g g−1) ranged from 0.22–0.56 and averaged 0.32 (n = 18), similar to the suggested mass ratio for soil: extractant of ≥0.25 for directly comparable DOC and DON recovery from soils (Jones and Willett 2006, table S1 available at stacks.iop.org/ERL/13/065011/mmedia). Soil-water slurries were decanted and filtered using pre-combusted GF/F filters. DOC, TDN, DIN (nitrate plus ammonium), and DON (TDN minus DIN) yields normalized to total dry soil weight were calculated using solute concentrations (analytical methods described below) and accounting for soil water volume and added leachate water volume (table S1). A small volume of unfiltered water was saved as inoculum for biodegradable DOC (BDOC) incubations, described below.
Leachate samples were analyzed within 48 h for concentrations of DOC (OI700 analyzer, O.I. Analytical), TDN (Shimadzu Total Nitrogen analyzer), and nitrate (NO3−) and ammonium (NH4+) (Dionex Model DX-120 Ion Chromatograph), and for DOM optical properties. UV-visible absorbance was measured using a Hewlett-Packard Model 8453 photo-diode array spectrophotometer. Specific UV absorbance (SUVA254), an index of DOC aromaticity (Weishaar et al 2003), was determined by dividing absorbance at λ = 254 nm (UV254) by DOC concentration. Spectral slope ratio (SR), an indicator of DOM molecular weight, was calculated as the ratio of the slopes of adsorption between λ = 275–295 nm (S275−295) and λ = 350–400 nm (S350−400) (Helms et al 2008). SR increases with an increasing ratio of low molecular weight DOC to high molecular weight DOC (Helms et al 2008). Fluorescence excitation-emission matrices (EEMs) were measured using a Horiba-JY Fluoromax-3 spectrofluorometer as described in Wickland et al (2007). Fluorescence Index (FI; McKnight et al 2001), which is used to distinguish between microbially-derived (FI = 1.7–2.0) and higher plant-derived (FI < 1.4) DOM fulvic acids, was calculated as the ratio of the intensities at excitation (ex) and emission (em) wavelengths ex370/em470 and ex370/em520 (Cory et al 2010). Humification Index (HIX; Ohno 2002) was calculated as the ratio of the sum of the intensities at ex255/em434–480 divided by the sum of intensities at ex255/em300–344 and ex255/em434–480. HIX values can range from 0–1, with higher values indicating an increasing degree of humification of DOM (Ohno 2002). DOC-normalized fluorescence intensities of six fluorescence ex/em peaks associated with various DOM pools (Kraus et al 2008) were determined. These peaks include B (ex270/em310; tyrosine-like, protein-like fluorophore), T (ex260/em340; tryptophan-like, protein-like fluorophore), A (ex260/em450; humic-like), C (ex330/em446; humic-like), D (ex370/em500; soil fulvic acid), and E (ex450/em520; soil fulvic acid) peaks. We grouped peaks into 'protein-like' (B, T) and 'humic-like + fulvic-like' (A, C, D, E) and summed their intensities.
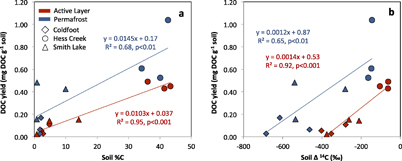
Figure 2. DOC yield (mg DOC g−1 soil dry weight) from active layer and permafrost soils as a function of (a) soil percent carbon, and (b) soil 14C (‰). Each point represents one sample. The linear regression lines and equations are for active layer and permafrost samples.
Download figure:
Standard image High-resolution imageBiodegradable DOC (BDOC) content was determined using methods described in Wickland et al (2007, 2012), where inoculated samples (1% 1.6 µm-filtered inoculant derived from the soil leachates) were incubated in serum bottles with 50% headspace by volume and dissolved inorganic carbon (DIC) production was measured over time. BDOC incubations were conducted on diluted samples (<10 mg DOC L−1) to avoid O2 limitation, and were incubated in the dark for 90 days at 5°C to mimic approximate in situ soil temperatures. The difference between initial and final total DIC concentrations was assumed to result entirely from DOC mineralization (McDowell et al 2006). Results are presented as % BDOC (Δ[DIC]/initial [DOC] × 100).
Statistical analyses were conducted using Statistica 10. Analysis of variance (General Linear Model Nested Design ANOVA) was used to determine significant differences in soil properties and leachate yields among sites and thermal horizon (active layer vs. permafrost), followed by Tukey's HSD post hoc test. Regression analysis and General Linear Model (GLM) Separate Slopes Model were used to test for significant differences in the relationships between DOC, TDN, DON or DIN yields and soil properties (%C, %N, Δ14C) for active-layer and permafrost soils. Regression analysis was used to test for significance between % BDOC and various parameters.
3. Results
3.1. Soil properties
Active-layer thickness varied from 55−63 cm across the sites (table 1). Active-layer sample depths were ~35−50 cm at all sites. Permafrost sample depths varied from ~65−80 cm at CF to ~85−100 cm at HC (table 1). Maximum core depth at CF was 80 cm due to the presence of cobbles. Soil C and N contents ranged from <1 to 43.4 %C and <0.1 to 2.3 %N (table 1), typical of boreal soils (Harden et al 2012). HC soils had significantly greater %C (mean ± SD = 39.6 ± 3.69 %C; F = 141, p < 0.001) and %N (1.60 ± 0.45 %N; F = 34.4, p < 0.005) than CF soils (2.57 ± 1.15 %C, 0.16 ± 0.08 %N) and SL soils (5.21 ± 5.67 %C, 0.31± 0.33 %N). Within sites, active-layer and permafrost soils had statistically similar C and N contents. HC soils were younger (931 ± 406 ybp) than CF (5308 ± 2574 ybp) and SL soils (3803 ± 1904 ybp; table 1, F = 25.5, p < 0.005).
3.2. DOC yields
DOC yields (mg DOC g−1 soil dry weight) were significantly greater from HC soils (0.59 ± 0.23 mg DOC g−1 soil) than from CF (0.08 ± 0.06 mg DOC g−1 soil) and SL soils (0.23 ± 0.18 mg DOC g−1 soil; F = 21.07, p < 0.005; table 2). Within sites, there were no significant differences between active-layer and permafrost soil DOC yields (table 2). However, when considering active-layer and permafrost samples from all sites, DOC yields were positively linearly correlated with soil %C and the slopes and intercepts were significantly different for active-layer and permafrost soils (figure 2(a); GLM Separate Slopes Model, F = 21.0, p < 0.005). For a given soil C content, the DOC yield was about 1.4 times greater from permafrost soil than active-layer soil. DOC yields were linearly related to soil Δ14C ‰, with significantly different relationships for active-layer and permafrost soils (figure 2(b); GLM Separate Slopes Model, F = 17.9, p < 0.005). Thus, for a given soil radiocarbon age, DOC yield was greater from permafrost soils than active-layer soils. Note that soil %C negatively correlates with radiocarbon age, so we cannot assume these patterns are independent.

Figure 3. TDN yield (mg TDN g−1 soil dry weight) from active layer and permafrost soils as a function of (a) soil percent nitrogen, and (b) soil Δ 14C (‰). Each point represents one sample. The linear regression lines and equations are for active layer and permafrost samples.
Download figure:
Standard image High-resolution image3.3. Total DN, DIN, and DON yields
TDN yields (mg TDN g−1 soil dry weight) were significantly greater from HC soils (0.036 ± 0.028 mg TDN g−1 soil) than from CF soils (0.009 ± 0.011 mg TDN g−1 soil) and SL soils (0.013 ± 0.014 mg TDN g−1 soil; F = 15.4, p < 0.005; table 2). HC permafrost soil TDN yields were greater than all other soils (F = 11.0, p < 0.005; table 2). TDN yields increased linearly with soil %N, with significantly different slopes and intercepts for active-layer and permafrost soils (figure 3(a); GLM Separate Slopes Model, F = 10.5, p < 0.01). For a given soil N content TDN yield was about five times greater from permafrost soils than from active-layer soils. TDN yields decreased with increasing soil age, with significantly different relationships for active-layer and permafrost soils (figure 3(b); GLM Separate Slopes Model, F = 30.4, p < 0.005) so that for a given soil radiocarbon age, TDN yield was greater from permafrost soils than from active-layer soils. Soil %N negatively correlates with radiocarbon age, so similar to DOC yields we cannot assume these patterns are independent.
Nitrate and NH4+ concentrations in soil leachates were below the instrument detection limits (DL) in many cases (table S1). To estimate DIN yields (NO3− + NH4+) we assumed that values <DL were equal to the corresponding DL (0.003 mg N-NO3− L−1, 0.01 mg N- NH4+ L−1). The DIN yields should therefore be considered maximum potential estimates. DIN yields were <20% of TDN yields for all soils (table 2), and were significantly greater from HC soils (0.0006 ± 0.0002 mg DIN g−1 soil) than from CF soils (0.0003 ± 0.0002 mg DIN g−1 soil; F = 4.89, p < 0.05). DON yields were calculated as the difference between TDN and DIN yields, and should be considered minimum potential estimates. HC soils had significantly greater DON yields (0.035 ± 0.027 mg DON g−1 soil) than CF soils (0.003 ± 0.003 mg DON g−1 soil) and SL soils (0.013 ± 0.014 mg DON g−1 soil; F = 15.3, p < 0.01; table 2), and HC permafrost soil yields were significantly greater than all other soils (F = 11.0, p < 0.01). DIN and DON yields were significantly positively correlated with soil %N and soil radiocarbon age, and slopes for active-layer and permafrost soils were significantly different (not shown, GLM Separate Slopes Model, p < 0.05). DIN yields versus soil Δ14C intercepts were significantly different but slopes were not.
3.4. DOM chemical character
DOM optical properties were variable among sites and thermal horizon (tables 2, S1). SUVA254 was statistically similar across all soils, ranging from 1.6–3.8 L mg C−1 m−1. Spectral slope ratio, SR, was significantly different among sites (F = 18.4, p < 0.01) with HC (0.81 ± 0.04) < SL (0.91 ± 0.10) < CF (1.03 ± 0.11). Fluorescence Index (FI) was greater for CF (1.45 ± 0.08) than HC (1.30 ± 0.09; F = 4.6, p < 0.05), and statistically similar to SL (1.34 ± 0.11). Humification Index (HIX) was lower for CF (0.76 ± 0.05) than HC (0.89 ± 0.03) and SL (0.89 ± 0.04; F = 27.6, p < 0.005). Fluorescence peak intensities (table S1) were summed as protein-like (P) and humic-like + fulvic-like (HF) groups, and the ratio P:HF was calculated (table 2). CF had significantly lower HF fluorescence intensities than HC and SL (F = 6.4 p < 0.05). The P:HF ratio was greater for CF (0.43 ± 0.09) than HC (0.25 ± 0.06) and SL (0.24 ± 0.06; F = 19.3, p < 0.005).
Table 2. Soil leachate chemistry.
| Site name | Core | Sample depth (cm) | DOC yield (mg DOC g−1 soil) | TDN yield (mg TDN g−1 soil) | DIN yield (mg DIN g−1 soil)a | DON yield (mg DON g−1 soil)b | Specific UV absorbance (L mg C−1 m−1) | Fluorescence index (FI) | Spectral slope ratio (SR) | Humification index (HIX) | Protein-like fluorescence intensity (B+T; Raman units) | Humic + fulvic-like fluorescence intensity (A+C+D+E; Raman units) | Protein-like: Humic + fulvic-like fluorescence intensity | % Biodegradable DOC (BDOC)c |
|---|---|---|---|---|---|---|---|---|---|---|---|---|---|---|
| Coldfoot | C-1 | 35–50 | 0.05 | 0.001 | 0.0001 | 0.001 | 1.3 | 1.53 | 0.86 | 0.76 | 1.64 | 3.93 | 0.42 | 12 ± 1 |
| Coldfoot | C-2 | 35–50 | 0.11 | 0.007 | 0.0003 | 0.007 | 3.1 | 1.36 | 0.97 | 0.85 | 0.68 | 2.43 | 0.28 | 22 ± 6 |
| Coldfoot | C-3 | 35–50 | 0.03 | 0.001 | 0.0001 | 0.001 | 2.1 | 1.33 | 1.01 | 0.78 | 0.83 | 2.15 | 0.39 | 9 ± 4 |
| Coldfoot | C-1 | 65–80 | 0.03 | 0.002 | 0.0003 | 0.002 | 2.3 | 1.48 | 1.13 | 0.72 | 0.45 | 0.87 | 0.51 | 36 ± 12 |
| Coldfoot | C-2 | 66–80 | 0.17 | 0.007 | 0.0007 | 0.007 | 1.8 | 1.46 | 1.12 | 0.73 | 0.46 | 0.94 | 0.49 | 19 ± 1 |
| Coldfoot | C-3 | 67–80 | 0.06 | 0.004 | 0.0003 | 0.003 | 2.9 | 1.53 | 1.11 | 0.72 | 0.64 | 1.34 | 0.48 | 16 ± 4 |
| Hess Creek | H-1 | 35–50 | 0.49 | 0.014 | 0.0004 | 0.014 | 1.8 | 1.23 | 0.81 | 0.89 | 1.64 | 7.23 | 0.23 | 13 ± 1 |
| Hess Creek | H-2 | 35–50 | 0.43 | 0.010 | 0.0004 | 0.010 | 1.2 | 1.22 | 0.73 | 0.87 | 1.05 | 3.85 | 0.27 | 13 ± 4 |
| Hess Creek | H-3 | 35–50 | 0.45 | 0.015 | 0.0006 | 0.014 | 3.2 | 1.20 | 0.81 | 0.94 | 1.43 | 9.25 | 0.16 | 9 ± 1 |
| Hess Creek | H-1 | 85–100 | 0.61 | 0.066 | 0.0009 | 0.065 | 2.3 | 1.39 | 0.82 | 0.87 | 3.79 | 12.01 | 0.32 | 10 ± 4 |
| Hess Creek | H-2 | 86–100 | 0.52 | 0.038 | 0.0007 | 0.038 | 2.4 | 1.34 | 0.84 | 0.90 | 1.92 | 7.14 | 0.27 | 5 ± 1 |
| Hess Creek | H-3 | 87–100 | 1.04 | 0.072 | 0.0008 | 0.071 | 2.1 | 1.42 | 0.83 | 0.89 | 2.94 | 10.36 | 0.28 | 5 ± 1 |
| Smith Lake | S-1 | 30–45 | 0.02 | 0.001 | 0.00004 | 0.001 | 3.1 | 1.17 | 0.86 | 0.91 | 0.82 | 4.43 | 0.19 | 12 ± 6 |
| Smith Lake | S-2 | 35–50 | 0.15 | 0.011 | 0.0002 | 0.010 | 3.2 | 1.33 | 0.85 | 0.94 | 1.88 | 10.30 | 0.18 | 5 ± 3 |
| Smith Lake | S-3 | 35–50 | 0.14 | 0.004 | 0.0001 | 0.004 | 1.6 | 1.53 | 0.88 | 0.84 | 3.41 | 9.57 | 0.36 | 11 ± 1 |
| Smith Lake | S-1 | 87–102 | 0.48 | 0.021 | 0.0010 | 0.020 | 3.3 | 1.35 | 1.04 | 0.86 | 0.98 | 3.82 | 0.26 | 11 ± 3 |
| Smith Lake | S-2 | 78–90 | 0.43 | 0.038 | 0.0004 | 0.038 | 3.2 | 1.36 | 0.82 | 0.92 | 3.42 | 14.85 | 0.23 | 8 ± 3 |
| Smith Lake | S-3 | 74–89 | 0.16 | 0.006 | 0.0004 | 0.006 | 3.8 | 1.32 | 1.03 | 0.86 | 0.71 | 2.87 | 0.25 | 8 ± 1 |
aDIN yields are calculated from the sum of leachate nitrate and ammonium concentrations as mg N L−1. bDON yields are calculated from the difference between leachate TDN and DIN concentrations. c% Biodegradeable DOC equals mean ± one standard deviation of replicate incubation measurements.
Certain DOM optical properties of permafrost soil leachates were significantly related to soil Δ14C. P intensities (F = 22.2, p < 0.01, R2 = 0.76) and HF intensities (F = 15.6, p < 0.01, R2 = 0.69) decreased with increasing radiocarbon age (not shown). SR increased (F = 58.9, p < 0.001), and HIX decreased (F = 8.17, p < 0.05), with increasing soil radiocarbon age (figures S1(a) and (b)). Active-layer leachates showed similar trends, but correlations were not significant.

Figure 4. Biodegradable DOC (as % DOC loss) from active layer and permafrost soils as a function of (a) soil Δ 14C (‰), and (b) the ratio of dissolved organic matter protein-like fluorescence to humic + fulvic-like fluorescence (non-dimensional). Each point is the mean ± standard deviation of replicate BDOC measurements. The regression lines and equations are for permafrost samples.
Download figure:
Standard image High-resolution image
3.5. DOC biodegradability
DOC biodegradability (% BDOC) ranged from 5 ± 1% to 36 ± 12% (table 2, S1), and was significantly greater for CF soils (19 ± 10%) than for HC (9 ± 4%) and SL soils (9 ± 3%; F = 9.0, p < 0.01). There were no significant differences in %BDOC between active-layer and permafrost soils within sites. Permafrost soil % BDOC was significantly correlated with soil Δ14C (‰) (figure 4(a), F = 14.4, p < 0.01), and with P:HF fluorescence (figure 4(b), F = 25.0, p < 0.01), HIX (figure S2(a), F = 22.1, p < 0.01), and SR (figure S2(b); F = 13.4, p < 0.01). Correlations were not significant for active-layer soil leachates.
4. Discussion
Our results demonstrate that Holocene near-surface permafrost soils in boreal Alaska have potential to be an important source of DOC and TDN (mostly as DON) to surrounding terrestrial and aquatic environments upon thaw. DOC and TDN yields increase with soil C and N content and decrease with radiocarbon age as we would expect (Kalbitz et al 2000, Kaiser and Kalbitz 2012, Camino-Serrano et al 2014), but the relationship between yields and soil properties are significantly different depending on thermal horizon. Therefore thawing near-surface permafrost can be an equal or greater source of DOC and TDN than overlying active layer soils. This has important implications for projected releases from the near-surface permafrost soils which underlie ~34% of Alaska, more than half of which are predicted to thaw by 2090 (Pastick et al 2015). Carbon (figure 1(b), Hugelius et al 2013a, 2013b) and nitrogen (Harden et al 2012) contents of permafrost soils are spatially variable and thus DOC and TDN release with permafrost thaw will vary accordingly. Histels are estimated to have the greatest mean SOC storage (Hugelius et al 2014) and Turbels to have the greatest mean N storage (Harden et al 2012) in the upper 2 m of circumpolar soils. Although this study did not determine whether soils from our sites are representative of Alaska boreal region Histels (Hess Creek), Turbels (Smith Lake), and Orthels (Coldfoot), our analysis suggests that thawing Histels and Turbels could have the greatest potential impact on DOC and TDN release in boreal regions, respectively.
The consistent difference between permafrost and active-layer yields versus soil C and N contents for the diverse soils we studied likely results from annual exposure of active-layer soils to decomposition and leaching, and cryo-protection of permafrost soils from these processes. Additional mechanisms that could be responsible for relatively higher DOC and TDN yields from near-surface permafrost soils include solute inputs from overlying active-layer soils and microbial activity. The uppermost part of permafrost includes a 'transient layer' that stays frozen most years but occasionally thaws on sub-decadal to multi-centennial time scales (Shur et al 2005). These episodic thaw events may allow DOC and TDN leached from overlying active-layer soil to accumulate in the transient layer over time (Ping et al 2015) and/or for in-situ production of DOC and TDN. We collected permafrost subsamples ~15–30 cm below the maximum thaw depth measured the previous fall, but it is possible that this soil may be part of the transient layer. It is difficult to determine the depth and dynamics of the transient layer, but if we assume that the annual variation in active-layer thickness equals ~20% of the active-layer thickness (Shur et al 2005) then the Coldfoot site permafrost samples may fall within the transient layer. The Hess Creek and Smith Lake permafrost samples are about two times deeper than this assumed variation in active-layer thickness, so this mechanism may not currently affect soils at these depths. Another process to consider is the active microbial production of DOM in permafrost soils at <0 °C, which has been inferred by the presence of low molecular weight (LMW) organic acids in Pleistocene yedoma permafrost soils and ice wedges (Vonk et al 2013, Drake et al 2015, Ewing et al 2015). It is not possible to definitively say this is an important process in the permafrost soils in our study, but a cursory examination of DOM optical properties from the paired samples within each soil core suggest greater LMW DOM content (indicated by higher SR), greater proportion of microbially-derived DOM (indicated by higher FI), and relatively higher protein-like: humic + fulvic-like DOM fluorophores in permafrost versus active-layer soils. Together these optical indices suggest increased contribution from microbial by-products in the permafrost soils.
Direct comparison of leachate yields with other studies is problematic due to methodological differences, but some comparisons can be made. Our DOC yields (0.30 ± 0.27 mg DOC g−1 soil for all samples) are similar to yields for Pleistocene yedoma permafrost (0.30 ± 0.31 mg DOC g−1 soil, Dutta et al 2006, 0.46 ± 0.04 mg DOC g−1 soil, Drake et al 2015). It is important to note that yedoma soils are ~0.5%–2.5%C and the yields we measured for soils having comparable C content (0.12 ± 0.16 mg DOC g−1 soil) were 60% to 70% less than those yedoma yields. Studies of dissolved N yields from permafrost-affected soils are sparse. The one study we identified measured greater concentrations of nitrate, ammonia, and DOC in leachates of permafrost soils compared to active-layer soils in cores collected near Barrow, Alaska (Reyes and Lougheed 2015), similar to our results. Differences in DOM optical properties between active-layer and permafrost soils collected from sites in arctic Alaska (Ward and Cory 2015) and northern Finland (Selvam et al 2017) are consistent with our observations of greater proportions of LMW DOM, a more 'microbial' FI signature, and lower DOM humification in permafrost soils. While our experiment focused on initial release upon thaw, boreal soils with high C and N content continue to release DOC and DON with multiple leaching events over long periods (Neff and Hooper 2002, Kim et al 2014), suggesting that our short-term yields are conservative. Soil moisture content, leaching intensity, oxygen concentration, and to a lesser degree soil temperature, will importantly influence sustained DOC and TDN release (Neff and Hooper 2002, Kim et al 2014) after initial thaw.
The detection of increased release of soil-derived DOC and/or TDN with permafrost thaw is challenging because solute fate is determined by complex interactions among biotic and abiotic processes, residence time, and hydrologic transport along the terrestrial-aquatic continuum. DOC, DON and DIN are metabolized at variable rates (van Hees et al 2005, Harms and Jones 2012, Spencer et al 2015), and DOC and DON can sorb to mineral soil (Neff and Asner 2001, Kawahigashi et al 2006), transform along surface and subsurface flow paths (Striegl et al 2005, Koch et al 2013), or accumulate in pore waters in poorly drained areas (Wickland et al 2007). Nevertheless, studies of permafrost-impacted ecosystems across the circumpolar region have documented changes in DOC and TDN consistent with our conclusion that near-surface permafrost soils can be important DOC and TDN sources upon thaw (Harms et al 2013, Abbott et al 2015, Loiko et al 2017, Keuper et al 2012, 2017, Wauthy et al 2018). Regional studies in Siberia and Alaska broadly align with our findings (Frey and Smith 2005, Frey et al 2007, McClelland et al 2007, Walvoord and Striegl 2007), although many factors beyond release of soil-derived DOC and TDN are important at these large scales.
While considerable work remains to achieve complete understanding of the implications of permafrost thaw for C and N biogeochemical cycling across heterogeneous landscapes and over spatial and seasonal scales, our quantification of the relative soluble C and N source-strength, DOM chemical character, and DOC biodegradability of a wide range of boreal permafrost-impacted soils provides a basis for advancing that understanding. Changes in DOC and TDN release, positive or negative, will influence productivity and biogeochemical cycling in terrestrial and aquatic systems alike, necessitating further research that merges field and laboratory-based experimental data with large-scale spatial data on soils and hydrologic and biogeochemical modeling to fully assess and predict trajectories and effects across the cryosphere.
Acknowledgments
We thank J Harden for consultation in all stages of this study; we thank K Butler, J O'Donnell, and P Schuster for providing assistance in the field and in the laboratory; we thank T Drake and two anonymous reviewers for their constructive comments on an earlier version of the manuscript. We gratefully acknowledge support from the USGS Venture Capital program, USGS National Research Program, USGS Climate and Land Use Mission Area, and USGS Water Mission Area. This research is part of the Arctic-Boreal Vulnerability Experiment (ABoVE), a NASA Terrestrial Ecology project, under Award 14-TE14-0012. All data used to prepare this manuscript are archived and publicly available in the U.S. Geological Survey ScienceBase repository (available at https://www.sciencebase.gov/catalog/item/5afb7c8fe4b0da30c1b9c9df). Any use of trade, firm, or product names is for descriptive purposes only and does not imply endorsement by the US Government.