

Abstract
California has issued ambitious targets to decarbonize transportation through the deployment of electric vehicles (EVs), and to decarbonize the electricity grid through the expansion of both renewable generation and energy storage. These parallel efforts can provide an untapped synergistic opportunity for clean transportation to be an enabler for a clean electricity grid. To quantify this potential, we forecast the hourly system-wide balancing problems arising out to 2025 as more renewables are deployed and load continues to grow. We then quantify the system-wide balancing benefits from EVs modulating the charging or discharging of their batteries to mitigate renewable intermittency, without compromising the mobility needs of drivers. Our results show that with its EV deployment target and with only one-way charging control of EVs, California can achieve much of the same benefit of its Storage Mandate for mitigating renewable intermittency, but at a small fraction of the cost. Moreover, EVs provide many times these benefits if two-way charging control becomes widely available. Thus, EVs support the state's renewable integration targets while avoiding much of the tremendous capital investment of stationary storage that can instead be applied towards further deployment of clean vehicles.
Export citation and abstract BibTeX RIS
Introduction
Achieving deep global greenhouse gas reductions targets requires the electrification of transportation soon and at significant scale [1]. Towards this goal, California's Governor Brown has released the zero-emissions vehicle (ZEV) mandate, targeting the deployment of 1.5 million ZEVs by 2025, the vast majority of which will be plug-in electric vehicles (EVs) [2]. Other countries including China, France, and the UK have planned to phase out internal combustion engines [3–5]. Prior research has proven the capability for EVs to meet the travel needs of the vast majority of drivers in the US [6, 7]. Simultaneously, California is taking aggressive steps to decarbonize the electricity grid through a renewable portfolio standard (RPS) policy that requires 33% of grid energy to come from renewable generation by 2020, and 50% by 2030 [8]. Given the intermittent generating profiles of renewables such as wind and solar, unique challenges arise from increasing renewables generation to maintain grid balancing (the matching of supply and demand), which is critical for maintaining reliability of the electricity grid. To ensure continued grid reliability, California has also mandated the deployment of 1.3 GW of stationary storage by the end of 2024 [9]. While the ZEV Mandate, RPS, and Storage Mandate will make important progress towards achieving California's targets, a substantial synergistic opportunity exists if EVs from the ZEV Mandate are used to provide grid storage to support renewables integration.
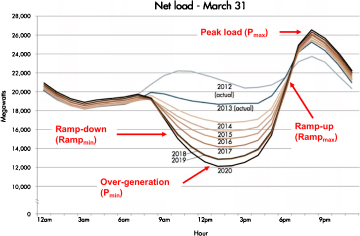
Figure 1. The duck curve (see definition in text). In the absence of interventions, the large-scale deployment of renewables targeted in California will lead to significant challenges for the grid. These challenges are summarized with CAISO's net load (duck curve) forecasts. In March the energy demand is still low (air conditioning demand is low), but the amount of solar generation is already similar to what is encountered in summer months.
Download figure:
Standard image High-resolution imageBy displacing the need for construction of new stationary grid storage, EVs can provide a dual benefit of decarbonizing transportation while lowering the capital costs for widespread renewables integration [10–12]. These benefits are not limited to California, but are applicable worldwide whenever EVs and renewables generation become widespread. The capability of EVs to enhance the integration of renewable energy sources including wind [13–18] and solar [19–24], into the existing power grid has been widely discussed. For a more thorough review of the literature, see the supplementary materials available at stacks.iop.org/ERL/13/054031/mmedia. In this study, we quantify the potential for clean vehicles to be an enabler for a clean electricity grid by using EV batteries to mitigate renewables intermittency.
Methods
To quantify the challenges that California's electricity system will face as substantial renewables generation (especially solar) is deployed, the California Independent System Operator (CAISO) released their 2014 historical and 2021 forecast daily net load (commonly called the duck curve due to its visual resemblance), illustrated in figure 1 [25]. CAISO defines net load as the demand on the grid minus the generation from intermittent renewables for approximately 80% of California's population (the remainder is managed by entities outside CAISO's jurisdiction). Each line in the duck curve provides a historical or forecast net load profile for a single day (March 31) in each year. Increasing solar generation is largely responsible for the evolving shape of the curve. The duck curve points to four important problems as more renewables are deployed:
- 1.Low daytime net load, Pmin, while load is low and solar generation is at a maximum, leading to substantial problems with over-generation as solar capacity increases. This will require either daily reductions in the output from large baseload generating stations, which is often not cost effective, or curtailment of renewable generation, which runs counter to renewable energy goals.
- 2.High evening net load, Pmax, when load peaks for the day but there is little output from solar generation.
- 3.Sharp mid-morning down-ramps, Rampmin, when solar output is rapidly increasing. Down-ramps refer to when the change in net load with time is negative.
- 4.Substantial evening up-ramps, Rampmax, when load is increasing at the same time that solar generation is decreasing. This will require rapidly bringing additional generation resources online and rapidly ramping up online resources (a technically difficult and potentially expensive challenge to be faced daily). Up-ramps refer to when the change in net load with time is positive.
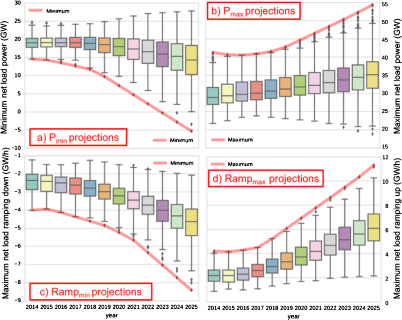
Figure 2. In the absence of interventions, the large-scale deployment of renewables targeted in California will lead to significant challenges for the grid. These challenges are summarized in figure 1 with CAISO's net load (duck curve) forecasts. By interpolating between CAISO net load data for 2014 and 2021, and extrapolating beyond 2021 we find that: 1) daytime over-generation, shown in (a), will become highly problematic with system-wide net load falling to levels requiring substantial renewables curtailment on a regular basis, [2] evening peak net loads will continue increasing, shown in (b), even though more renewables generation is being installed each year, [3] daily down-ramping rates shown in (c), and daily up-ramping rates shown in (d), will continue moving in problematic directions necessitating substantially more expensive grid resources to mitigate. It is clear that new mitigations strategies are needed to ensure grid reliability as more renewables are deployed—a key motivation for California's Storage Mandate.
Download figure:
Standard image High-resolution imageOver-generation, Pmin, and sharp evening up-ramps, Rampmax, are commonly considered the most severe of these challenges [26].
The duck curve presented in figure 1 provides a snapshot for a single day of each year. We forecast hourly net loads for each day of the year out to 2025 by scaling between historical net load data from 2014 and net load projections for 2021 from CAISO [27]. The forecasting methodology is explained in the supplementary materials.
We quantify how increasing numbers of EVs will affect the evolving duck curves in three scenarios: (1) if EVs are charged in an uncontrolled manner, (2) if vehicles are grid-integrated with controllable charging only (one-way power flow, or V1G), and (3) if vehicles are grid-integrated with controllable charging and discharging rates (two-way power flow, or V2G) for the worst day of each forecast year. Our assumptions for the number of EVs are consistent with California statewide projections [30, 31] in 2025 of 500 000 battery EVs (BEVs) and 1 000 000 plug-in hybrid EVs (PHEVs). Our distribution of charger availability as level 1 (i.e. 120 V wall outlets) or level 2 (i.e. dedicated charging station with 10 kW maximum power transfer if allowed by the EV) for residential, work and public locations is consistent with California's Vehicle-Grid Integration roadmap [32]. We assume that EV owners are always able to charge at home, and the number of charging station at work progressively increases, so that by 2025, 60% of EVs will have charging available at the workplace. In scenario 3, when V2G is enabled, 30% of workplace chargers and 60% of home chargers can provide V2G grid services, while the rest are V1G only. In the simulation, BEVs and PHEVs are respectively modeled using Nissan Leaf and Chevrolet Volt characteristics (presented in the supplementary materials). The EV battery size increases from 24 kWh in 2014 to 72 kWh in 2025. Assumption are presented in greater detail in the supplementary materials.
The opportunity from grid integrating vehicles to mitigate the duck curve is examined for two different charging/discharging control objectives: (1) peak shaving and valley filling, which aims to reduce over-generation and evening peak problems, and (2) ramp mitigation, which aims to reduce abrupt changes in net load. We formulate quadratic optimization problems to optimize the charging/discharging schedule of EVs, subject to constraints on the minimum and maximum states of charge of vehicle batteries and charge point availability. Details of the control algorithm formulations are presented in the supplementary materials.
Results and discussion
From the hourly forecasts through 2025, we extract projections of the four key quantities, Pmin, Pmax, Rampmin, and Rampmax, and present a summary of results in figures 2(a)–(d). The red contour in each plot shows each quantity for the worst day of each forecast year, while the bars show the distributions for each day of the forecast year (boxes represent the central 50% of days, and whiskers indicate the central 95%). Figures 2(a)–(d) show that each quantity is moving in a problematic direction as more renewables are installed.
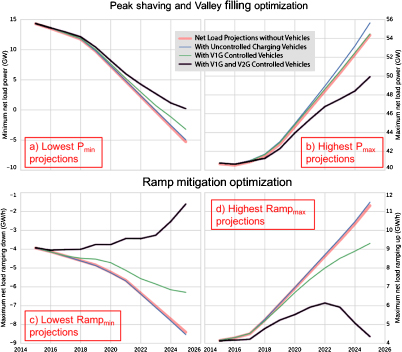
Figure 3. The impact of EVs with uncontrolled charging (blue), V1G-only controlled charging (green), and controlled charging with a mix of V1G and V2G vehicles (black), compared with the original net load projections (red). From the blue versus red contours it is apparent that vehicles will not substantially harm the system-wide net load if all EVs in California's ZEV mandate are deployed with uncontrolled charging; however, they will also not help much. In a V1G-only case (comparing the blue vs. green contours), there are substantial benefits for ramping mitigation and day-time valley mitigation, while the evening peaks are no worse than the original duck curve. However, in the case with a mix of V1G and V2G vehicles (comparing the black vs. blue contours), there is a big opportunity for renewables integration with vehicles. Pmin and Pmax will both be ameliorated by almost 5 GW in 2025, allowing grid-integrated EVs to mitigate daytime over-generation and evening peaks more effectively than the 1.3 GW Storage Mandate. More importantly, EVs with some V2G can play a significant role in mitigating the sharp up-ramps and down-ramps that will be caused by large-scale renewables deployment. In the scenario with a mix of V1G and V2G vehicles, ramping rates can be controlled to within today's levels.
Download figure:
Standard image High-resolution image
Figure 4. Capital cost value of equivalent grid-scale stationary storage that provides the same duck curve mitigation capability as EVs. Figure (a) shows the equivalent battery size and cost for V1G-only vehicles. For valley-filling and ramp-up mitigation (i.e. the most severe of the duck curve problems), V1G-only vehicles fulfill 1.0 GW of storage-equivalent, a large fraction of the 1.3 GW Storage Mandate, and provide equivalent capability as $1.45–$1.75 billion of stationary storage investment. This represents a substantial cost savings for renewables integration, as V1G is readily achievable at less than $150 million over uncontrolled charging with today's technology6. In a scenario with a mix of V1G- and some V2G-capable vehicles, figure (b) shows that EVs provide equivalent services of 5.0 GW of stationary storage for valley-filling and ramp-up mitigation, the equivalent of $12.8–$15.4 billion in stationary storage investment. Simply stated, EVs with only V1G can fulfill the vast majority of California's Storage Mandate at much lower costs than deploying new stationary storage. With some EVs having V2G capability, vehicles can significantly outpace the renewables integration potential of stationary storage.
Download figure:
Standard image High-resolution imageThe California system is currently estimated to have 13–15 GW of non-dispatchable generating resources [28], which are defined as generation that is difficult or highly undesirable to ramp down. In other words, in today's grid system in California it is highly problematic when net load falls below 15 GW. In 2014, the net load fell below 15 GW for only 0.03% of the year. By 2025, however, net load is forecast to fall below 15 GW for 14.2% of the year. Similarly, by 2025, ramp down and ramp up rates will be twice as large as they were in 2014, reaching −8 GW/h and +11 GW/h, respectively. The additional 7 GW/h ramp up need by 2025 is equivalent to requiring an additional 35 natural gas turbine 600 MW plants over a 3 hour period to ramp from 0% to 100% output5.
Simultaneously with substantial renewables deployment, California is targeting the adoption of 1.5 million ZEVs, most of which will be EVs. Many of the EVs on the road today are charged in an uncontrolled manner: they begin charging when first plugged in, and do not stop until the vehicle's battery is full, or until the driver unplugs for their next trip. The impact through 2025 of EVs with uncontrolled charging on the duck curve is seen by comparing the blue versus red contours in figures 3(a)–(d). EVs with uncontrolled charging have only a minor impact on the projected duck curves. Evening peaks, down-ramping, and up-ramping, all get slightly worse. Most notably, given that vehicles tend to finish charging by the time of day when the worst Pmin is encountered, EVs with uncontrolled charging will do little to mitigate the daytime over-generation problems. When comparing against uncontrolled charging, it is clear there is a substantial lost opportunity if vehicles are not integrated with the grid.
The opportunity from grid integrating vehicles with V1G only is seen by comparing the green and blue plots in figure 3, while the black contour shows the case with a mix of V1G and V2G vehicles. Grid integrated vehicles can strategically time their charging to alleviate the daytime valley in the duck curve by delaying charging to the time when net load is the lowest (i.e. when solar generation is highest). From figure 3(a), grid integrated vehicles are substantially more effective at alleviating daytime over generation problems than vehicles with uncontrolled charging. Although it is clear from figure 3(a) that vehicles alone cannot solve the daytime over-generation problems, nearly 2 GW of renewables curtailment can be avoided with V1G only vehicles, and nearly 5 GW in the case with a mix of V1G and V2G vehicles; substantially more than with the 1.3 GW Storage Mandate. Later in the day, for the case with a mix of V1G and V2G vehicles, the evening peaks can be reduced by more than 5 GW by 2025 compared with the uncontrolled scenario.
The real strength of grid-integrated vehicles in mitigating the duck curve is in avoiding large system-wide ramping, as seen in figures 3(c) and (d). In the V1G-only case, down-ramping and up-ramping are both mitigated by more than 2 GW/h by 2025. In the case with a mix of V1G and V2G vehicles, however, substantially larger gains are seen. Both down-ramping and up-ramping are substantially mitigated, by almost 7 GW/h, equivalent to avoiding construction of 35 natural gas 600 MW plants for ramping mitigation5. Importantly, it is seen that EVs can maintain ramping rates at or below today's levels even with substantial renewables deployment on California's grid.
Recognizing the problems forecast in the duck curve, the California Public Utilities Commission issued the Storage Mandate in 2013 that targets deployment of 1.3 GW of stationary storage by the end of 2024 [9]. To estimate the value of grid-integrated vehicles towards achieving the Storage Mandate, we estimate the capital cost of stationary storage that provides comparable benefits to mitigate the duck curve. We calculate the power and energy capacity of stationary systems that achieve the same Pmin, Pmax, Rampmin, and Rampmax as grid-integrated vehicles. From the identified power and energy specifications, we then calculate the capital cost of each stationary system. While costs vary depending on storage technology, financing assumptions and other considerations, we utilize prior literature [33] estimates of relatively mature, commercial-scale NaS battery capital costs of $516/kW and $426/kWh; e.g. $3 072/kW for a 6 hour battery. Further details on our methodology are presented in the supplementary materials.
In the V1G-only scenario summarized in figure 4(a), the duck curve mitigation capability of EVs is equivalent to grid-scale storage valued at between $1.45–$1.75 billion. From the duck curve, daytime over-generation and extreme evening up-ramps are commonly recognized as the most severe challenges for California's grid. Notably, in the V1G-only scenario, EVs provide 1.0 GW of equivalent storage for both these grid services. From pricing of today's commercially available charging stations on the cost of V1G over uncontrolled charging (which is already being deployed in support of the ZEV Mandate), we estimate this 1.0 GW of equivalent storage from V1G is available with an added investment of less than $150 million6—substantially less than the cost of equivalent stationary storage. Thus, for mitigating over-generation and evening up-ramps, the vast majority of the 1.3 GW California Storage Mandate can be fulfilled with only V1G vehicles at substantially less cost compared with the construction of new stationary battery storage.
In the second scenario, with achievable levels of V2G capability by 2025, figure 4(b) shows that EVs have a more substantial impact, providing duck curve mitigation capability equivalent to between $12.8 to $15.4 billion of stationary storage. As oppose to the V1G case, V2G capabilities increase the battery degradation as a result of higher battery usage when discharging on the grid. In [35] the battery lifetime was shown to be reduced by 10% when providing V2G services every day. Hence, we see V2G services as being call upon only a few days a year when a larger capacity is needed. In this scenario, valley-filling and ramp-up mitigation services equivalent to that of 5.0 GW of stationary storage are achieved with vehicles, substantially more than the 1.3 GW called for in California's Storage Mandate.
Our results show that California's Storage Mandate can largely be achieved through the ZEV Mandate with only V1G-capable vehicles—a substantial finding given that V1G is readily available today with little added cost compared with uncontrolled charging6. With some EVs being V2G-capable, vehicles will substantially exceed the renewables integration capability of stationary storage from the Storage Mandate. Thus, the ZEV Mandate provides a pathway to supporting renewables integration and achieving the Storage Mandate while avoiding the high costs of deploying stationary storage. This raises the attractive prospect that funds intended to support stationary storage rollout could instead be redirected toward additional deployment and grid-integration of EVs.
Ensuring that EV owners participate in controlled charging could be a challenge. To incentivize participation, for example, EV owners could be paid (e.g. by accessing lower electricity rates when charging at home, or reduced parking fees when utilizing public charging) when their vehicles are grid-connected and participating in controlled charging, with possibly higher incentives for and/or sparing utilization of V2G to avoid excessive battery degradation. Another concern may be range anxiety if an unforeseen trip becomes necessary, particularly midway through the day when vehicles are not normally fully charged, but charging service providers could offer emergency fast charging in these circumstances. Some users may also be concerned about their data privacy regarding disclosure of travel pattern information, but the information required to effectively manage controlled charging is very limited (e.g. minimum charge level required by a certain time), and participation in controlled charging would always be voluntary.
In addition to participating in the energy market (e.g. bulk storage/multi-hour load shifting) as modeled in this paper, EVs could also participate in shorter time-scale ancillary services markets (e.g. frequency regulation, spinning reserves, etc.). However, we expect the ancillary service markets to saturate quickly, because less overall capacity is required compared with bulk energy storage [38], reducing the per vehicle value of participation. Nonetheless, especially at the distribution grid level, new opportunities might arise for vehicles to provide local ancillary services and/or defer grid upgrades, and could be an interesting topic of future research.
Conclusions
California is in the process of deploying substantial amounts of renewable generation, targeting 50% of grid-supplied energy coming from renewables by 2030. In this study, we forecast the significant grid challenges that arise as more renewables are deployed, specifically the increasing daytime over-generation, increasing evening peaks, and increasing up-ramp and down-ramps. We show that EVs with only V1G capability provide renewables integration capability equivalent to 1.0 GW of stationary storage, a large fraction of the 1.3 GW Storage Mandate, but at a small fraction of the cost. With some vehicles being V2G capable by 2025, vehicles provide renewables integration capability far exceeding that of the Storage Mandate during critical days. Thus, our results show that substantial capital investment, as much as several billion dollars, can be avoided if EVs are used in lieu of stationary storage. In other words, the California Storage Mandate can be accomplished through the ZEV Mandate, provided that controlled charging is also widely deployed. The capital investment for stationary storage can instead be redirected to further accelerate the deployment of clean vehicles and vehicle-grid integration, and could even be used to pay EV owners when their vehicles are grid-connected with controlled charging. In this manner, not only are clean vehicles an enabler for a clean electricity grid at substantially lower capital investment, but the avoided costs of supporting renewables with stationary storage can be used to further accelerate the deployment of clean vehicles.
Acknowledgments
Simulations of vehicle-grid interactions presented in this study were conducted with the Vehicle-to-Grid Simulator (V2G-Sim) developed at Lawrence Berkeley National Laboratory. V2G-Sim is available for download at http://v2gsim.lbl.gov. This work was supported with funding from the US Department of Energy Vehicle Technologies Office, under the Grid Modernization Lab Consortium. Further support was provided by the Laboratory Directed Research and Development program at Lawrence Berkeley National Laboratory, by the Director, Office of Science, of the US Department of Energy under Contract No. DE-AC02-05CH11231. The authors acknowledge the careful review, feedback, and contributions of several colleagues, especially Noel Crisostomo, Joseph Eto, Rao Konidena, Scott Moura, and Elpiniki Apostolaki-Iosifidou.
Footnotes
- 5
We calculate the equivalent number of natural gas plants for ramping needs as follows: from reference [28], we assume each natural gas power plant has a ramping capability of 60 MW min−1. We further assume each natural gas power plant has a 600 MW maximum power output capacity. Finally, we assume that the ramp-up must be sustained over a 3 hour period, consistent with many days identified in CAISO's duck curve [10]. Given a ramp-up need of X in MW/min, the number of equivalent natural gas plants to meet that ramp up need is calculated as:
 .
. - 6
Charging station manufacturers [34] already have V1G-controllable charging stations on the market today, at a cost of $100 more than an uncontrolled charger. Assuming 1.5 million vehicles and built-in or portable control devices, the total cost of deploying V1G over uncontrolled charging is $100 × 1.5 million = $150 million. We, however, note that these differential costs are estimated per charger, while we are seeking costs assuming 1.5 million vehicles (i.e. scaling will lead to lower costs). Further, we note that many vehicles on the market today already include the necessary communications and control capability (e.g. GM's On-Star system, and on-board charge controllers in many EVs). Thus, the true costs of implementing V1G over uncontrolled charging may be substantially lower than this estimate.