

Abstract
Thermal pollution from power plants degrades riverine ecosystems with ramifications beyond the natural environment as it affects power supply. The transport of thermal effluents along river reaches may lead to plant-to-plant interferences by elevating condenser inlet temperatures at downstream locations, which lower thermal efficiencies and trigger regulatory-forced power curtailments. We evaluate thermal pollution impacts on rivers and power supply across 128 plants with once-through cooling technologies in the Mississippi River watershed. By leveraging river network topologies with higher resolutions (0.05°) than previous studies, we reveal the need to address the issue in a more spatially resolved manner, capable of uncovering diverse impacts across individual plants, river reaches and sub-basins. Results show that the use of coarse river network resolutions may lead to substantial overestimations in magnitude and length of impaired river reaches. Overall, there is a modest limitation on power production due to thermal pollution, given existing infrastructure, regulatory and climate conditions. However, tradeoffs between thermal pollution and electricity generation show important implications for the role of alternative cooling technologies and environmental regulation under current and future climates. Recirculating cooling technologies may nearly eliminate thermal pollution and improve power system reliability under stressed climate-water conditions. Regulatory limits also reduce thermal pollution, but at the expense of significant reductions in electricity generation capacity. However, results show several instances when power production capacity rises at individual plants when regulatory limits reduce upstream thermal pollution. These dynamics across energy-water systems highlight the need for high-resolution simulations and the value of coherent planning and optimization across infrastructure with mutual dependencies on natural resources to overcome climate-water constraints on productivity and bring to fruition energy and environmental win-win opportunities.
Export citation and abstract BibTeX RIS
Introduction
Power plants with once-through (OT) cooling technologies account for 64% of water withdrawals for electricity generation in the US and cause thermal pollution, which degrades riverine ecosystems [1–7]. Between 1970–2015, the US thermoelectric generation sector almost tripled its productivity in the context of water withdrawals from 110 to 39 m3 per MWh [8–10]. This gain can be largely attributed to the growth of thermoelectric generation met with technologies other than OT-based steam plants. These include plants with recirculating technologies (RC) and more thermally efficient natural gas combined-cycle plants. Despite improvements in water use efficiency, the absolute amount of electricity generation (MWh) from OT-based plants that depend on riverine freshwater has increased by 26% since 1970 [8–10]. Thermal effluent levels are reflective of OT-based electricity generation and have also increased by 18% since 1970 [8–10]. This highlights the importance of understanding thermal effluent impacts under existing and anticipated infrastructure given the continued reliance on OT technologies and transition to RC technologies.
Warm river temperatures and thermal effluents are not only an environmental concern. Thermal pollution is regulated under the Clean Water Act (CWA) section 316(a), which prohibits plants without variance permits from raising river temperatures above threshold limits to the extent that electricity generation may need to be curtailed [11, 12]. In addition, OT-based plants rely on sufficiently cool river temperatures to maintain optimal thermal efficiency [13, 14]. Previous electricity generation vulnerability studies have concentrated on climate and water resource change impacts, while thermal pollution assessments have had a unitary focus on determining the temperature rise on receiving waters [5, 15–22]. In regions where power plants are closely populated along rivers, thermal pollution from upstream plants may cause plant-to-plant thermal interference and increase condenser inlet temperatures at downstream OT-based plants, potentially lowering thermal efficiencies and triggering CWA curtailments [23]. Yet, there are no studies that exclusively assess thermal pollution impacts on power plants themselves, and thus no determination of its significance in the context of power supply.
The importance of incorporating higher spatial and temporal resolutions to reliably assess thermal pollution is also yet to be addressed. Thermal pollution and electricity generation vulnerability assessments across large domains are typically executed at a 0.5° spatial resolution, although few have used higher resolutions (0.05°, 0.125°) [5, 16, 17, 20, 21, 24–26]. Studies that use coarse spatial resolutions may misgauge the extent of thermal pollution as it forces placement of multiple plants inside a single grid cell and fails to capture finer-scale variations in river discharge, temperatures and thermal equilibration rates. Thermal equilibration rates play a significant role in river temperature modeling as they determine the natural warming or cooling of a river and the longevity of thermal pollution as it moves downstream [27–29]. Temporal resolution is another crucial element to consider as thermal effluents, climate-water conditions and thermal equilibration rates all have substantial seasonal contrasts, and daily fluctuations within seasons [5, 30].
In this study, we evaluate thermal pollution impacts on power supply at 128 OT-based plants in the Mississippi River watershed. Thermal pollution and power output are simulated using the coupled Water Balance Model and Thermoelectric Power and Thermal Pollution Model (WBM-TP2M) [5, 23]. The models are executed at a daily time step between 1995–2015 using a more resolute 0.05° (5 × 5 km) river network topology and comprehensive plant-specific power generation requirements than previous studies [30]. In addition, we compare results at the 0.05° vs. 0.5° spatial scales to provide insight on the importance of spatial resolution in thermal pollution and electricity generation modeling assessments. We model eight scenarios to address three topics: (i) the current state of thermal pollution and plant-to-plant interferences; (ii) the importance of spatial scales for modeling thermal pollution and power supply; (iii) alternative technology, environmental regulation and climate impacts on tradeoffs between thermal pollution and power supply.
The study focuses on summer months when electricity generation is at its peak, river temperatures are warmest and CWA curtailments typically occur [8, 11]. Three metric categories are discussed: adjusted available capacity (AAC): the available capacity as a percentage of nameplate capacity accounting for losses or gains in thermal efficiencies due exclusively to changes in condenser inlet temperatures (AACC) and the total AAC (AACT) accounting for all climate-water impacts and CWA-forced curtailments; plant-to-plant interferences: thermal interferences (TI) and consumptive interferences, when thermal effluents and consumptive water use at upstream plants lower the AAC at downstream plants, respectively; thermal pollution: the length (km) of river reaches where thermal effluents cause an increase of 1 °C–3 °C (TP1−3) or >3 °C (TP>3) in river temperatures above natural conditions (as if thermal pollution is absent). Results provide insight for thermal pollution, power plant vulnerability and energy-water resource planning and assessments.
Table 1. Eight modeling scenarios designed to address three discussion topics: (1) current thermal pollution impacts and plant-to-plant inferences along rivers; (2) importance of spatial scales for modeling thermal pollution and power supply; (3) policy, technology and climate impacts on thermal pollution and power supply. CWA=Clean Water Act, OT=once-through, RC=recirculating.
| Scenario | CWA scenario | Cooling technology scenario | Plant-to-plant interference | Description of Scenario |
|---|---|---|---|---|
| BASE | — | — | On | Baseline (years 1995–2015) climate, electricity generation, thermal pollution and river discharge and temperature conditions |
| BASE-NI | — | — | Off | Water resource conditions and available capacities adjusted as if there is no connectivity (NI) of power plant impacts along river networks (i.e. isolated operations) |
| BASE-0.5 | — | — | On | Identical to BASE simulated with a 0.5° spatial resolution instead of 0.05° resolution |
| BASE-NI-0.5 | — | — | Off | Identical to BASE-NI simulated with a 0.5° spatial resolution instead of 0.05° resolution |
| CWA | Strict 316 (a) | — | On | Adjusted thermal effluent levels and available capacities (due to curtailed power output) from BASE when river temperatures approach CWA threshold limits |
| TECH | — | Conversion from OT to RC | On | All once-through systems under BASE are converted to recirculating cooling systems, eliminating all thermal pollution from once-through plants |
| CWA-TECH | Strict 316 (a) | Conversion from OT to RC | On | Power plants curtail operations when river temperatures approach CWA threshold limits and thermal pollution is lowered due to technology changes and CWA regulations |
| CLIMATE | — | — | On | Air temperature (+/− °C) and precipitation (% change) adjusted according to HadGEM2-ES RCP 8.5 for years 2040–2059 vs. 1985–2004 |
Methods
The study focuses on the Mississippi River watershed as it accounts for the majority (75%) of OT-based capacity that relies on riverine freshwater in the US, most of the curtailment events due to CWA temperature limits when enforced (CWA limits may not always be enforced) and 90% of thermal pollution impacts on power supply (SI available at stacks.iop.org/ERL/13/034033/mmedia) [10, 11, 31–32]. Between 1995–2015, 87–128 OT-based plants (66–81 GW) and 179–198 RC-based plants (111–146 GW) were simulated. RC-based plants have a minimal impact on river temperatures, largely due to relatively small effluent volumes, and their thermal impacts are discussed in the SI. OT-based plants that withdraw water from sources other than riverine freshwater were excluded as the focus is on free flowing water bodies. Power plant characteristics were obtained from Ventyx (2016) [10].
WBM-TP2M was used to simulate power plant operations and thermal effluents as a function of hydrologic flows, climate conditions including air temperature and humidity, prime mover, cooling technology, electricity generation requirements and CWA regulations [5, 23]. Thermal efficiencies were calculated as a function of condenser inlet temperatures (SI). Reservoir operations were not simulated to isolate and attribute thermal impacts specifically to thermal power plant operations. Water released from reservoirs may exacerbate or limit thermal impacts by warming or cooling downstream temperatures [33]. To more definitively estimate absolute river temperatures and impacts on electricity generation, more localized climate conditions, sub-daily electricity generation and river flow/temperature dynamics, river temperature and flow effects on cooling water for nuclear reactors (regulated limits) and thermal impacts from both power plants and reservoirs could be incorporated in future studies [34].
Daily electricity at individual plants is based on Environmental Protection Agency's Air Markets Program Data (EPA-AMPD) and the daily averages for each month were estimated from the Energy Information Administration when information was not available in the EPA-AMPD (i.e. nuclear generators) [8, 30]. Days with higher electricity generation correspond with days with higher thermal effluents and the discussion focuses on months of peak electricity generation (June, July, August) to provide an upper bound of thermal impacts on power supply. Although thermal pollution occurs throughout the year, it is mitigated via cooler temperatures in other seasons compared to the summer (winter results in SI).
Climate forcing data was obtained from the National Center for Environmental Prediction for years 1995–2015 [35]. The models were run at a daily time step (all days between 1995–2015) and 0.05° river network resolution for all scenarios, with two additional scenarios simulated using a 0.5° river network resolution to highlight the importance of spatial resolution in thermal pollution modeling. Under the 0.5° simulation, power plants with the same prime mover and cooling technology were aggregated and river length adjusted according to Fekete et al (2002) (SI) [36]. The 128 OT-based plants under the 0.05° resolution were aggregated to 97 0.5° cells. Model performance was assessed against 606 discharge and 118 stream temperature gauges from the United States Geological Survey [37].
Eight scenarios were simulated (table 1). The BASE (0.05° river network) and BASE-0.5 (0.5° river network) scenarios are considered as the baseline climate, electricity generation, thermal pollution and river discharge and temperature (1995–2015). The no interference (NI) BASE-NI and BASE-NI-0.5 scenarios are identical to the BASE and BASE-0.5, respectively, but thermal effluents and consumptive water use impacts are not transported downstream. Therefore, there are no plant-to-plant interferences under BASE-NI and BASE-NI-0.5. A comparison of the BASE scenarios with their respective BASE-NI scenarios reveals impacts of upstream thermal pollution and consumptive water use on rivers, power supply and plant-to-plant interferences. The CWA scenario applies a strict interpretation of CWA 316(a) to the BASE scenario, which prevents power plants from elevating river temperatures beyond state-defined threshold limits, potentially leading to curtailments at both RC-based and OT-based plants. In the TECH scenario, all OT technologies under BASE are replaced with RC technologies. Consequently, the nameplate capacity of plants decreases by 2% where this conversion takes place due to power requirements for additional pumping of water between a cooling tower and the condenser [38]. The CWA-TECH scenario is a combination of the CWA and TECH scenarios. Lastly, the CLIMATE scenario applies air temperature and precipitation changes according the HadGEM2-ES global circulation model under representative concentration pathway 8.5 (more extreme warming) for years 2045–2064 [39]. Under CLIMATE, future climate-water impacts are analyzed with respect to the existing infrastructure and there is no change in electricity demand or capacity.
Three metric categories facilitate discussions of tradeoffs between thermal pollution and power supply:
- 1.Adjusted available capacity (AAC): The AAC value is the net available capacity (MW) for each day, at each plant, as if a plant was operating under the modeled climate-water conditions [26]. AAC is reported as a percentage, by dividing the AAC by the respective nameplate capacity of each plant, to represent a normalized net capacity for each plant. Partial loss or gain in AAC due exclusively to changes in condenser inlet temperatures is defined as AACC. The total loss or gain accounting for all climate-water impacts and CWA-forced curtailments is defined by AACT.
- 2.Plant-to-plant interferences: Interference between two power plants occurs when operations at an upstream plant cause lower AAC at a downstream plant. Lower AAC may result from elevated condenser inlet temperatures and/or less water available for cooling due to thermal pollution and/or consumptive water use induced by the upstream plant, respectively. Discussions include consumptive water use impacts, but these are typically minimal, and the focus is on thermal plant-to-plant interferences (TI). A single plant upstream may have multiple interferences that affect (cause lower AAC) downstream plants while a downstream plant may be affected (have lower AAC) by multiple upstream plants (SI). Plants can be both affecting and affected. A TI occurs when thermal effluents from an upstream plant cause an increase of the condenser inlet temperature at a downstream plant by a minimum 0.01 °C and lower the thermal efficiency. A 0.01 °C threshold reflects a minimum 0.005% loss in relative thermal efficiency (the operational efficiency loss is dependent on a plant's optimal efficiency), and provides an upper limit for impacts on AAC. Thermal pollution attributed to a single plant is tracked along a river, potentially affecting and passing downstream plants, until it is < 0.001 °C, at which point it is assumed have dissipated (SI). Across the river networks of the watershed there are a total of 2287 potential TI between the 128 OT-based plants, some of which may not be realized.
- 3.Thermal pollution: The length (km) of river reaches where thermal effluents cause an increase of 1 °C–3 °C (TP1−3) or >3 °C (TP>3) in river temperatures. Thermal pollution levels are calculated by subtracting the river temperatures in BASE-NI (as if thermal pollution is absent) from BASE, CWA, CWA-TECH and CLIMATE for each day and river network grid cell in the watershed.
Results and discussion
The current state of thermal pollution impacts and plant-to-plant interferences
A comparison of BASE and BASE-NI shows thermal effluents from upstream OT-based plants warm river temperatures, causing thermal interferences (TI) with downstream plants and lower AAC. A total of 1076 (47%) of the potential TI are realized between 1995–2015, but not simultaneously. Daily TI range between 88–434 (figure 1(a)), while thermal effluents from 31–100 plants cause AACC losses at 22–98 plants (figure 1(b)). This variability is caused by daily changes in both the sum of thermal effluents released from all plants in the watershed (1.6–3.2 TWh) and natural climate-water conditions, resulting in a significant range in TP1−3 (145–3854 km) and TP>3 (0–1812 km). Furthermore, TI decrease substantially between years 2009–2015 when 41 OT plants are taken offline, highlighting the importance of accounting for holistic energy sector trends and sub-seasonal variability when assessing environmental impacts.

Figure 1. Daily (n = 92 days × 21 years) thermal pollution impacts on rivers, power supply and plant-to-plant interferences in the Mississippi River watershed: (a) plant-to-plant thermal interferences (b) power plants by interference type, (c) impaired river reaches due to thermal pollution as a percentage of total potential affected river reaches (total potential =13 400 km), (d) AAC (adjusted available capacity) loss due to thermal pollution and upstream water consumption.
Download figure:
Standard image High-resolution image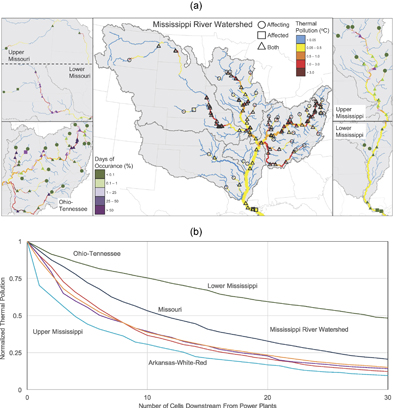
Figure 2. Plant-to-plant thermal interferences in the Mississippi River watershed (summertime, 1995–2015). (a): OT-based (once-through) plants by interference type and average thermal pollution levels in °C above natural temperatures (center) and thermal pollution impacts on power supply shown as the number of days when AACC loss due to upstream thermal pollution is >1% out of the total possible days (%) (regional maps). (b): Normalized thermal pollution levels as rivers flow downstream from polluting plants across five sub-basins and the entire Mississippi River watershed for all plant-day occurrences (n = 197 122).
Download figure:
Standard image High-resolution image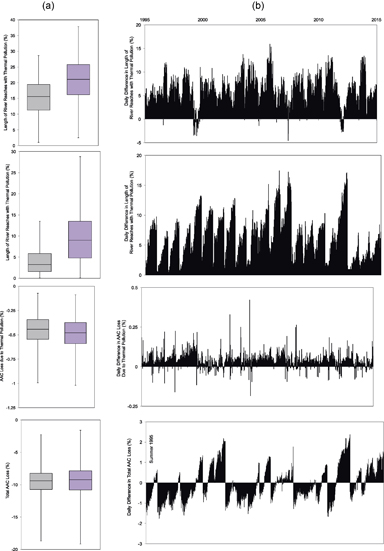
Figure 3. Disparities in thermal pollution levels (TP1−3 and TP>3) and power performance (AACC due to thermal pollution and AACT) across the Mississippi River watershed using coarse (0.5°) vs. finer (0.05°) river networks. (a): Absolute values for all days (n = 92 days × 21 years). (b): Difference in absolute values on each day for BASE-0.5 - BASE.
Download figure:
Standard image High-resolution image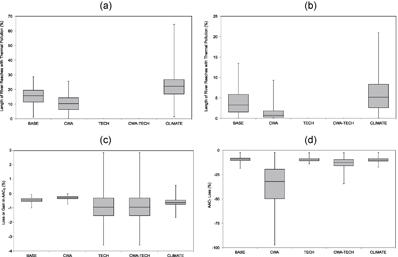
Figure 4. Comparison of policy, technology and climate scenarios (CWA, TECH, CWA-TECH, CLIMATE) with baseline conditions (BASE). (a) and (b): Thermal pollution levels TP1−3 and TP>3, respectively, as a percentage of total potential affected river reaches (total potential for 0.05° = 13 400 km). (c): AAC losses (negative) or gains (positive) due exclusively to changes in condenser inlet temperatures (AACC). (d): Total climate-water constraints on power performance (AACT). Results show all days (n = 92 d × 21 years) and are for the entire Mississippi River watershed.
Download figure:
Standard image High-resolution imageThermal pollution causes a modest limitation on power supply. Over the entire period (1995–2015) there is an average AACC loss of 0.5% (range = 0.1%–1.0%) due to thermal pollution that is also relatively consistent, despite a 28% decrease in thermal effluents between 2005–2015. This AACC loss represents a small portion (5.4%) of AACT loss at OT-based plants, meaning that nearly all capacity losses stem from naturally occurring climate-water constraints and not thermal pollution from upstream power plants. It is even more insignificant when placed in the context of total OT and RC-based capacity (0.2%). However, thermal impacts differ across sub-basins and the most extreme occur in the more densely plant-populated Ohio-Tennessee and Missouri basins (figure 2). For instance, there are 75 plants that experience a total of 27 288 plant-days when AACC loss due to thermal pollution is >1% (15% of possible instances in the watershed), which almost all occur in the Ohio-Tennessee (64%) and Missouri (26%) basins. Therefore, the implications of TI need to be addressed in a localized, sub-basin and individual plant context to identify periods and domains with more acute thermal impacts.
Extreme weather conditions exacerbate plant-to-plant interferences. For instance, AACC loss due to thermal pollution is amplified under drought conditions in 2012 (+37% compared to other years). Similarly, AAC loss resulting from upstream consumptive water use is typically minimal (average = 0.03%), but also more significant during periods of drought. In 2012, AAC loss due to upstream water consumption is 1.6x that due to thermal pollution. However, these results do not imply that power output at the affected plants was dispatched at the simulated level. To more definitively address impacts to the power grid, results could be integrated into electricity dispatch models to assess the potential implications for regional power systems and production costs.
Thermal pollution impacts are diverse across the sub-basins of the Mississippi River watershed given unique regional climate-water-energy characteristics that also determine thermal dissipation rates. Thermal dissipation rates are represented by a region's normalized thermal pollution, which is the rate that river temperature re-equilibrates toward its natural temperature as it flows downstream from a thermally polluting plant. The Lower Mississippi basin has the lowest thermal dissipation rate across the sub-basins, where normalized thermal pollution decreases by 25% after the first ten downstream cells from a polluting plant (figure 2). Yet, the basin has the lowest absolute thermal pollution (TP1−3 and TP>3 = 0 km) because of a small thermal effluent to river discharge ratio, implying more immediate thermal dilution. This results in relatively low AACC loss due to thermal pollution (0.1%). In contrast, the Ohio-Tennessee basin has both the highest thermal effluent to river discharge ratio and plant-population density. This results in the longest stretches of thermally polluted river reaches (TP1−3 = 1641 km and TP>3 = 350 km) despite normalized thermal pollution decreasing by 63% after the first ten downstream cells (~2.5x more rapid dissipation than Lower Mississippi). The combined effects lead to an AACC loss due to thermal pollution that is more than 5x greater (0.6%) than Lower Mississippi.
The importance of spatial scales for modeling thermal pollution and power supply
Modeling experiments using coarse (0.5°) river networks may not be suitable to estimate thermal pollution impacts and climate-water constraints on electricity generation. The normalized thermal pollution in the Mississippi River watershed decreases by 61% after the first 10 downstream cells from a polluting plant (figure 2). This implies that thermal impacts are most intense, but dissipate rapidly, within a 0.5° cell. A comparison of thermal pollution using a 0.5° (BASE-0.5 and BASE-NI-0.5) vs. 0.05° (BASE and BASE-NI) river network reveals that not capturing finer-scale thermal dissipation rates leads to an overestimation of median TP1−3 and TP>3 by 38% and 184%, respectively (figure 3).
Overall AACT losses and AAC C losses due to thermal pollution appear similar using 0.5° and 0.05° river networks, but only in absolute terms (figure 3(a)). The daily difference in AACT (BASE-0.5 vs. BASE) and AACC loss due to thermal pollution range between −2.4% to 1.8% and −0.2% to 0.4%, respectively, equal to significant relative differences (AACC: −57% to 293%, AACT: −34% to 29%). The AACC loss due to thermal pollution is typically overestimated (88% of days) as a direct result of higher thermal pollution levels under the 0.5° vs. 0.05° resolution. Meanwhile, the difference in AACT stems from more complex discrepancies in river discharge and temperatures between BASE-0.5 and BASE. Over the Mississippi River watershed, condenser inlet temperatures weighted by nameplate capacity (sampled at plant locations) are almost always (99.9% of days) cooler under BASE-0.5 compared to BASE. This is largely because river discharge is aggregated over coarse cells, which creates an artificially larger heat sink for the atmosphere, lowering the natural warming rate and temperature of rivers. This combined effect reduces AACT losses under BASE-0.5 vs. BASE at the beginning of most summers (June 1st) (SI). However, river discharge weighted by nameplate capacity decreases as air temperatures warm (June 1st–August 31st) and this rate of decrease is more rapid under BASE-0.5 vs. BASE. Simultaneously, inlet temperatures become warmer at a faster rate under BASE-0.5 vs. BASE. Together, these effects constrain AACT more rapidly through the summer under BASE-0.5 vs. BASE to the extent that AACT loss under BASE-0.5 gradually shifts from being overestimated to underestimated during most summers.
Differences in results due to spatial resolution show the necessity of capturing dynamics along and across multiple tributaries within coarse cells to better estimate the dissipation of heat along rivers. Including more localized conditions, beyond those accounted for here, may help improve estimates of power supply vulnerabilities and thermal pollution. Finer spatial resolutions may capture more immediate and extreme thermal pollution gradients along and across rivers at a plant's cooling outlet [40]. The disparities in results also show the need to assess the effects of different spatial scales (i.e. 0.025° to 0.5°) in water balance and river temperature modeling, which could help determine adequate thresholds of spatial scales for modeling at the macro-scale.
Alternative technology, environmental regulation and climate impacts on thermal pollution and power supply
There are tradeoffs in thermal pollution levels and power supply performance across the technology, policy and climate scenarios. For instance, there is a significant decrease in both TP1−3 (median = 34%) and TP>3 (median = 78%) under CWA, which enforces limits on thermal effluents that may lead to electricity generation curtailments, relative to BASE. These lower thermal pollution levels lead to a beneficial rise in AACC (median = 0.2%) (figure 4). However, plant-to-plant interferences (upstream thermal pollution and consumptive water use) trigger curtailments at downstream plants and are exclusively responsible for a 3.4% AACT loss, equivalent to 7 × AACT loss due to plant-to-plant interferences under BASE. Under CWA, naturally warm river temperatures also lead to curtailments as they approach threshold CWA limits, and combined with curtailments due to plant-to-plant interferences, there is a substantial reduction in AACT (median = 22.7%) compared to BASE. This negates any advantages of lower thermal pollution levels for systems-level power supply.
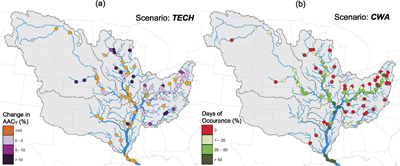
Figure 5. Policy and technology implications for power performance: (a) Change in average AACT under TECH compared to BASE during drought conditions (summer days in 2007 and 2012) showing the importance of water use efficiency when climate-water resource conditions are stressed and (b) the number of days (1995–2015) out of the total possible days (%) that AACT increases at individual power plants under CWA, revealing the importance of cooperative power supply and water resources management.
Download figure:
Standard image High-resolution image
The conversion of OT to RC technologies, under TECH and CWA-TECH, is a successful approach to lowering thermal effluents as median TP1−3 and TP>3 both decrease by 100% relative to BASE. However, condenser inlet temperatures at RC-based plants (wet-bulb temperature plus approach) under TECH may be warmer than at OT-based plants (river temperature) under BASE, causing additional AACC losses in TECH despite lower thermal pollution. Therefore, the median AACC is 0.5% lower than BASE, despite some days with higher AACC resulting from lower thermal pollution. Power performance benefits of RC vs. OT technologies are removed when curtailments are triggered under CWA-TECH, which lower median AACT by 3.1% below BASE. Removing the CWA component from CWA-TECH, under TECH, nullifies the more substantial capacity losses due to curtailments. Yet, the combined effect of efficiency penalties, due to additional on-site power consumption for RC pumping requirements, and warmer condenser inlet temperatures when converting OT to RC leads to an overall reduction in AACT (median = 0.4%).
Anticipated mid-century climate conditions exacerbate thermal pollution levels, but the impact on power supply is limited. Under CLIMATE, average river discharge at the mouth of the Mississippi River decreases by 12% and combined with warmer ambient temperatures there is an increase in TP1−3 (median = 41%) and TP>3 (median = 60%) relative to BASE. Despite lower river discharge volumes, there is a moderate increase in condenser inlet temperature across all plants (average = 0.14 °C), resulting in slightly lower AACC (median = 0.2%) and AACT (median = 0.3%) compared to BASE. This is largely because there is still enough cooling water to support operations and limit the extent to which condenser inlet temperatures increase, as river temperatures rise at a slower rate than air temperatures. Nonetheless, AACT is lower compared to BASE on 75% of days, showing that climate-water changes will consistently lower potential power output relative to current conditions.
Tradeoffs between climate-water conditions, thermal pollution and power performance vary spatially and temporally. For instance, the benefits of RC-based plants are maximized under drought conditions (2007 and 2012) as they increase AACT by 21% under TECH relative to BASE (figure 5). Although OT is a more efficient cooling method when water volumes and temperatures are ideal (such as the Mississippi River even during drought conditions), RC-based plants show potential to alleviate some climate-water constraints and boost systems-level reliability during drought conditions [41, 42]. This increase in power supply at RC-based plants is despite more water consumption and the additional 2% loss in AACT due to pumping requirements, compared to their OT-based counterparts. Meanwhile, AACT under CWA is always lower than BASE for the entire watershed, but there are several instances when AACT is greater at individual plants (small increases) due to lower upstream thermal pollution. There are 95 plants that experience this phenomenon on a total of 49 592 plant-days (27% of total possible occasions), mostly (43%) in the densely plant-populated Ohio-Tennessee basin where there are also no instances of higher overall AACT. Nonetheless, this result highlights the importance of strategic power supply and water resources management to help realize any potential energy and environmental win-win opportunities.
Conclusion
There is a modest overall limitation imposed by thermal pollution on power supply in the Mississippi River watershed, under current power system configuration, regulatory and climate conditions. However, the extent of thermal impacts differs across sub-basins given unique regional climate-water-energy conditions and may also differ across major global basins. Importantly, results show the need to address the issue in a more spatially resolved manner, capable of uncovering diverse impacts across individual plants, river reaches and sub-basins. Finer spatial and temporal scales are crucial for capturing thermal pollution impacts, thermal dissipation rates along river reaches and climate-water impacts on power supply. Recent studies that employed coarse (0.5°) river network resolutions and overlooked seasonal contrasts in electricity generation and climate-water conditions may have misgauged power supply vulnerabilities and the extent of thermal pollution impacts.
Constraints on power supply due to thermal pollution and warm river temperatures increase under strict adherence to CWA temperature limits and warmer climate conditions. This re-emphasizes the vulnerabilities of OT-based plants and the importance of water use efficiency, achieved through alternative cooling technologies or increased renewable (less water dependent) power supply. These technology advancements may be an effective adaptation strategy for improving power supply reliability under warmer and drier conditions [26]. Electricity expansion models that incorporate economic power sector and technology assumptions could be employed to provide further insight on thermal pollution impacts under future climates and electricity generation infrastructure [43].
Counter-intuitive findings were revealed and leveraged from utilizing higher resolution river network topologies. These include benefits to power supply at individual plants as a consequence of lower upstream thermal pollution under stringent CWA temperatures limits. This shows the value of understanding the linkages across Earth-systems and infrastructure and the potential role that optimization can play in power system operations and environmental protection. Similarly, water supply from upstream reservoirs (not simulated in this study) may be optimized to increase available capacity at vulnerable downstream plants by lowering the instantaneous impacts of thermal pollution, an approach used by the Tennessee Valley Authority [44]. Coherent planning across energy-water systems, which is typically segregated, may help overcome operational challenges and productivity constraints, especially under extreme weather conditions.
Acknowledgments
This work was carried out under the National Science Foundation's Water Sustainability and Climate grant #1360445.