

Abstract
Cities are particularly vulnerable to climate risks due to their agglomeration of people, buildings and infrastructure. Differences in methodology, hazards considered, and climate models used limit the utility and comparability of climate studies on individual cities. Here we assess, for the first time, future changes in flood, heat-waves (HW), and drought impacts for all 571 European cities in the Urban Audit database using a consistent approach. To capture the full range of uncertainties in natural variability and climate models, we use all climate model runs from the Coupled Model Inter-comparison Project Phase 5 (CMIP5) for the RCP8.5 emissions scenario to calculate Low, Medium and High Impact scenarios, which correspond to the 10th, 50th and 90th percentiles of each hazard for each city. We find that HW days increase across all cities, but especially in southern Europe, whilst the greatest HW temperature increases are expected in central European cities. For the low impact scenario, drought conditions intensify in southern European cities while river flooding worsens in northern European cities. However, the high impact scenario projects that most European cities will see increases in both drought and river flood risks. Over 100 cities are particularly vulnerable to two or more climate impacts. Moreover, the magnitude of impacts exceeds those previously reported highlighting the substantial challenge cities face to manage future climate risks.
Export citation and abstract BibTeX RIS

Original content from this work may be used under the terms of the Creative Commons Attribution 3.0 licence.
Any further distribution of this work must maintain attribution to the author(s) and the title of the work, journal citation and DOI.
Introduction
Over 75% of the population of the European Union lives in urban areas, and this percentage is expected to grow to 82% by 2050 (UN-HABITAT 2011). The agglomeration of people, assets and economic activity makes cities particularly vulnerable, and thus priority areas for climate change impact assessment (Dawson 2007, Shi et al 2016). Recent decades have seen record-breaking heat extremes worldwide (Hansen et al 2012, Coumou et al 2013), like the western European heat-wave during the summer of 2003 (with a death toll above 70,000 (Robine et al 2008)) and eastern European/Russian heat-wave of 2010 (estimated death toll around 55,000 (Barriopedro et al 2011)). In the summer of 2017, the Mediterranean region endured heat-wave 'Lucifer' at the end of July and beginning of August. While in June Portugal was severely affected by wild fires that killed 65 people (Viegas et al 2017) that occurred during a concurrent heat-wave and severe drought (IPMA 2017). Observed changes in droughts are method-dependent (Sheffield et al 2012, Dai 2013, Trenberth et al 2014) while changes in precipitation extremes are spatially-heterogeneous (Donat et al 2013). Still, in the period 1998–2009 floods in Europe caused 1126 deaths and at least 52 billion euros in insured economic losses (EEA 2011).
Previous European assessments have shown that the number of heat-waves in Europe is projected to increase, with greater increases expected in southern Europe. Jacob et al (2013) showed that these increases are mostly robust and significant throughout the EURO-CORDEX RCP8.5 model ensemble but depend on the definition of heat-wave (ranging from an increase of nine to 45 heat-waves). Fischer and Schär (2010), estimated that Iberia and the Mediterranean region will see the biggest changes in number of heat-wave days (from 2 days to 27–67 days). However, the biggest increases in heat-wave amplitude, will be over south-central Europe where extreme temperatures are expected to rise much more (up to 7 K) than mean summer temperature.
Assessment of changes in drought depends on the type of drought being studied (meteorological, agricultural, hydrological, etc.) and on the drought index chosen. Nevertheless, droughts are projected to become longer/more frequent in central Europe and the Mediterranean region (Cisneros et al 2014) and in the Iberian peninsula (Guerreiro et al 2017b). Forzieri et al (2014) concluded that future discharge decreases in the South of Europe and increases in the North of Europe were significant, but in between (the transition zone) the projections were discordant.
Meanwhile, analysis of extreme high river flows in Europe provides conflicting assessments about the direction of change. Dankers and Feyen (2009) projected a decrease in extreme river discharge in North-eastern Europe, although the extent of this area varied with different experiments. Elsewhere in Europe, different experiments showed mixed patterns partially due to large internal variability in the climate model runs. Both Rojas et al (2012) and Roudier et al (2016) also found no agreement in the sign of the change in vast areas of Europe.
The discord amongst these studies stems from three main factors. First, different hazard definitions are used (different types of drought investigated using different drought indices, different return periods used for assessing floods and different definitions of heat-waves). Second, different methods are employed to characterise each climate hazard. Third, studies choose different, small subsets of available climate model runs, in some cases using just one climate model (e.g. ESPON (2011)), that are insufficient to characterize uncertainties due to simulated natural variability and model errors. Furthermore, studies typically do not assess different hazards using the same data and methods making it impossible to compare them fairly. These inconsistencies are of particular concern because cities, nations and the European Union are using this information to allocate and prioritise billions of dollars of adaptation investments (European Comission 2013).
Here we assess for the first time future changes in droughts, heat-waves and floods for 571 European cities, that addresses shortcomings in previous assessments by using consistent (widely available) data, all projections from CMIP5 for the RCP8.5 emissions scenario, and comparable methods for each hazard. An overview of the data and methods is provided in the next section, while extensive information about the methodology is in the supplementary information available at stacks.iop.org/ERL/13/034009/mmedia. Our main results are presented and discussed in section 3 (the full list of results is in the supplementary information). The final section gives some conclusions and recommendations for future work.
Data and methods
Only datasets that provided complete EU (or global) coverage were used to ensure consistency:
- the digital elevation map, the flow direction raster and the flow accumulation raster from Hydro1K (USGS 2011);
- gauge discharge data from the Global Runoff Data Centre (GRDC);
- Urban Audit dataset 'GISCO Urban Audit 2004' and the Urban Morphological zones 2000 from the European Environment Agency (EEA);
- Daily rainfall, maximum and minimum temperature from CMIP5, RCP8.5;
- and the European daily gridded dataset, E-OBS (Haylock et al 2008), for precipitation and maximum and mean surface temperature. Full details on the data used are in section 1 of the Supplementary Information.
To assess the full range of projected changes to climate risks, we analysed all available members of the ensemble of climate projections from CMIP5 for the RCP8.5 emissions scenario (50 model runs for precipitation and 52 for temperature). Projections of climate impact were calculated for flooding, heat-waves and droughts for 571 European cities from the Urban Audit database. All indices were calculated for all cities for all climate model runs, but for clarity of presentation, we report only the 10th, 50th and 90th percentiles of each indicator in each city, designated as Low, Medium and High impact scenarios. These should not be interpreted as probabilities but as indicative of the range of outputs from CMIP5 (section 2, supplementary information). Changes are calculated by comparing analysis of the future period (2051–2100) and the historical period (1951–2000). For drought and heat-wave assessment, each European city was assigned the output of the climate model grid cell where it is located. For flood assessment, river basins were delineated based on the maximum flow accumulation point inside each city boundary and changes in river discharge at the city location calculated.
Heat-waves were defined as three consecutive days where both the maximum and the minimum temperature exceed their respective 95th percentile from the historical period. All calculations were done for May to September. Two indicators were calculated, for each climate model run and each city:
- change in the percentage of heat-wave days (i.e. difference between future and historical percentage of heat-wave days); and,
- change in maximum temperature of heat-waves (i.e. difference between future and historical maximum temperature during a heat-wave).
To characterize drought, the Drought Severity Index—DSI (Bryant et al 1992, Phillips and McGregor 1998), was used. It is based on cumulative monthly precipitation anomalies and can be calculated for different time-scales. A 12 month time-scale (DSI-12) is recommended to reflect drought affecting surface and groundwater resources (Bordi et al 2009). To standardise the index, the absolute deficit (in mm) is divided by the mean annual rainfall and multiplied by 100. Therefore, the final index value expresses the accumulated precipitation deficit as a percentage of the mean annual rainfall. DSI-12 is a rainfall index and therefore does not account for an increase in drought due to increasing temperatures (and subsequently potential evaporation). For each climate model run and each city DSI-12 time-series were calculated and two indicators derived:
- the probability for any given month in the future to be above the maximum historical DSI-12; and,
- the change factor of maximum drought, i.e. future maximum DSI-12 divided by historical maximum DSI-12.
European river flow data from the Global Runoff Data Centre (GRDC) with at least 9 years of daily data between 1950 and 2013 and less than 5% missing data were used for the flooding assessment. For each station the upstream river basin was delineated in order to obtain its area and climatology (see more information on data correction and selection in section 5 of supplementary information). The 1 in 10 year return periods of annual maximum daily discharge (Q10) were calculated using a GEV distribution and confidence intervals (95%) were calculated.
E-OBS data(Haylock et al 2008) were used to extract basin average annual and monthly values for:
- precipitation,
- maximum, mean and minimum temperature, and
- a simplified measure of snow pack, calculated as the amount of mean monthly precipitation that falls when the minimum monthly temperature is negative for each E-OBS cell.
- Potential evapotranspiration (PET)—calculated for each basin using the Thornthwaite equation (Thornthwaite 1948) based on latitude and the basin mean monthly temperature.
Various regression models for Q10 (with and without transformations such as normalization and using logarithms) were trialled using different combinations of monthly, seasonal and annual basin values of precipitation, PET, snow pack and rainfall (precipitation minus snow-pack). Besides the usual statistical measures of goodness of fit (R-squared, correlation between variables, predictive power of the used variables, and statistics of the residuals) the robustness of the regression across possible ranges of values of predictors was carefully considered, since the model must be applied to all Europe. Therefore, lower R-squared values and higher errors at each gauge were preferred to overfitting the regression to the available data. The following regression equation was selected:

where Q10 is the 1 in 10 year return period of annual maximum daily discharge, Pmax is the maximum monthly mean precipitation, and A is the river basin area. The adjusted R-squared for the regression was 0.84. Both predictors were significant (p-values bellow 1.41−13) and had low variance inflation factors (1.05) meaning that multi-collinearity was low (i.e. the variables of the regression are not correlated); therefore the model was considered robust. More information is included in the supplementary information (including the regression errors and predictive intervals as well as the Q10 confidence intervals).
The results of the linear regression were used to calculate Q10 for rivers flowing through European cities. Cities were considered to have a river if the maximum flow accumulation cell within the city corresponded to a catchment area of at least 500 km2. Change factors for maximum monthly mean precipitation for each basin from the climate model runs were than applied to the E-OBS precipitation values and the future Q10 were calculated using the same regression. The changes in discharge are presented as ratios.
More detailed information about the data and each stage of the methodology is provided in the supplementary information, the results for all 571 cities are provided in table S.2.
Results and discussion
An increase of both the number of heat-wave (HW) days and the maximum HW temperature is projected for every city under all scenarios. The number of HW days (calculated for May–September) increases more for cities in southern Europe, but the higher maximum temperature increases during HWs (HWTmax) are expected in cities located in central Europe where changes can reach 14 °C. The increase in the number of heat-wave days is shown in figure 1(a)) and range from a 4% increase in the low impact scenario in Trondheim (Norway), to a 69% increase in Lefkosia and Lemesos (Cyprus) for the high scenario.
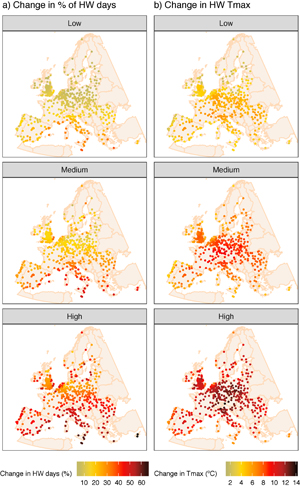
Figure 1. (a) Change (difference) in the percentage of summer (May-September) days classified as heat-wave days. (b) Change in the maximum daily maximum temperature for days classified as heat-wave days. Both shown for a low (10th percentile) impact scenario (top), a medium (50th percentile) impact scenario (middle) and a high (90th percentile) impact scenario (bottom) for each European city. The changes are calculated between the historical period (1951–2000) and the future period (2051–2100).
Download figure:
Standard image High-resolution image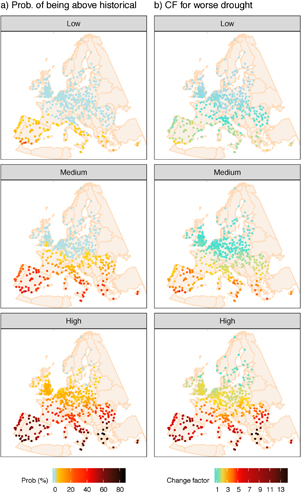
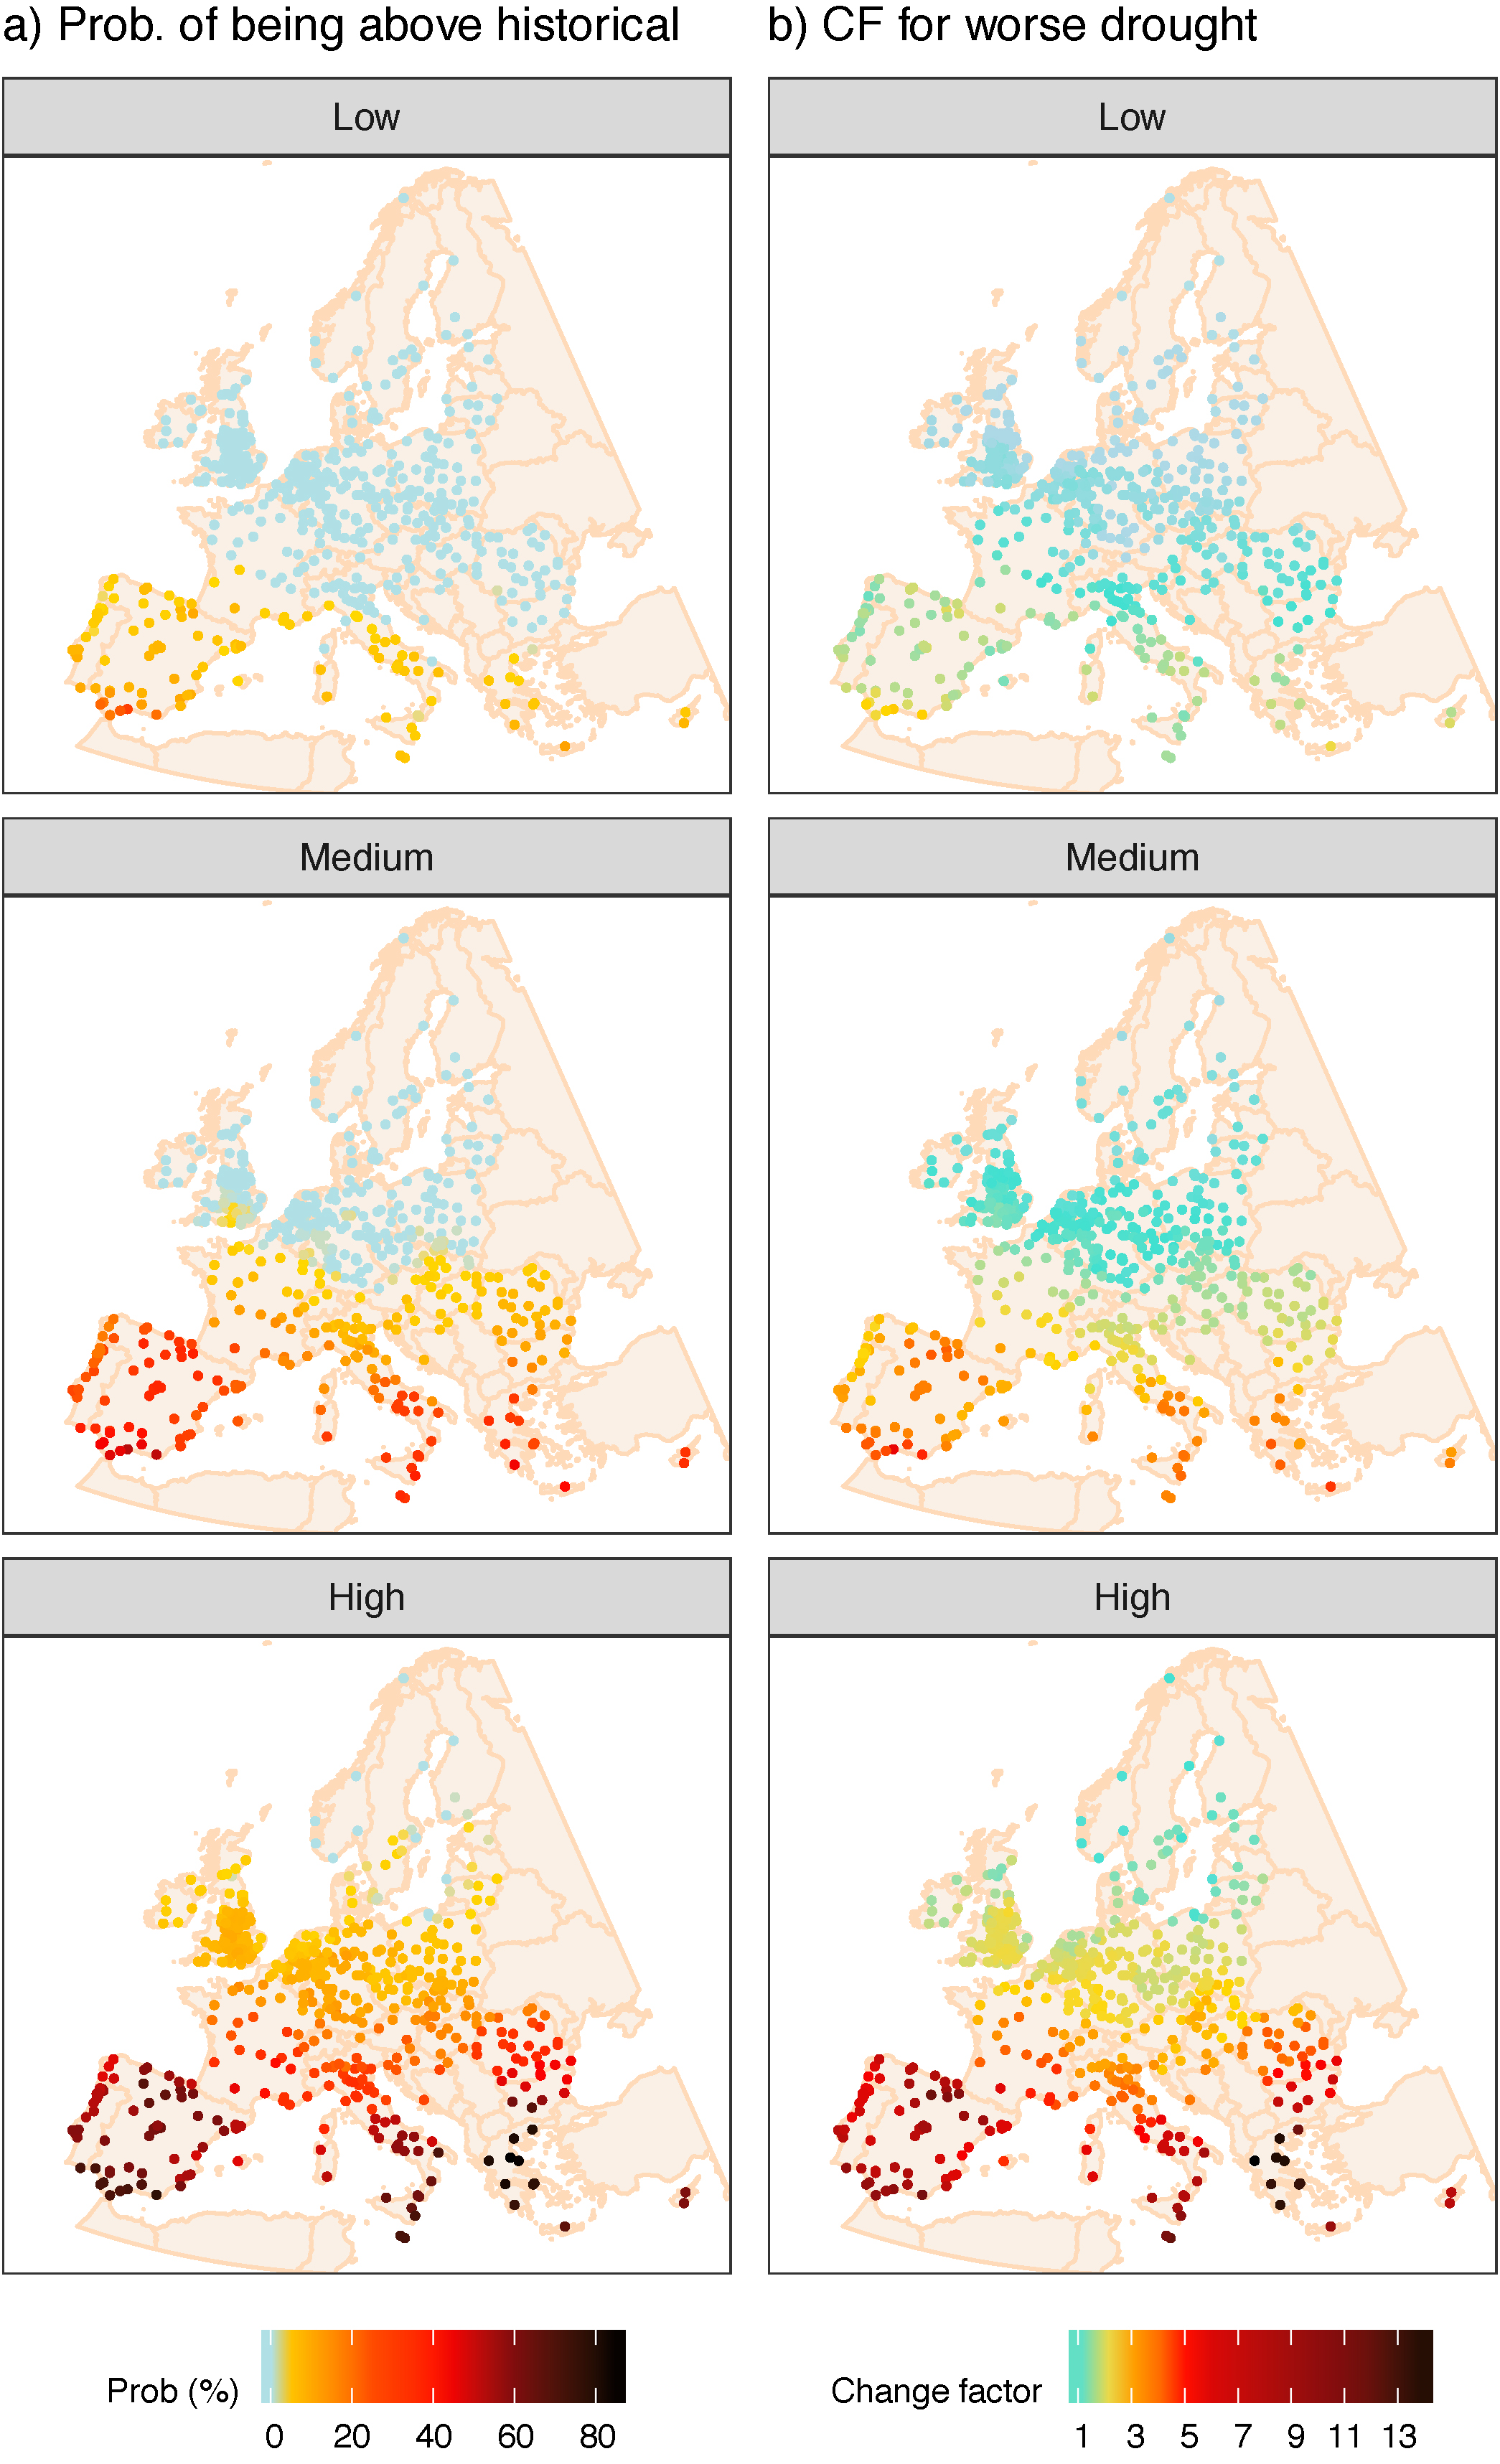
Figure 2. (a) Probability for any given month in the future being above the historical maximum DSI-12 (HMD). B) Maximum DSI-12 change factor—future maximum DSI-12 divided by HMD. Both shown for a low (10th percentile) impact scenario (top), a medium (50th percentile) impact scenario (middle) and a high (90th percentile) impact scenario (bottom) for each European city. The historical period is 1951–2000 and the future period is 2051–2100.
Download figure:
Standard image High-resolution image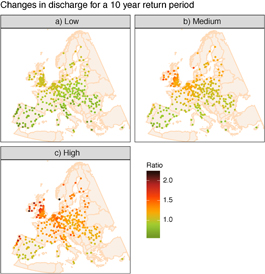
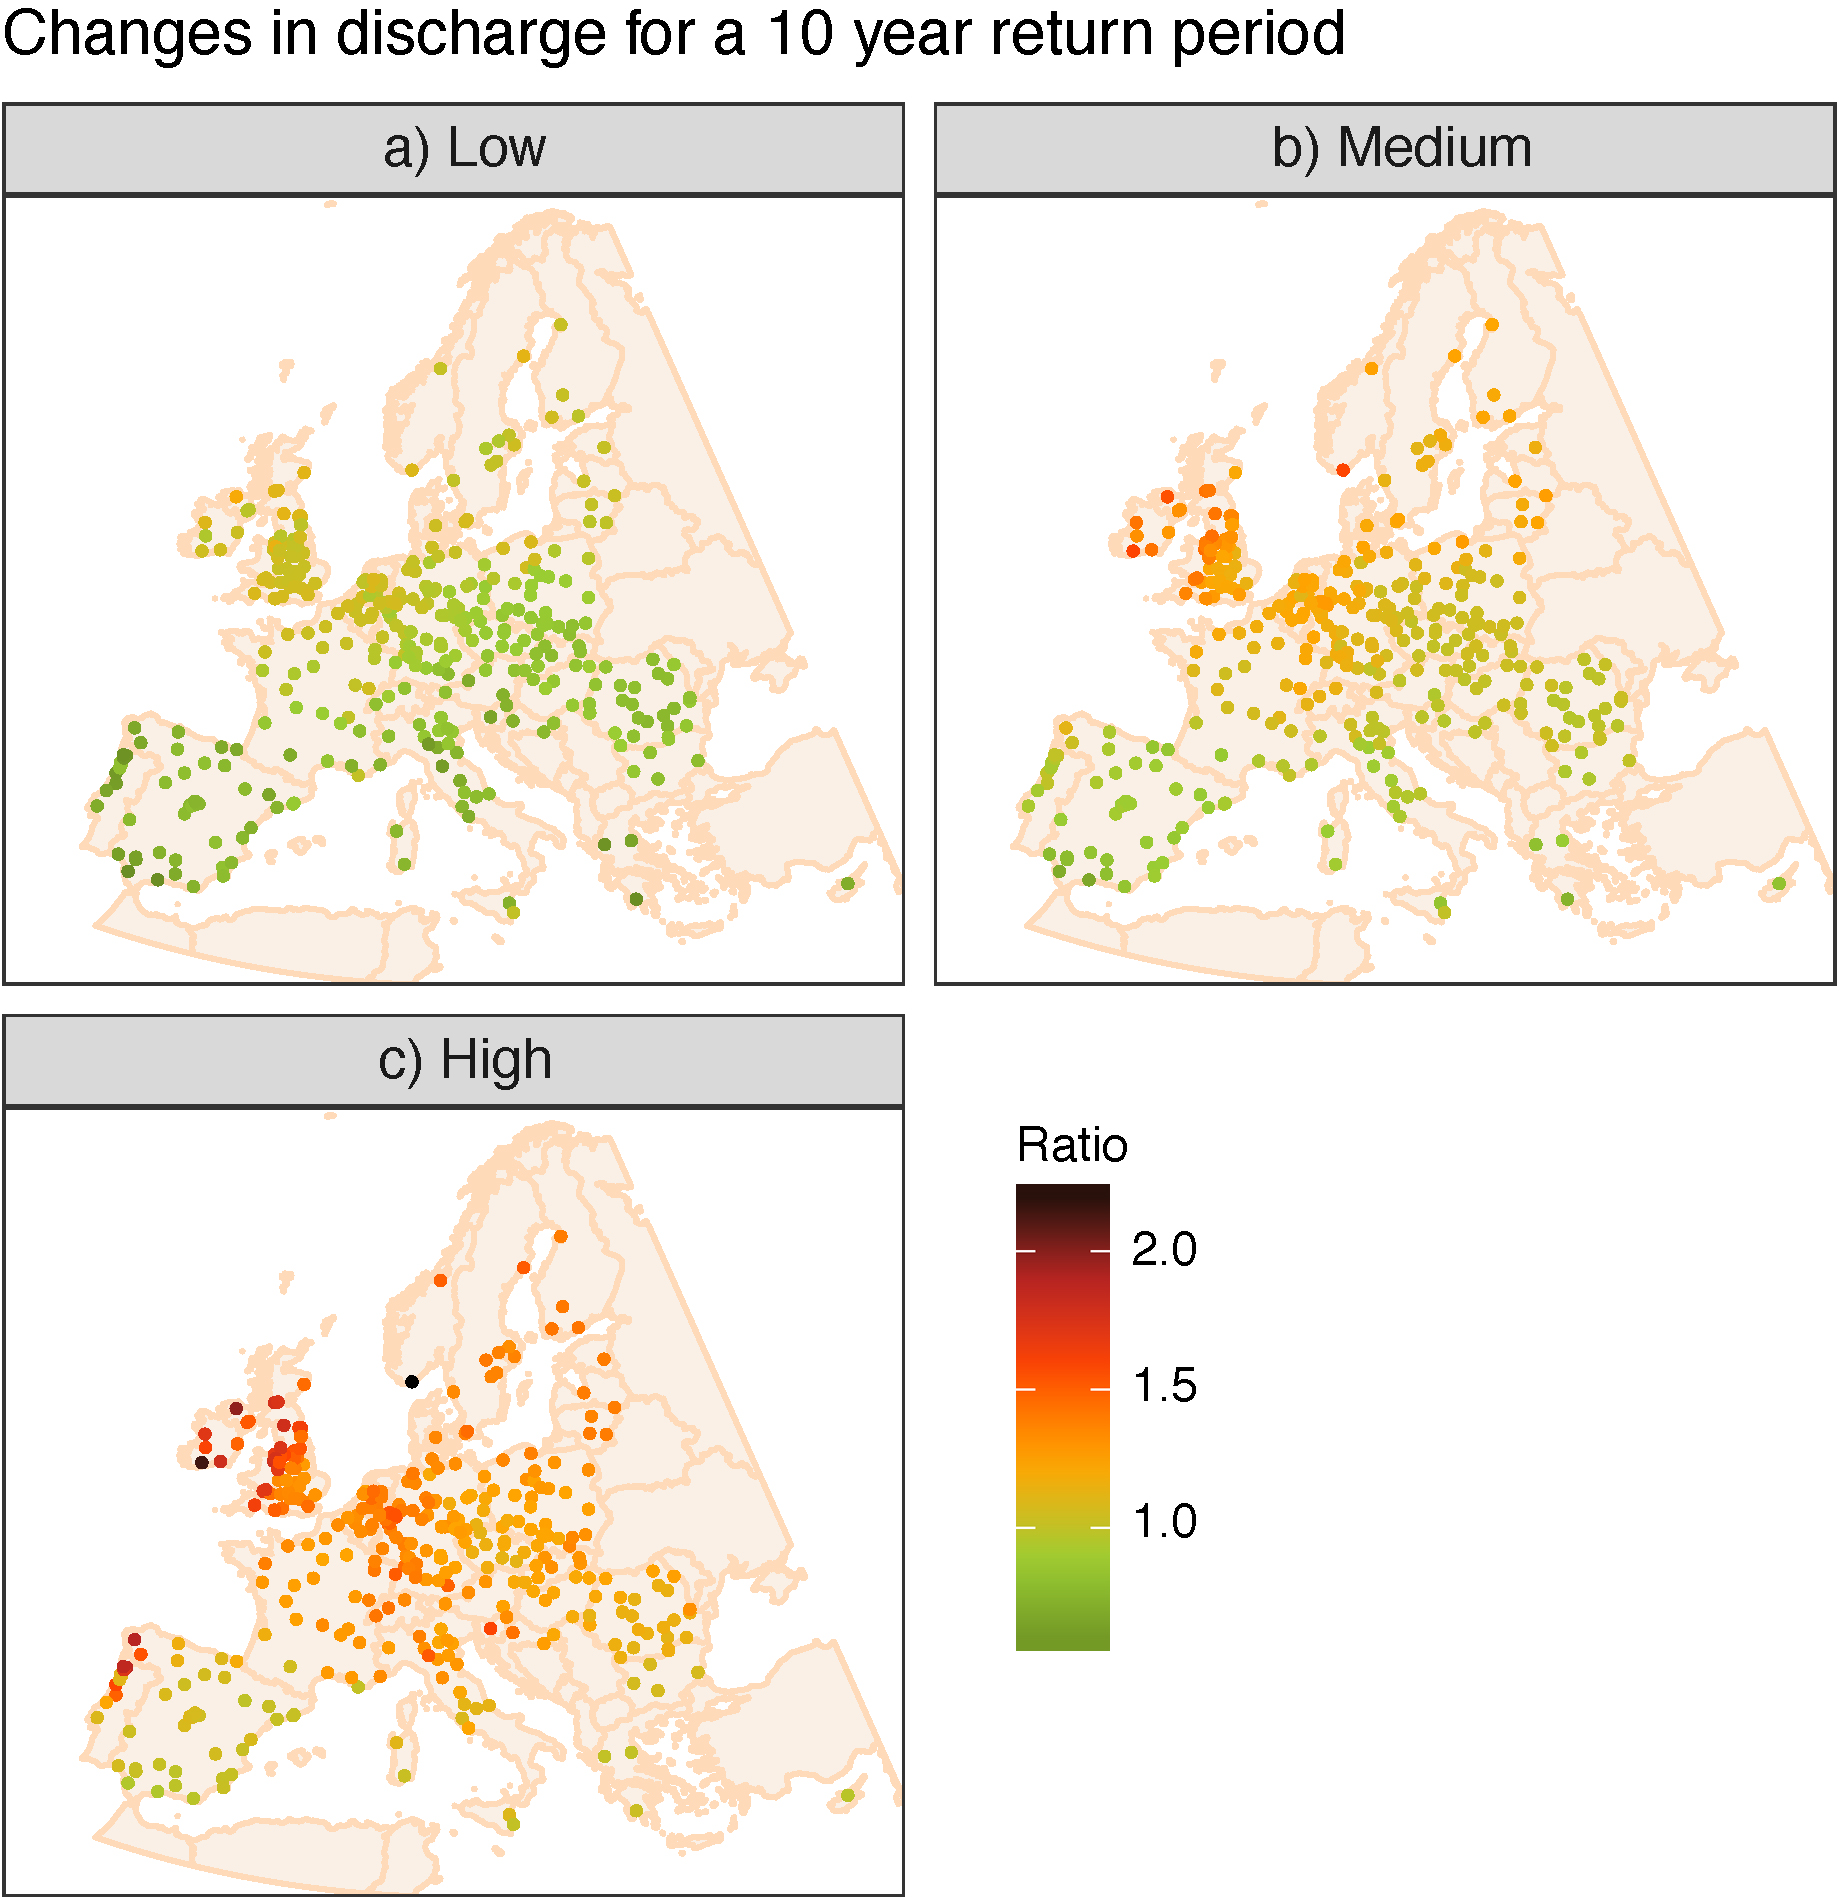
Figure 3. Changes in Q10 ratio (future Q10 divided by historical Q10) for each European city with a river basin above 500 km2. The changes are shown for (a) low (10th percentile) impact scenario, (b) medium (50th percentile) impact scenario and (c) high (90th percentile) impact scenario. The changes are calculated between the historical period (1951–2000) and the future period (2051–2100).
Download figure:
Standard image High-resolution image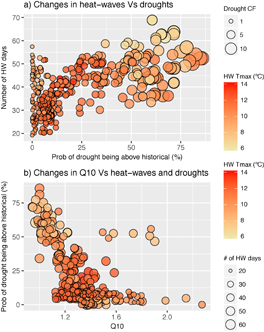
Figure 4. (a) Changes in number of heat-wave days vs changes in probability for any given month in the future being above the historical maximum, size shows maximum DSI-12 change factor and colour shows changes in maximum daily maximum temperature for days classified as heat-wave days. (b) Changes in Q10 ratio vs probability for any given month in the future being above the historical maximum, size shows changes in number of heat-wave days and colour shows changes in maximum daily maximum temperature for days classified as heat-wave days. Changes are calculated between the historical period (1951–2000) and the future period (2051–2100) for the high-impact scenario for each city. Smaller circles are plotted on top.
Download figure:
Standard image High-resolution image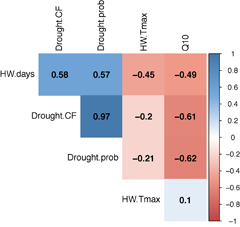
Figure 5. Correlation matrix showing the Spearman correlation coefficients between changes in: number of heat-wave days (HW.d), maximum DSI-12 change factor (Drought.CF), changes in probability for any given month in the future being above the historical maximum DSI-12 (Drought.prob), maximum daily maximum temperature for days classified as heat-waves days (HW.Tmax) and Q10 ratio (Q10).
Download figure:
Standard image High-resolution image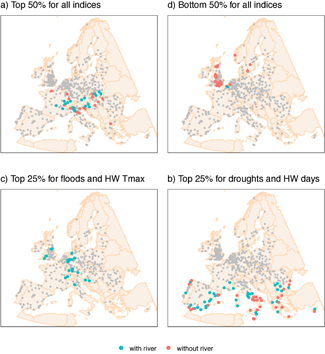
Figure 6. (a) Cities whose changes are in the top 50% for all indices (i.e. changes in number of heat-wave days, changes in maximum daily maximum temperature for days classified as heat-waves days, changes in probability for any given month in the future being above the historical maximum DSI-12, maximum DSI-12 change factor and, for the cities with rivers, changes in Q10 ratio). (b) Cities whose changes are on the bottom 50% for all indices. (c) Cities whose changes in both flooding and maximum temperature during a heat-wave indices are in the top 25%. (d) As (c) but for both drought indices and changes in number of heat-wave days. Changes are calculated between the historical period (1951–2000) and the future period (2051–2100) for the high-impact scenario. Flood risk was analysed if the maximum flow accumulation cell within the city corresponded to a catchment area of at least 500 km2 (i.e. city 'with river').
Download figure:
Standard image High-resolution image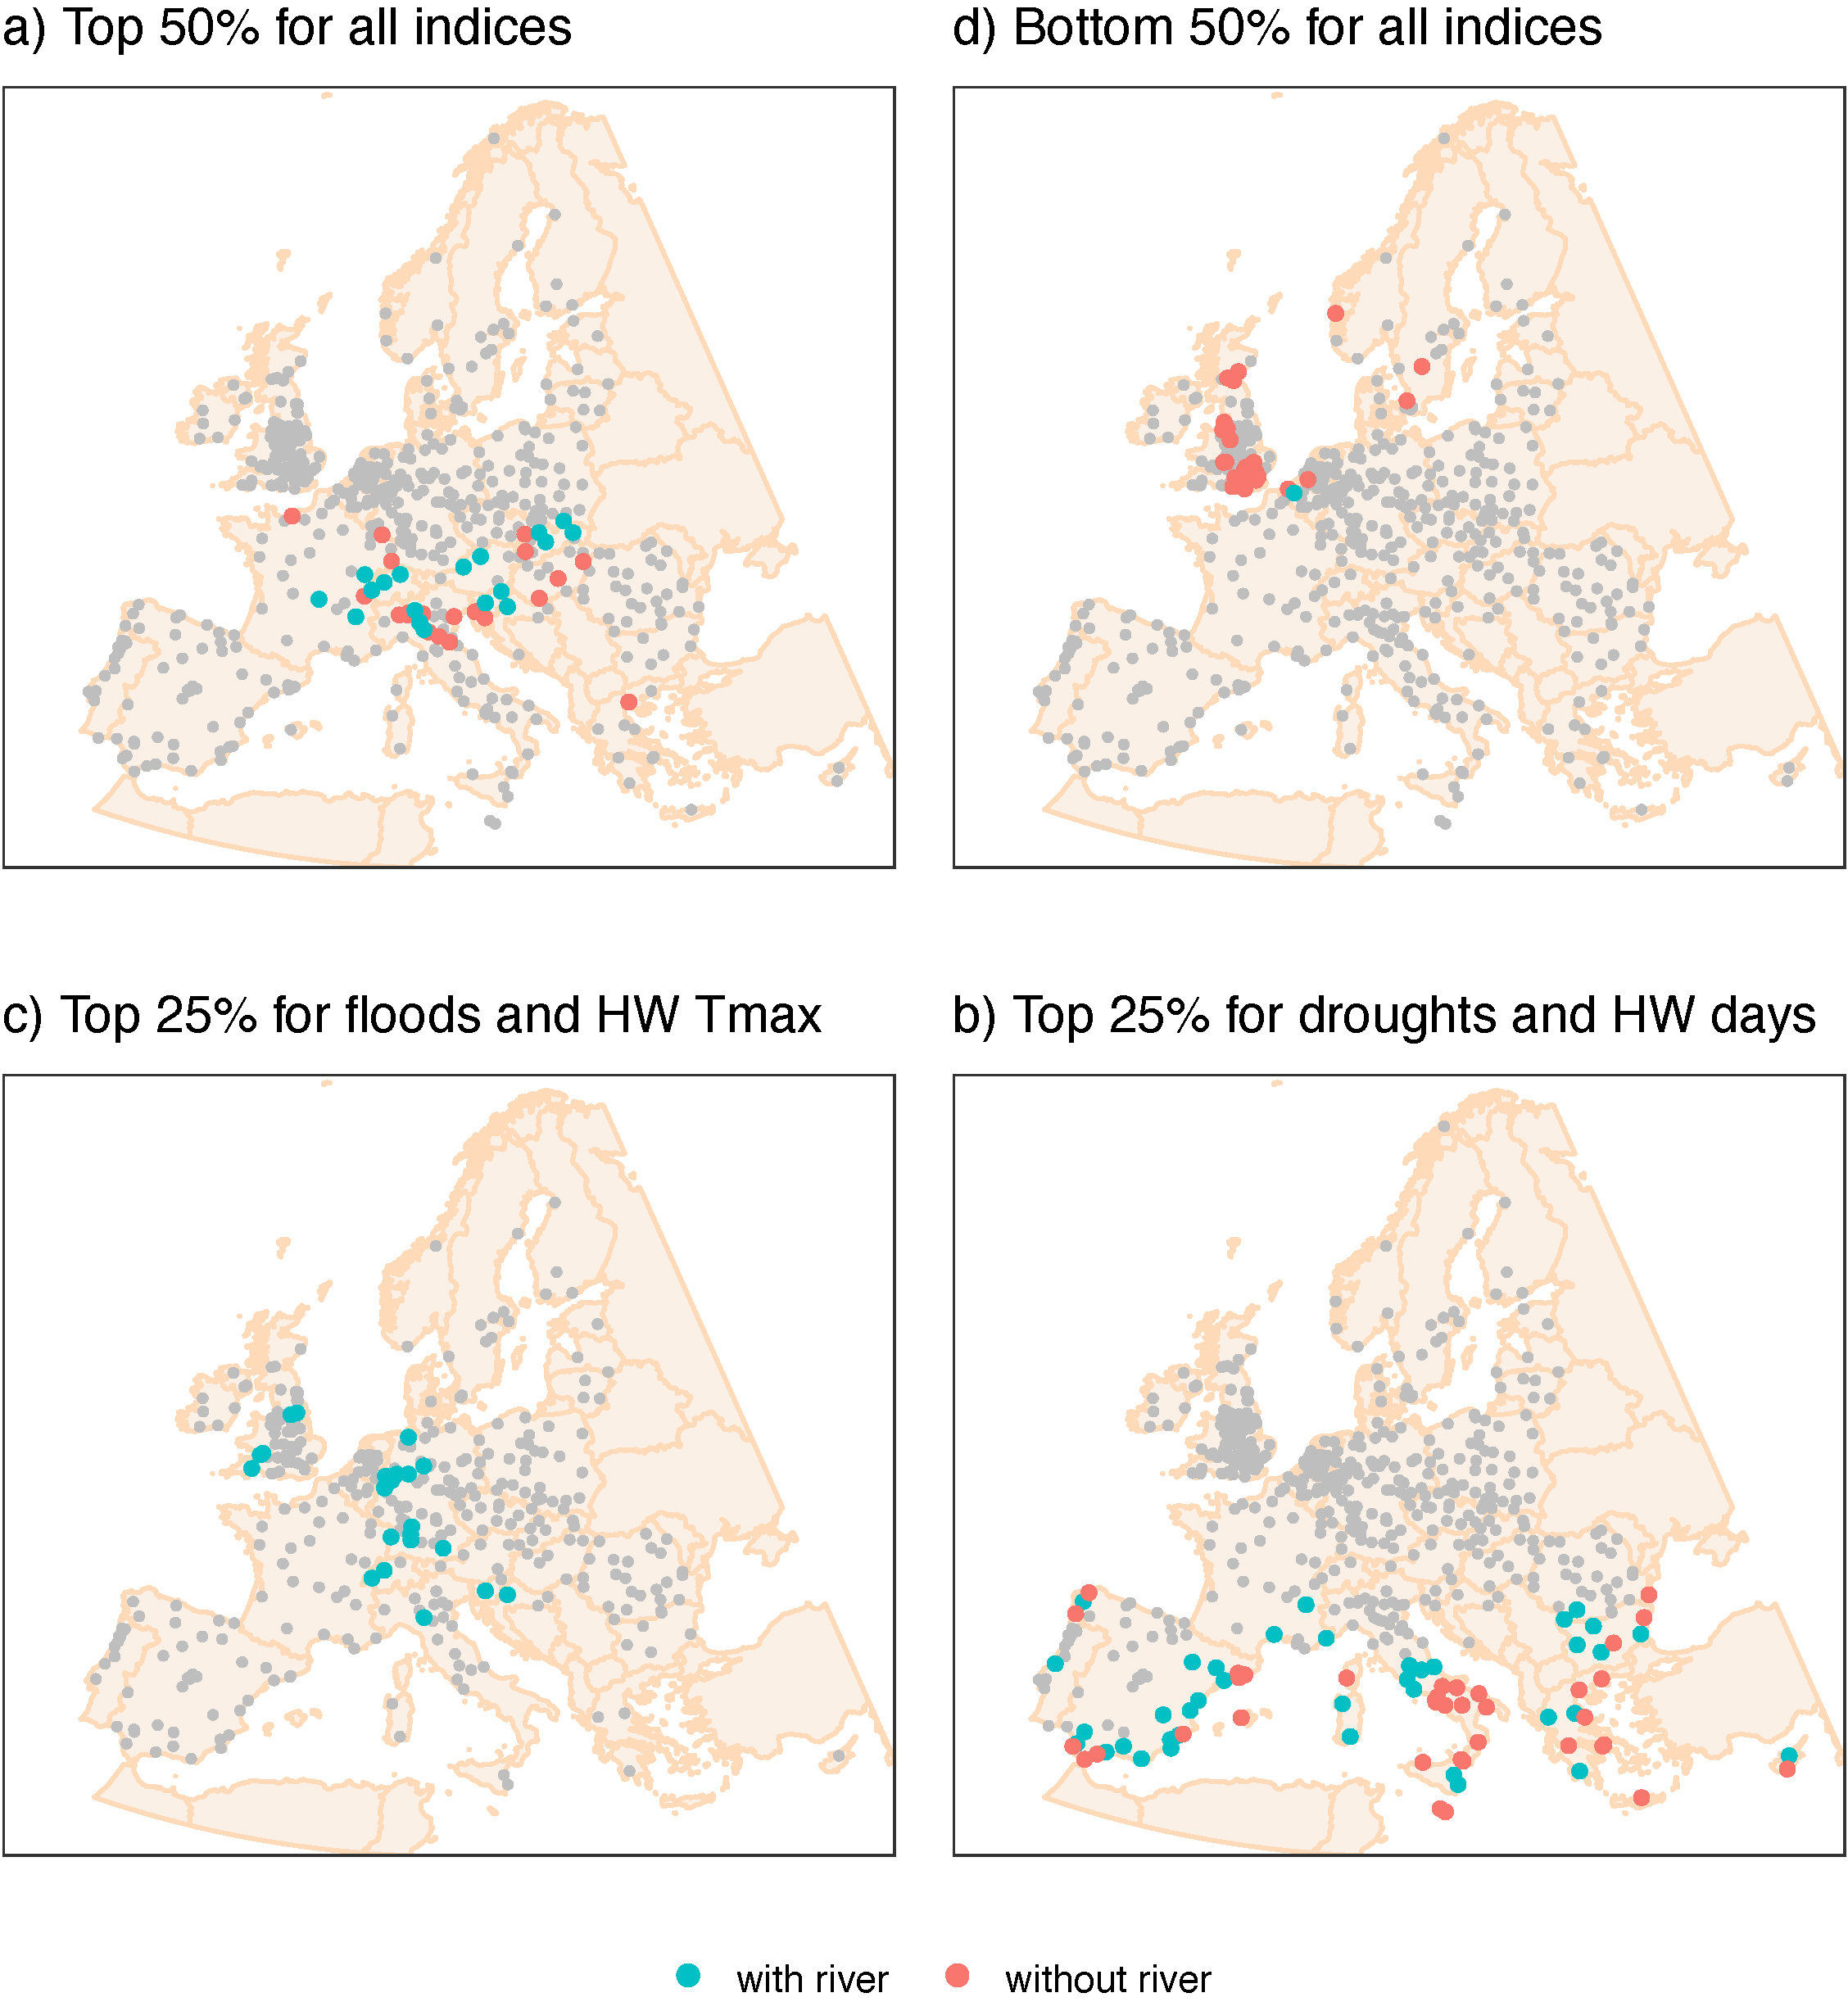
The changes in HWTmax (figure 1(b)), range from 1.5 °C in Helsinki (Finland) under the low scenario, to as much as 14 °C in Innsbruck (Austria) under the high scenario. For this scenario, 72% of European cities (411 out of 571), are projected to experience an increase in HWTmax of at least 10 °C. Fischer and Schär (2010) also found a dichotomy between larger increases in number of HW in the south of Europe but stronger HWTmax increases in south-central Europe (around 45°N) of up to 7 K (2071–2100 relative to 1961–1990) due to higher increases in mean temperatures in the south of Europe but higher increases in variability further north.
Drought conditions are expected to intensify in southern European cities under all impact scenarios considered, while in mid and northern latitudes the projections are scenario-dependent. Drought was assessed using the 12 month time-scale Drought Severity Index (DSI-12). Figure 2(b) shows the probability of any month exceeding the historical (1951–2000) maximum DSI-12 (HMD). For the high impact scenario, 21 cities in Southern Europe have more than 70% probability that the HMD will be exceeded in any given month, and may experience droughts up to 14 times worse than the worst drought in the historical period (figure 2(b)). Even in the low impact scenario, cities in the South of Iberia such as Malaga and Almeria may experience droughts more than twice as bad as in the historical period. For other cities, the change is dependent upon the scenario. For the low impact scenario, the likelihood of droughts worse than the ones in the historical period (i.e. DSI-12 above HMD) is null for mid and northern latitude cities, and for the medium scenario it is null only for northern latitude cities. However, for the high impact scenario, only 2% of cities are not projected to exceed the HMD. Moreover, 30% of cities are projected to have at least a 30% probability of exceeding the historical maximum in any given month. Increased drought risk to southern Europe is well documented (IPCC 2013, Forzieri et al 2014), but studies that report increased risk of droughts to northern latitude have not been found in the literature.
Changes in river flooding, assessed by the 10 year high flow (Q10), show a strong north-south divide with the British Isles seeing the worst projections. For the low impact scenario 68% of cities on a river (i.e. cities whose urban area has an upstream river basin with more than 500 km2) show either no change or a reduction in Q10, with increases in Q10 of up to 20%, mainly in cities in the UK, Belgium, Netherlands and Scandinavian countries (see figure 3). In the UK, 85% of cities see a projected increase in Q10.
The medium impact scenario reveals 264 cities (72%) projected to experience an increase in Q10, and in Cork (Ireland), Kristiansand (Norway) and Derry/Londonderry (UK) the increase could be more than 50%. However, most cities in the south of Europe experience no change or a decrease.
For the high impact scenarios, only 9 cities are not expected to see increases in Q10 (most of them in Spain, but also Lefkosia–Cypress, Toulon–France and Siracusa–Italy). The areas with higher increases are the British Isles, Norway and northern Iberia. Half of the UK cities see increases above 50% and several European cities see increases above 80% (Santiago de Compostela in Spain, Cork and Waterford in Ireland, Kristiansand in Norway, Braga and Barcelos in Portugal and Derry/Londonderry in the UK). Norwegian cities (Trondheim and Kristiansand) show increases in all scenarios and a large increase in the high impact scenario (50% and 127% respectively). However, as snowpack and melting processes are not accounted for in our methodology this may not translate into the same change in observed Q10.
Previous studies show large areas of Europe where there is no agreement in the direction of change of future floods (Dankers and Feyen 2009, Rojas et al 2012, Alfieri et al 2015, Roudier et al 2016). Dankers and Feyen (2009) identified natural variability/internal variability in the climate models as the major cause of discrepancy of future changes in Q100 calculated using 30 year intervals. To minimise these uncertainties, we use a 50 year analysis interval, which is less sensitive to decadal changes, a lower return period for flood calculations (Q10 instead of Q100) and a much wider range of possible futures.
To understand if cities are at risk from more than one hazard it is important to look at how the changes in different indices are related. This is shown visually in figure 4 and quantified using the Spearman correlation coefficient (figure 5) for the high impact scenario. As described above, the cities that show larger increases in the occurrence of droughts also show the larger increases in the magnitude of drought (Spearman correlation coefficient of 0.97). For the two HW indices, the correlation is negative and low (−0.44) since, as can be seen in figure 1, they have a different spatial pattern (i.e. larger increases in number of HW in cities in the south of Europe but stronger HWTmax increases in cities in south-central Europe). More importantly, changes in the number of HW days and changes in magnitude and occurrence of droughts are correlated (0.58 and 0.57 respectively), meaning several cities will have to deal with more HW days and more and stronger droughts. The Italian cities of Bologna, Cremona, Modena and Reggio nell'Emilia are in the top 30% for changes in all drought and HW indices meaning a high probability of increased number and magnitude of HW and droughts. There are 79 cities in the top 25% of both drought indices and HW days (figure 6). From those, Athina, Patra, Irakleio, Kalamata and D. Peiraios in Greece, Siracusa (Italy) and Valletta and Gozo in Malta are in the top 5%.
There is a negative correlation between changes in flooding (Q10) and both drought indices (−0.61, −0.62) and with the number of HW days (−0.49) but not with HWTmax (0.10). There are 28 cities in the top 25% of changes in both flooding and HWTmax indices (figure 6). From those, Ljubljana (Slovenia) and Leeds, Cardiff, Exeter and Newport in the UK are in the top 20%.
The Spanish cities of Santiago de Compostela and Ourense, the Italian city of Parma and four Portuguese cities (Braga, Aveiro, Vila Nova de Famalicão and Barcelos) show an anomalous behaviour (figure 4(b)) of both high probability of unprecedented drought (>32%) and of increases in river flooding (Q10 change factor > 1.5). They also have strong increases in magnitude of droughts with change factors above 3.3 (not shown in the figure).
Capital cities are among the top 100 for one or more hazards in the high scenario: Dublin, Helsinki, Riga, Vilnius, Zagreb for Q10; Stockholm and Roma (Rome) for HW days; Praha (Prague) and Wien (Vienna) for HWTmax. Lisboa (Lisbon) and Madrid are in the Top 100 for both drought indices, while Athina (Athens), Lefkosia (Nicosia), Valleta and Sofia rank in the Top 100 for HW days and both drought indices. There are also 18 European cities that are in the top 50% for changes in all (5) indices for the high impact scenario (figure 6(a)). The top 10 cities for each index for the high impact scenario are presented in table S.1 in supplementary information. Correlations (and anti-correlations) between indices are stronger for the Medium and Low impact scenarios (around 0.7 between HW days and drought indices). The full result set is reported in table S.2.
Conclusion
We have analysed 50 climate model projections from the CMIP5 (RCP8.5) ensemble and calculated consistent and comparable metrics of climate impacts for HW, droughts and flooding for 571 European cities. More frequent and hotter HW are expected for all European cities. Southern cities see the largest increase in the number of HW days (as much as 69%). On the other hand, central European cities, where both infrastructure and populace are generally not adapted to extreme heat, see the largest HWTmax increases (up to 14 °C, far above estimates from other studies). Southern European cities will also see an increase in drought conditions in all scenarios and a fundamentally different climate in the high impact scenario with future droughts up to 14 times worse than the ones in the historical period. Although this region is to a certain extent adapted to drought, the level of change projected in the Medium and High impact scenarios is likely to be beyond breaking point in many cases, which supports recent analysis of the potential for a megadrought in major Iberian water resource regions (Guerreiro et al 2017a, Guerreiro et al 2017b). Increases in river flooding, most prevalent in NW Europe, are particularly worrying for the British Isles and several other European cities which could observe more than a 50% increase of their 10 year high river flow.
The work presented here on hazards is a necessary contribution to the next steps of assessing overall future risk, and then designing appropriate adaptation. For the next step we plan to combine this hazard information with a pan-European assessment of urban vulnerability (Tapia et al 2017) and exposure to assess future overall climate risks in European cities. Our analysis does not preclude the need for detailed climate change impact assessment for each city but it provides comparable information for different impacts and cities that can be used to prioritise national and European adaptation investments, and guide more detailed adaptation studies.
Analysis of the full CMIP5 (RCP8.5) ensemble allowed an exploration of uncertainties both from climate models errors and simulated natural variability. This has revealed impact projections that exceed ranges currently reported in the literature. Consideration of these uncertainties is a prerequisite to the development of adaptation strategies that are robust to a wide range of possible climate futures. The implications for adaptation are far-reaching and vary across Europe and within individual nations.
A suitable framework for assessing the benefits of future adaptation, for the flood component of risk, has been proposed by Ward et al (2017). However, adaptation of cities for heat-waves presents a major challenge in design, and even more so to quantify benefits and costs. In Southern Europe, adapting to some of the projected changes could only be achieved by a fundamental, and expensive, re-engineering of each city or water resource system, as significant adaptation to climate extremes has already been implemented and radical changes will be needed to achieve more. By contrast, in Central Europe, although major, disruptive changes in hydro-climate are expected, there should be capacity and economic resource to support adaptation (Tapia et al 2017).
Acknowledgments
This research has received funding from the European Union's Seventh Framework Programme for Research, Technological Development and Demonstration under Grant Agreement No. 308497 (Project RAMSES). We are grateful to representatives of a large number of European cities who attended the RAMSES Stakeholder Dialogue meetings to advise on the climate impact metrics of interest to cities. We acknowledge the E-OBS dataset from the EU-FP6 project ENSEMBLES (http://ensembles-eu.metoffice.com) and the data providers in the ECA&D project (www.ecad.eu) and the World Climate Research Programme's Working Group on Coupled Modelling, which is responsible for CMIP, and thank the climate modelling groups for producing and making available their model output.