

Abstract
Heat waves (HWs) are among the most damaging climate extremes to human society. Climate models consistently project that HW frequency, severity, and duration will increase markedly over this century. For urban residents, the urban heat island (UHI) effect further exacerbates the heat stress resulting from HWs. Here we use a climate model to investigate the interactions between the UHI and HWs in 50 cities in the United States under current climate and future warming scenarios. We examine UHI2m (defined as urban-rural difference in 2m-height air temperature) and UHIs (defined as urban-rural difference in radiative surface temperature). Our results show significant sensitivity of the interaction between UHI and HWs to local background climate and warming scenarios. Sensitivity also differs between daytime and nighttime. During daytime, cities in the temperate climate region show significant synergistic effects between UHI and HWs in current climate, with an average of 0.4 K higher UHI2m or 2.8 K higher UHIs during HWs than during normal days. These synergistic effects, however, diminish in future warmer climates. In contrast, the daytime synergistic effects for cities in dry regions are insignificant in the current climate, but emerge in future climates. At night, the synergistic effects are similar across climate regions in the current climate, and are stronger in future climate scenarios. We use a biophysical factorization method to disentangle the mechanisms behind the interactions between UHI and HWs that explain the spatial-temporal patterns of the interactions. Results show that the difference in the increase of urban versus rural evaporation and enhanced anthropogenic heat emissions (air conditioning energy use) during HWs are key contributors to the synergistic effects during daytime. The contrast in water availability between urban and rural land plays an important role in determining the contribution of evaporation. At night, the enhanced release of stored and anthropogenic heat during HWs are the primary contributors to the synergistic effects.
Export citation and abstract BibTeX RIS

Original content from this work may be used under the terms of the Creative Commons Attribution 3.0 licence.
Any further distribution of this work must maintain attribution to the author(s) and the title of the work, journal citation and DOI.
1. Introduction
Among the many damaging environmental extremes, including hurricanes, floods, and tornados, heat waves (HWs) are the deadliest in the United States (Klinenberg 2015). Assuming no acclimatization and adaptation, extreme heat stress in a changing climate has the potential to cause a substantial increase in human mortality (Anderson and Bell 2011, Huang et al 2011, Patz et al 2005), morbidity (McGeehin and Mirabelli 2001), energy demand (Isaac and van Vuuren 2009, Sailor and Pavlova 2003), and perhaps civil conflicts (Burke et al 2009, Hsiang et al 2011). Higher temperatures are also projected to result in a large reduction in agricultural yield (Lobell et al 2011) and livestock production (Battisti and Naylor 2009, Fuquay 1981). In recognition of these concerns, better understanding is needed of the risks of future heatwaves including physical mechanisms, temporal structure (Horton et al 2015, Oleson et al 2015b, Seneviratne et al 2006), and potential adaptation and mitigation strategies to better manage changing risks over time (Georgescu et al 2014, Rosenzweig et al 2009).
Global climate models agree on the projection of increasing frequency and severity of HWs over this century (Barriopedro et al 2011, Horton et al 2016, Sillmann et al 2013). The Fifth Assessment Report of the Intergovernmental Panel on Climate Change concluded it is 'very likely' that HWs will occur more often and last longer due to climate change (Pachauri et al 2014). Future HWs will become more intense, more frequent and longer lasting in North America in the second half of the 21st century (Gutowski et al 2008, Meehl and Tebaldi 2004, Meehl et al 2009, Orlowsky and Seneviratne 2012).
More than 50% of the world's population are now urban residents, and this number is expected to increase to 70% by the year 2050 (Heilig 2012). The risks of heatwaves are amplified by urban heat islands (UHI) (Patz et al 2005, Tan et al 2010)—a phenomenon of higher temperatures in urban areas than in surrounding rural areas. Its intensity is usually defined as urban-rural difference in 2m-height air temperature (UHI2m) or in radiative surface temperature (UHIs).
Modeling and observational studies have demonstrated a synergistic effect between UHI and HWs (Li and Bou-Zeid 2013, Li et al 2015, Ramamurthy and Bou-Zeid 2017, Ramamurthy et al 2017). The computational demand of mesoscale weather forecast modeling and the length and sparsity of observations limit these studies to one high-impact event or a few HWs over a limited period over a single city or a metropolitan area. Whether this synergistic effect holds for other cities and endures in a future warming climate are important yet unresolved questions. Previous studies using global climate models have either been limited to grid cell-average HWs (Coumou and Robinson 2013, Diffenbaugh and Ashfaq 2010, Fischer et al 2013, Gao et al 2012) or focused on the urban HWs in general rather than their synergistic effects with UHIs (Oleson et al 2015a). Neither observations nor numerical simulations have directly demonstrated UHI—HW interactions at the continental scale. Zhao et al (2014) demonstrates a strong interaction between local background climate and UHI in the humid eastern United States, where the UHI is higher in drier and hotter years. This analysis motivates our examination of the synergistic effects between UHI and HWs at a large geographic scale across a range of climate conditions.
In this study, we use a sub-grid Earth system modeling strategy to investigate the spatial pattern of UHI—HW interactions. Earth system models (ESMs) are not constrained by a high computational burden, and thus can be applied over climatological timescales. In addition, ESMs capture the interactions between urban effects and the large-scale dynamics of the atmosphere. More importantly, ESMs can simulate the interactions between future greenhouse gas (GHG) warming scenarios and the biophysical drivers of UHI. These advantages of ESMs make them useful for the study of geographic patterns of the UHI—HW interactions across distinct climate regions and climate scenarios, despite their limited ability to capture some unresolved physical processes and reliance on parameterizations.
Our specific objectives include: (1) examining geospatial patterns of the synergistic interactions between UHI and HWs for cities in three climate regions in the United States under current and future climate scenarios; (2) investigating the biophysical drivers of these interactions under distinct climate regimes and different climate scenarios.

Figure 1. Map of selected cities in the United States. Blue: cities in the Köppen–Geiger temperate climate region; green: cities in the Köppen–Geiger continental region; red: cities in the Köppen–Geiger dry climate region.
Download figure:
Standard image High-resolution image2. Methods
2.1. Model simulation
We used the Community Earth System Model (CESM) (Hurrell et al 2013) to simulate UHIs for 50 selected cities in the United States. We conducted simulations for present-day climate conditions (1972–2004) and two future Representative Concentration Pathway (RCP) scenarios (RCP 4.5 and 8.5 for 2005–2100) at a horizontal resolution of 0.9o latitude × 1.25o longitude. Please see the supplementary information for more details on the model simulations.
2.2. UHI analysis
We used thirty years of modeled outputs in the current-climate run (1975−2004) and two RCP runs (2071−2100) to represent the present-day and future climatology, respectively, and to analyze UHI intensity. Because the focus of this study is HWs, we restrict our analysis to summer months (June−August). We use hourly outputs at 13:00−15:00 (around midday) and 01:00−03:00 (around midnight) local time to represent daytime and nighttime conditions, respectively. These two sets of times were selected for two reasons. First, they are relatively close to the times of daily maximum and minimum temperature for most of the cities, giving a better representation of the diurnal range of the UHI. Second, the performance of the CLM and the biophysical factorization method (described in the next section) was validated against MODIS observations around these two times (close to the MODIS-Aqua overpassing times) in Zhao et al (2014). We selected 50 cities in the United States (figure 1) representing three Köppen–Geiger climate zones: temperate climate (21 cities, eastern and southern US), continental climate (14 cities; northeastern US) and dry climate (15 cities; arid and semiarid western US). We focus on temperate and dry regions to draw out the humidity contrasts between these two distinct zones. We also selected cities in the continental climate because they experience deadly heat as well, despite residing in an annual average colder climate (Semenza et al 1996, Whitman et al 1997, Houser et al 2015).
We computed UHI2m (ΔT2m) and UHIs (ΔTs) from the variables generated by the urban and rural sub-grids in the grid cells where our selected cities are located (please see the supplementary information for more details). Although the UHI2m and UHIs differ in various aspects and their magnitudes are not directly comparable (Arnfield 2003), the two UHIs show consistency in terms of the linear supposition property of their biophysical contributions (Zhao et al 2017). One merit of UHIs compared to UHI2m is that the former has a firm and yet simple theoretical basis derived from the surface energy balance principle that underpins the biophysical factorization (described in the next section). In this study, we use this biophysical factorization method to disentangle the mechanism underlying the UHI–HW interactions.
There are multiple ways to define HWs (Perkins 2015, Perkins and Alexander 2013, Robinson 2001, Smith et al 2013). We use the definition from the US National Weather Service (NWS): three or more consecutive days of maximum temperature reaching at least 90 °F (32.2 °C). We consider that, in each grid cell (a size on the order of 100 × 100 km), its rural sub-grid represents a local background environment for the city. Therefore, for each city we use its rural 2m-height temperature (T2m,rural) to define HWs. This is consistent with weather station observations, as weather stations are mostly located in an open landscape (World Meteorological Organization standard) similar to a rural environment. Using this definition, we divided the 30 years of daily data in each run into two groups: (i) for each city, all sets of three or more consecutive days of modeled midday T2m,rural larger than 32.2 °C were defined as HW days, and their UHI intensities were denoted as UHIHW, while (ii) the remaining days were considered as normal days and hence their UHIs were denoted as UHINM.
To ensure the robustness of our analysis to the variations in HW definition, we examine two additional HW definitions (chosen arbitrarily to some extent), one absolute and one relative. The relative definition uses a relative threshold for each city to define HWs (denoted as Def-95Q) rather than a fixed number. Specifically, based on the histogram of summer daily T2m,rural for each grid cell in each simulation, we define all days whose T2m,rural are larger than the 95th percentile as HW days. The absolute one relaxes the minimum number of consecutive days of high temperature (90 °F) to two days (denoted as Def-2Day). We repeated our analysis for these two HW definitions to check the consistency of patterns identified in the main analysis.
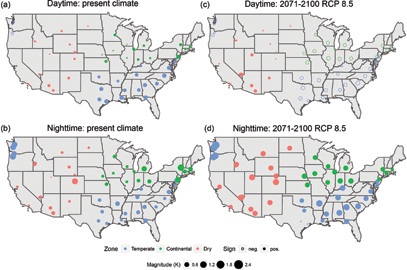
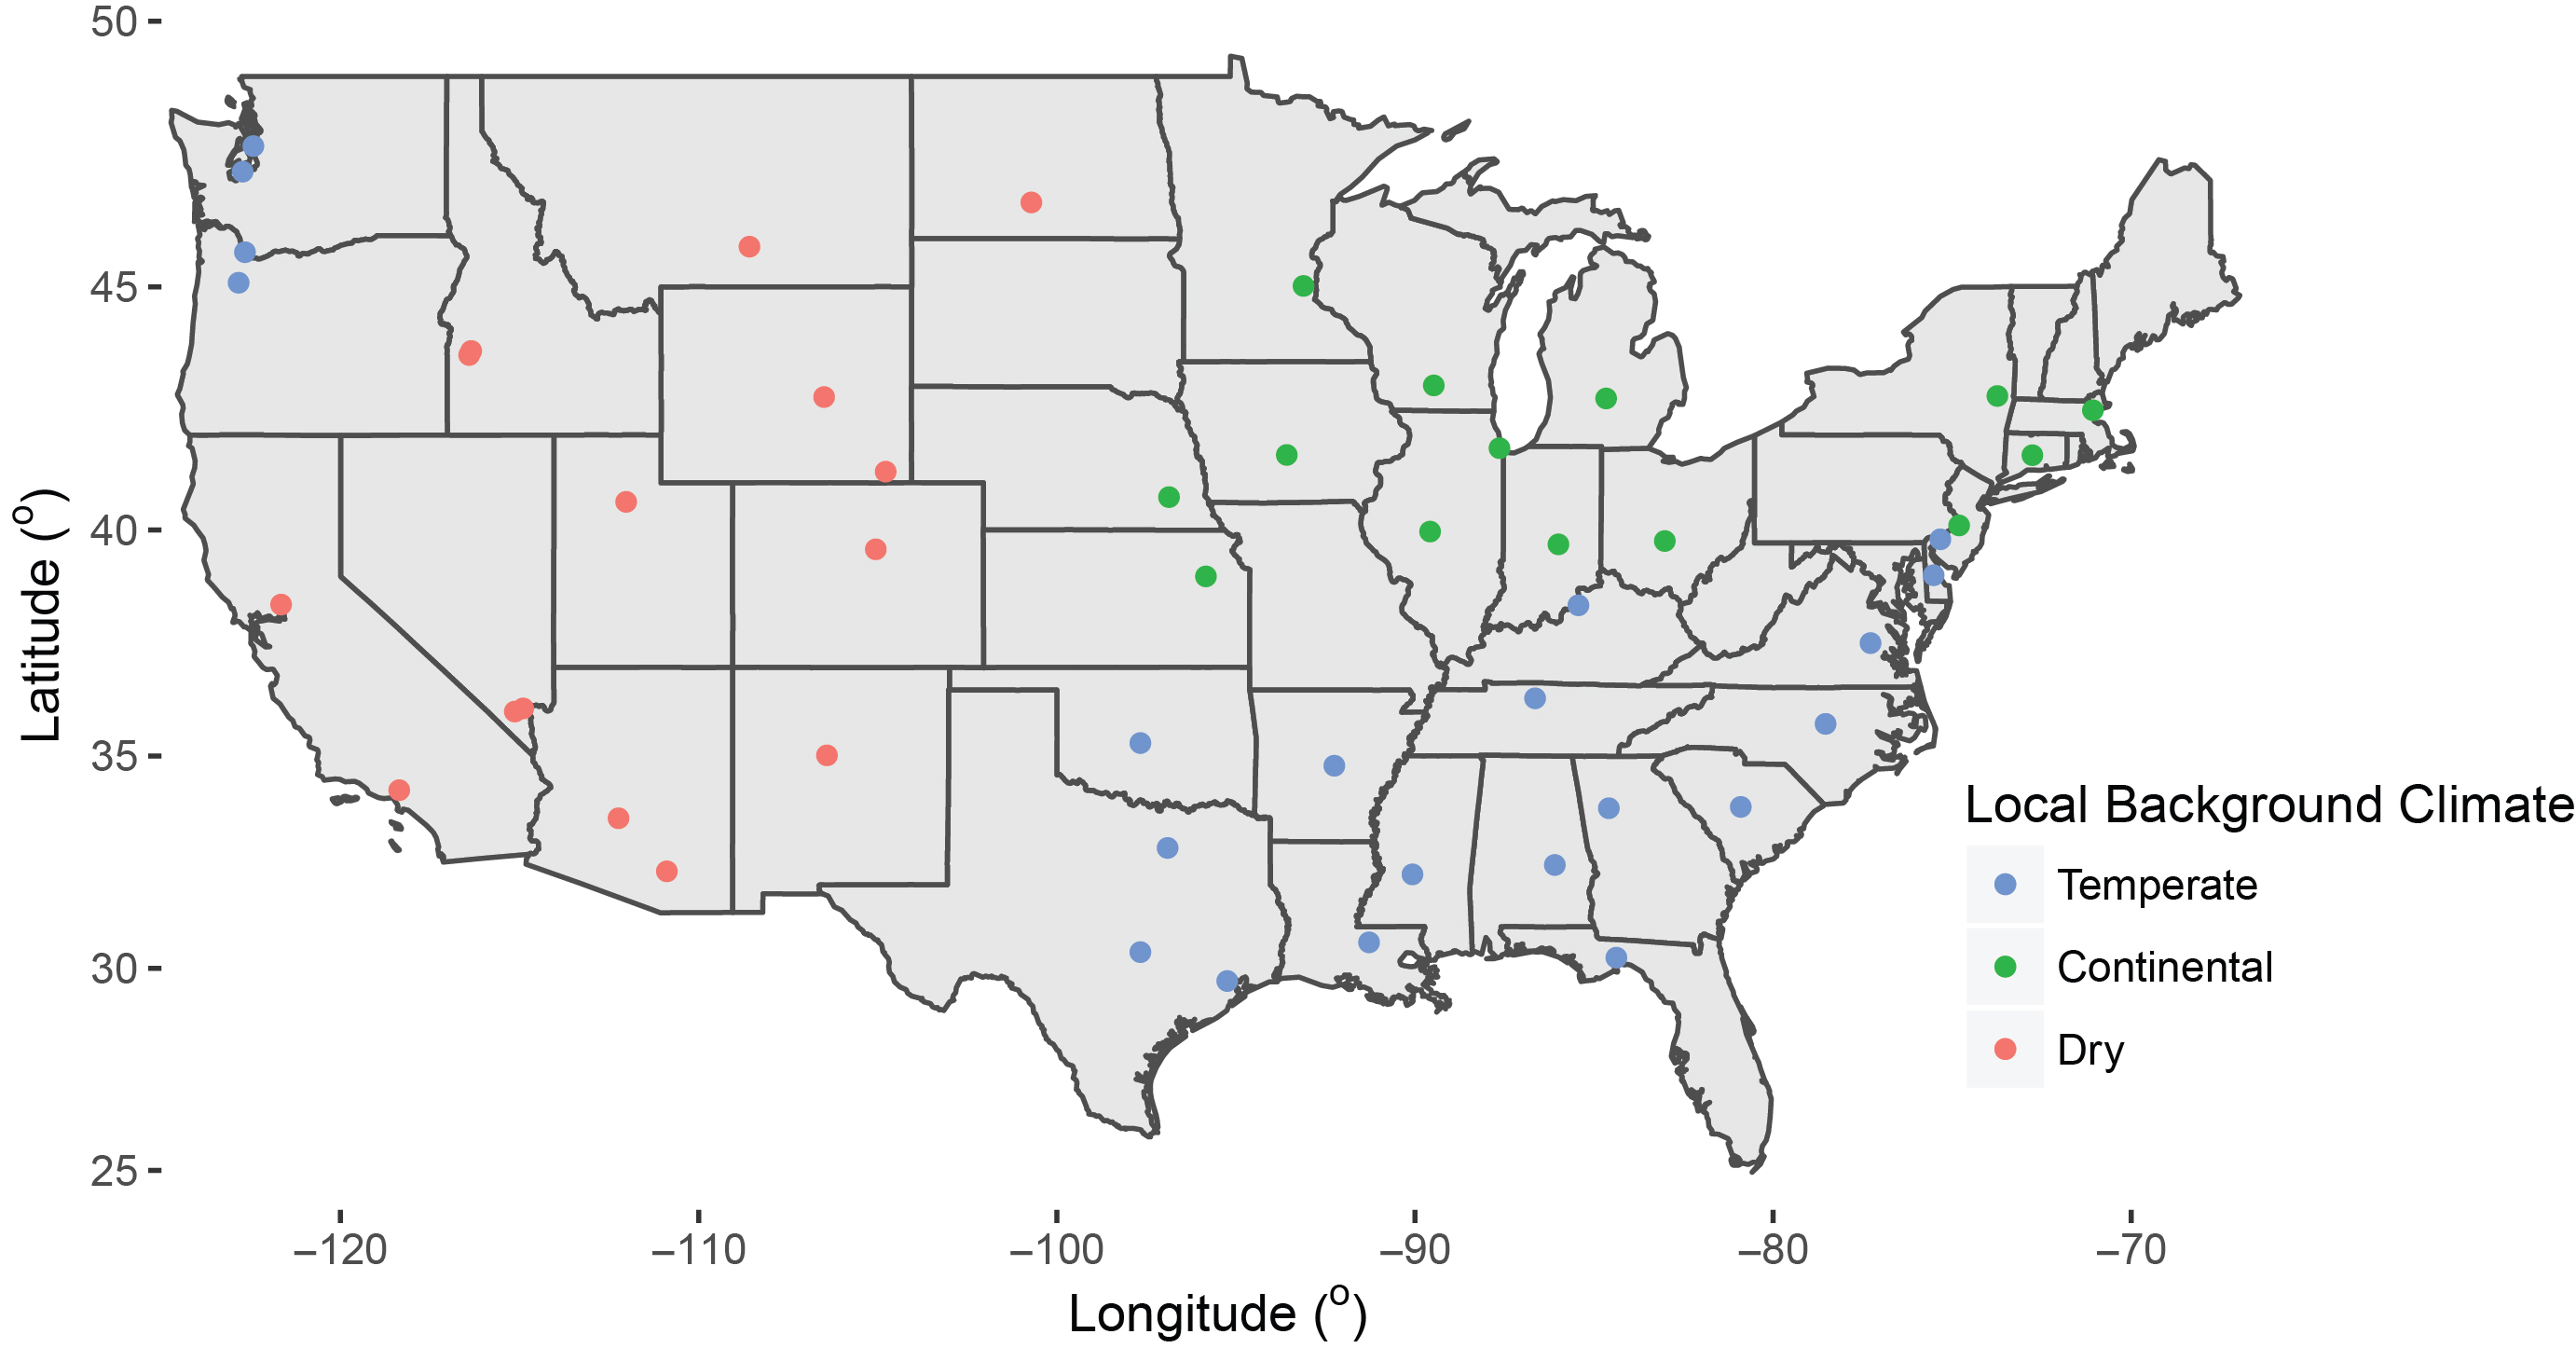
Figure 2. Maps of mean differences between UHI2m, HW and UHI2m, NM (UHI2m, HW–UHI2m, NM) during 1975−2004 and 2071−2100 under RCP 8.5 scenario for all selected cities. (a), (b): current climate (1975−2004); (c), (d): 2071−2100 RCP 8.5. (a), (c): daytime; (b), (d): nighttime. Blue, green and red symbols denote cities in the temperate, continental and dry climate zones, respectively. Solid and open symbols denote positive and negative values, respectively.
Download figure:
Standard image High-resolution imageTable 1. The mean differences between UHIHW and UHINM (UHIHW–UHINM) for the selected cities in the three climate zones in current climate (1975−2004) and future RCP 8.5 scenario (2071−2100). (Units: K)
| Def-NWS | Def-95Q | Def-2Day | ||||||||||
|---|---|---|---|---|---|---|---|---|---|---|---|---|
| Diff in UHI2m | Diff in UHIs | Diff in UHI2m | Diff in UHIs | Diff in UHI2m | Diff in UHIs | |||||||
| Current | RCP85 | Current | RCP85 | Current | RCP85 | Current | RCP85 | Current | RCP85 | Current | RCP85 | |
| Daytime | ||||||||||||
| Temperate | 0.4 | −0.4 | 2.8 | −1.1 | 0.3 | −0.2 | 1.4 | −0.4 | 0.4 | −0.4 | 2.7 | −1.2 |
| Continental | 0.2 | −0.4 | 0.4 | −1.7 | 0.1 | −0.2 | 0.6 | −0.4 | 0.3 | −0.4 | 0.6 | −1.8 |
| Dry | 0.1 | 0.3 | −0.1 | 0.7 | 0.1 | 0.1 | 0.1 | 0.5 | 0.1 | 0.2 | −0.4 | 0.7 |
| Nighttime | ||||||||||||
| Temperate | 0.6 | 1.2 | 1.8 | 1.5 | 0.1 | 0.3 | 0.4 | 0.3 | 0.6 | 1.2 | 1.8 | 1.5 |
| Continental | 0.7 | 1.0 | 1.0 | 1.2 | 0.1 | 0.2 | 0.1 | 0.4 | 0.7 | 0.9 | 1.7 | 1.2 |
| Dry | 0.4 | 1.2 | 1.0 | 1.7 | 0.2 | 0.3 | 0.5 | 0.7 | 0.4 | 1.2 | 1.0 | 1.7 |
2.3. Biophysical factorization analysis
Total UHIs (ΔTs) can be approximated by linear supposition of various biophysical contributions: urban-rural changes in radiation balance, aerodynamic resistance, Bowen ratio, heat storage and anthropogenic heat (Zhao et al 2014). More details on the calculation can be found in the supplementary information. We quantified each biophysical contribution to ΔTs and compared them between normal and HW days. These evaluations were performed using 30 years of midday and midnight data from the three simulations (current: 1975–2004; RCP 4.5 and RCP 8.5: 2071–2100) over all selected cities. These analyses allow us to contrast the biophysical drivers between normal and HW days across climate conditions and scenarios.

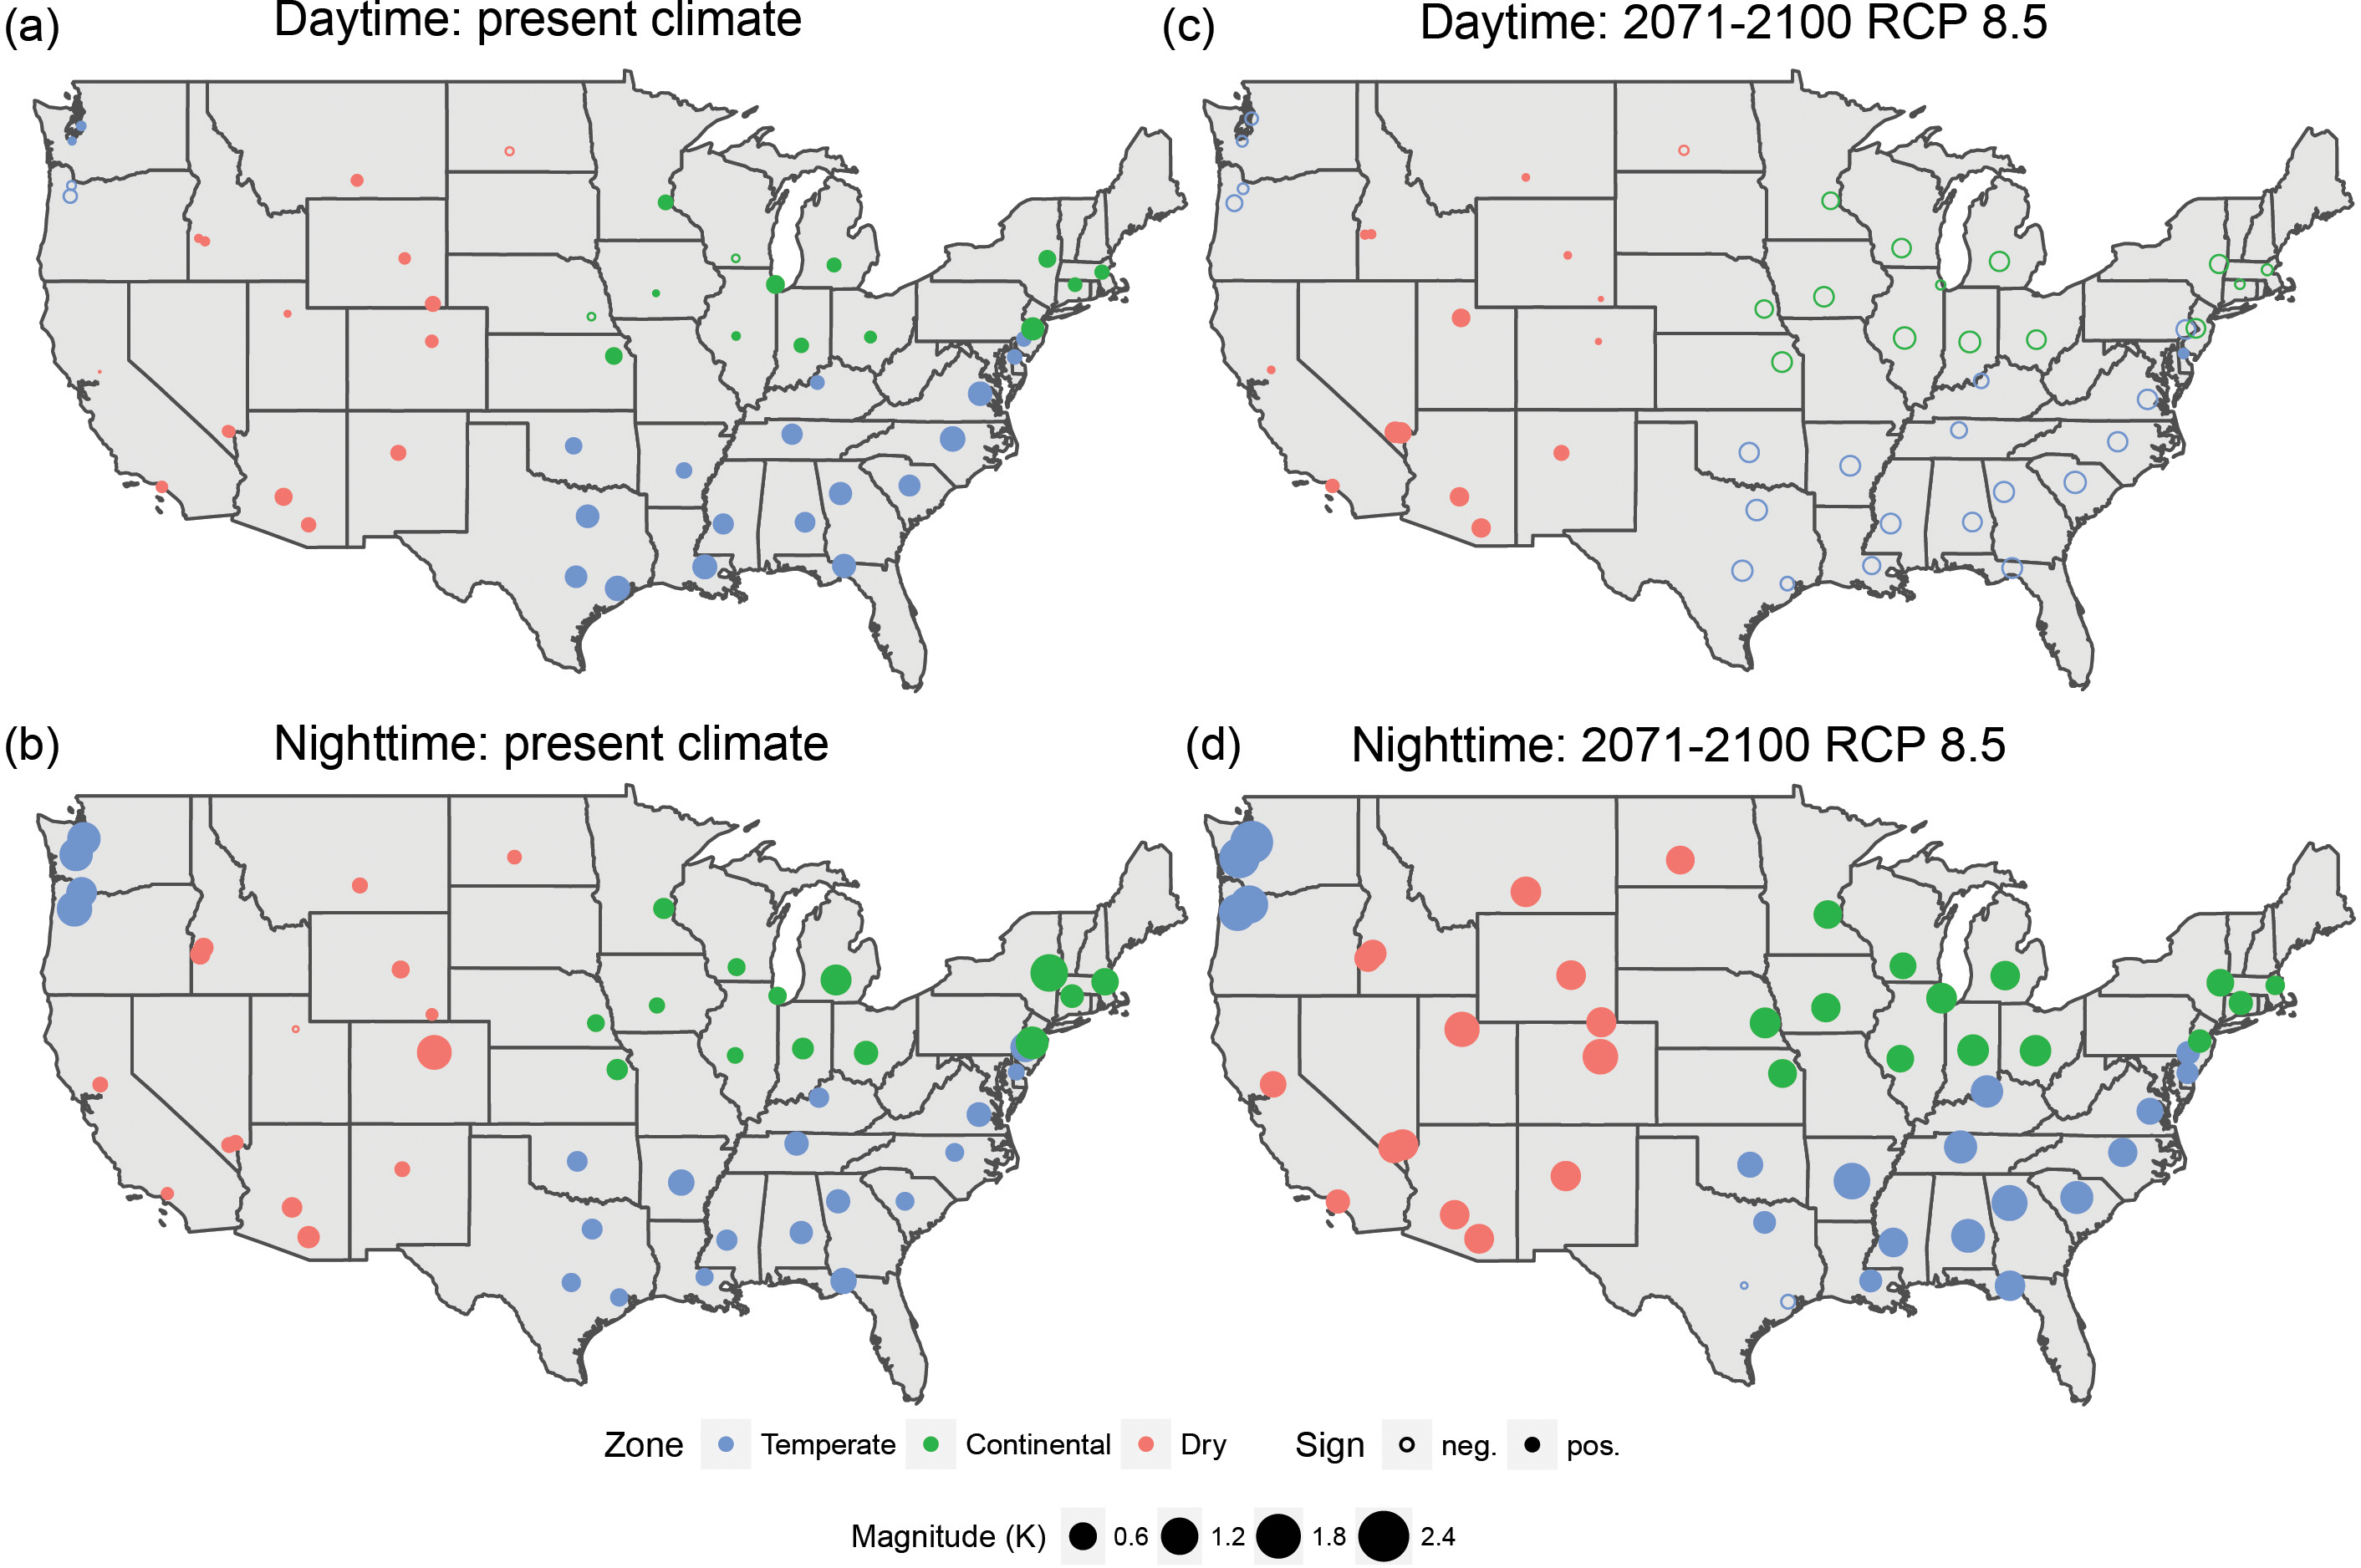
Figure 3. Air (∆T2m) and surface UHI (∆Ts) in summer during heat wave and normal days in current climate and future RCP scenarios. Open bars denote temperate region; solid bars denote dry region. Blue bars denote UHI in normal days; red bars denote UHI in heat wave days. (a), (b): daytime; (c), (d): nighttime. The error bar denotes ± 1 standard error.
Download figure:
Standard image High-resolution image3. Results and discussion
3.1. Interactions between UHI2m and HWs
We find strong diurnal and climatological signals in the interactions between UHI2m and HWs (figure 2 and table 1). During daytime, UHI2m is 0.4 ± 0.05 K (mean ± 1 standard error) or 80% higher during HW days than during normal days for cities in the temperate climate zone (humid eastern United States) under current climate (figure 2(a) and 3(a)). UHI2m for these cities are significantly enhanced during HWs, indicating a significant synergistic effect between UHI2m and HWs. This is consistent with previous findings in Baltimore/Washington metropolitan area in the US (Li and Bou-Zeid 2013) and Beijing in China (Li et al 2015). It is interesting that this synergistic effect is diminishing in future warmer climates. Near the end of this century, the average UHI2m for cities in this region is projected to be 0.3 ± 0.08 K and 0.4 ± 0.09 K lower during HWs than during normal days under RCP 4.5 and RCP 8.5, respectively (figure 3(a) and 2(c)). This indicates negative feedbacks between UHI2m and HWs in a future warmer world. Although our analysis and previous studies (Oleson 2012, Zhao et al 2017) have shown that different RCP scenarios have different impacts on the UHI, we find only slight difference in UHI2m–HW interactions between the two climate scenarios (figure 3(a)). The reason might lie in the calculation of the synergistic effects of HW and UHI. A warming scenario affects the UHI intensity in both normal and HW days, and thus part of the impacts are cancelled when the difference between UHI2m,HW and UHI2m,NM is calculated for a given warming scenario.
An opposite pattern occurs in the dry region. We find only a slight (~0.06 K) higher UHI2m during HWs compared to normal days in the present-day climate during daytime (figure 2(a) and 3(a)). This difference is statistically insignificant (p value > 0.38), indicating an indiscernible synergistic effect for cities in this region under current conditions. However, unlike those in the temperate region, the cities in the dry group show a stronger synergistic effect in future scenarios (figure 3(a) and 2(c)). Near the end of this century, the average HW exacerbation of UHI2m is projected to increase to 0.2 ± 0.06 K and 0.3 ± 0.05 K under RCP 4.5 and RCP 8.5, respectively. These numbers are statistically significant (p value < 0.01).
The diurnal pattern is asymmetric as well. At night, despite significant UHI2m–HW synergistic effects across climate zones and scenarios, demonstrated by solid circles in figures 2(b) and (d) and consistent higher red bars than blue bars in figure 3(c), there are no discernible impacts of local background climate on the effects. In the present-day climate, the nighttime UHI2m are intensified during HWs compared to normal conditions in temperate as well as dry region. Specifically, the average nighttime UHI2m is 0.6 ± 0.2 K and 0.4 ± 0.1 K larger during HWs than during normal conditions in the temperate and dry region, respectively. These numbers are projected to increase to 1.1 ± 0.1 K (temperate) and 1.0 ± 0.0 K (dry) under RCP 4.5, and 1.2 ± 0.2 K (temperate) and 1.2 ± 0.1 K (dry) under RCP 8.5. These results indicate that the GHG warming scenarios exacerbate the nighttime UHI2m—HW synergistic effects and that these effects remain minimally impacted by the background local climate in future scenarios.
3.2. Interactions between surface UHIs and HWs
We also analyzed the interactions between UHIs and HWs. This indicator is important since the radiant temperature is a key component of thermal comfort to urban residents. Moreover, it is closely related to the surface energy balance and hence quite informative as a metric of the city-scale microclimate for the purpose of comparing different cities across diverse climate conditions.
Table 2. Biophysical contributions to UHIs during heat wave and normal days at daytime and nighttime in present-day and future climates. (Unit: K)
| Present-day climate (1975−2004) | |||||||
|---|---|---|---|---|---|---|---|
| CLM | Calc. | Radiative | Convective | Evaporative | Storage | Anthropogenic | |
| Daytime | |||||||
| Temperate | 2.8 | 1.8 | −0.2 | 0.8 | 1.0 | −0.7 | 1.0 |
| Dry | −0.1 | −0.1 | 0.4 | 0.1 | −0.6 | −0.5 | 0.5 |
| Nighttime | |||||||
| Temperate | 1.8 | 1.0 | 0.0 | −0.3 | −0.2 | 0.3 | 1.3 |
| Dry | 1.0 | 0.9 | 0.0 | 0.0 | 0.0 | 0.7 | 0.2 |
| RCP 8.5 (2071−2100) | |||||||
| CLM | Calc. | Radiative | Convective | Evaporative | Storage | Anthropogenic | |
| Daytime | |||||||
| Temperate | −1.1 | −0.4 | −0.1 | 0.2 | −0.9 | −0.3 | 0.7 |
| Dry | 0.7 | 0.3 | 0.0 | 0.4 | −1.0 | −1.1 | 1.9 |
| Nighttime | |||||||
| Temperate | 1.5 | 0.7 | 0.0 | −0.4 | −0.1 | 0.3 | 0.9 |
| Dry | 1.7 | 0.9 | 0.0 | 0.1 | 0.1 | 0.3 | 0.5 |
We find that UHIs and UHI2m generally show consistent spatiotemporal patterns in their interaction with HWs, despite differing in magnitude. Figures 3(b) and (d) demonstrate the UHIs—HW interactions for cities in the two regions during daytime and nighttime under current and future climates. In the daytime, the average UHIs for temperate cities is 2.8 ± 0.8 K or 78% higher during HWs than during normal days in the present-day climate (figure 3(b)), indicating a significant synergistic effect. The magnitude of the effect is much larger than that estimated using UHI2m. This is as expected because UHIs is generally by nature larger than UHI2m (Nichol et al 2009, Roth et al 1989). Consistent with the UHI2m-HW interaction, the daytime synergistic effect in this region is projected to reverse in future warmer climates. Near the end of this century, the average UHIs is 0.7 ± 0.3 K and 1.0 ± 0.4 K lower during HWs than during normal days under the RCP 4.5 and RCP 8.5, respectively (figure 3(b)).
Cities in the dry region do not show any daytime synergistic effects under current climate. The average daytime UHIs is marginally lower during HWs than during normal days for the period 1975–2004 (figure 3(b)). Similar with the UHI2m-HW interaction in this region, the synergistic effect develops in future warming scenarios. The UHIs is 0.7 ± 0.2 K larger during HWs than during normal days near the end of this century under RCP 8.5 (figure 3(b)). At night, the synergistic effect is spatially consistent across climate regions. Under current climate, the difference between UHIs,HW and UHIs,NM is 1.8 ± 0.3 K and 1.0 ± 0.2 K for cities in the temperate and dry region respectively. These numbers are projected to be 1.4 ± 0.2 K and 1.7 ± 0.1 K near the end of this century under RCP 8.5.
3.3. Robustness to variation in heat wave definitions
Our analysis demonstrates that the spatiotemporal patterns of UHI-HW interactions are robust to different HW definitions (table 1). Although defining HW in the other two ways (Def-95Q and Def-2Day) affects the magnitude of the HW-UHI interactions, the spatiotemporal patterns agree well with results using Def-NWS. The consistency is confirmed for UHI2m and UHIs (table 1), strongly supporting the robustness of the aforementioned spatiotemporal patterns of the UHI-HW interactions.
3.4. Biophysical drivers
Although UHIs and UHI2m are fundamentally distinct concepts (Arnfield 2003), they demonstrate consistent spatiotemporal patterns in terms of their interactions with HWs (figure 3). An important advantage of UHIs is that it has a firm theoretical basis derived from the surface energy balance principle that explains the contributions of the biophysical properties of urban surfaces (Zhao et al 2014). Therefore, utilizing this biophysical factorization method, we can disentangle the relative importance of processes that contribute to the UHIs–HW interactions. Because of the consistency between UHIs and UHI2m, and the physical links between surface and air temperature, the physical mechanism behind the UHI2m–HW interactions can be inferred from this analysis of UHIs, but not necessarily in a direct way. For example, a large contribution of convection to the cooling of the surface (reduced UHIs–HW) would imply increased heating of the air (increased UHI2m–HW).

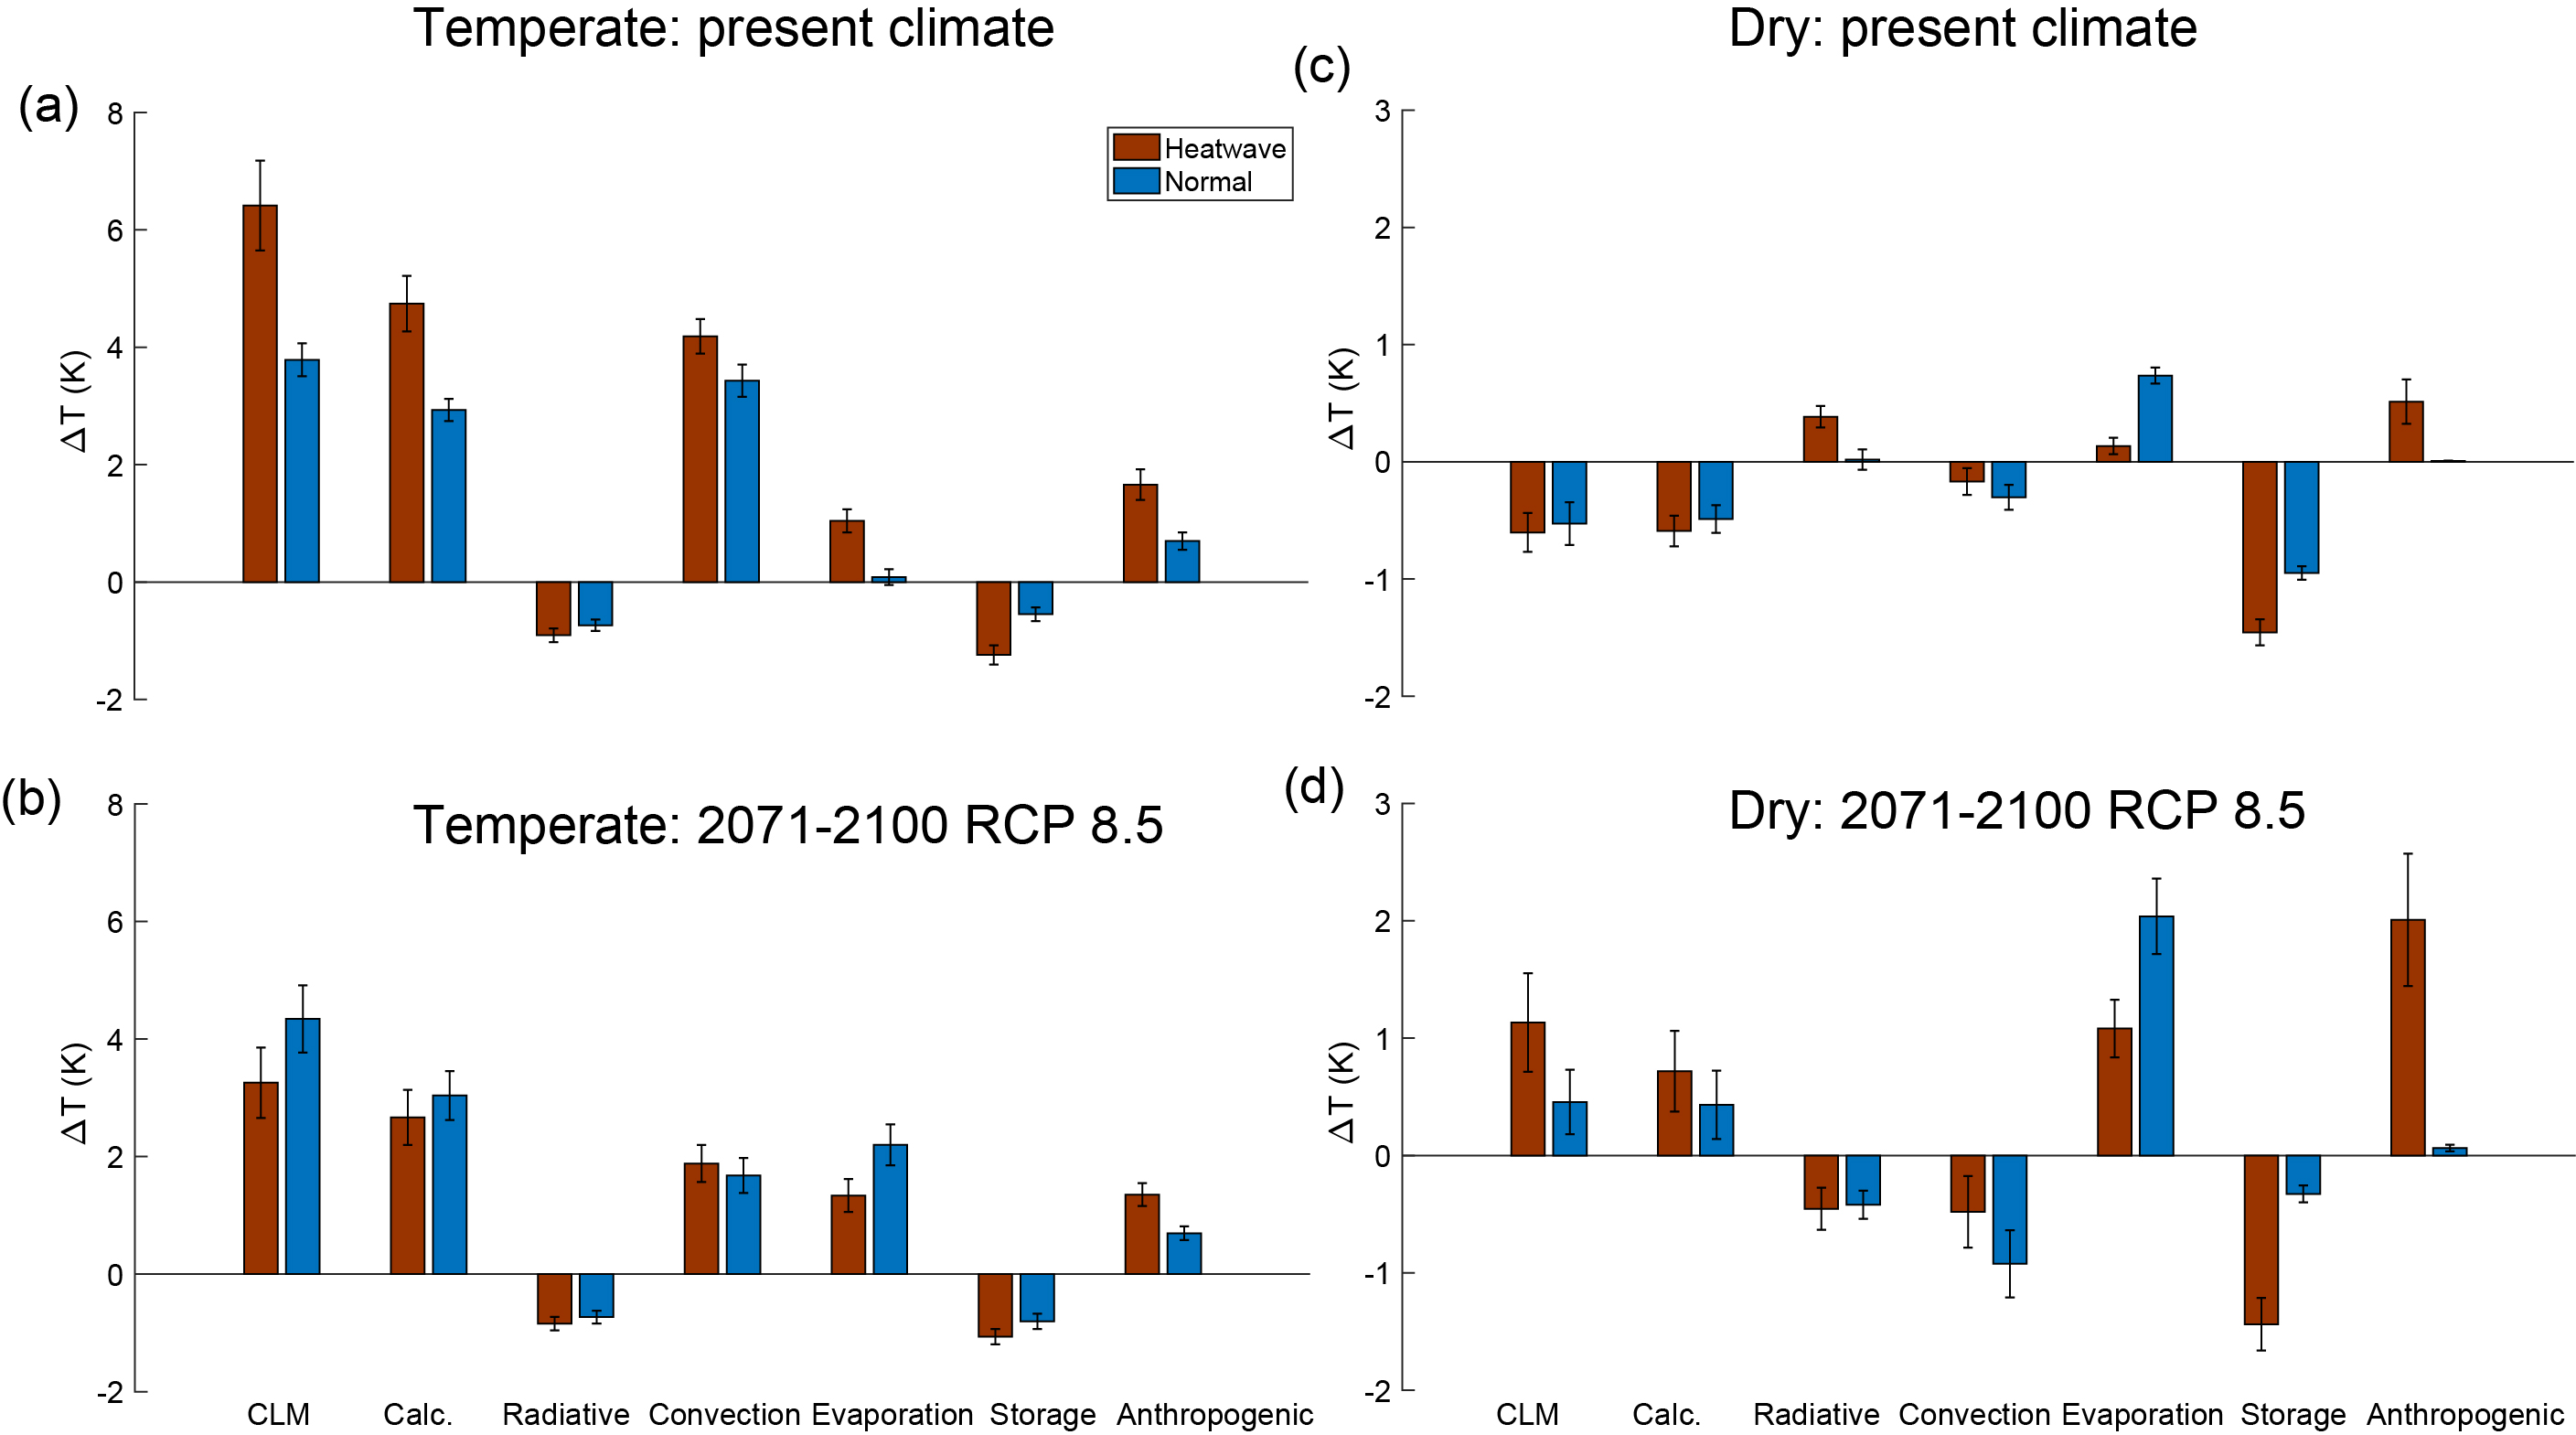
Figure 4. Biophysical contributions to UHIs during heat wave and normal days during daytime. (a), (b): temperate region; (c), (d): dry region. (a), (c): current climate; (b), (d): 2071–2100 RCP 8.5.
Download figure:
Standard image High-resolution image3.4.1. Daytime
Figure 4 illustrates the biophysical drivers of daytime UHIs during HWs and normal days in current climate and RCP 8.5. Because UHIs–HW interactions show slight differences between RCP 8.5 and RCP 4.5 (figure 3), we present the results of biophysical factorization for RCP 8.5 only. The bars of CLM-modeled ΔTs are shown in figure 4 for comparison as a validation of our biophysical factorization. Under current climate, the positive UHIs–HW synergistic effect in the temperate region primarily comes from the urban-rural difference in the contribution of evaporation (term 3 in supplementary equation (4)) and enhanced anthropogenic heat release (term 5 in equation (4)) during HWs compared to normal days (figure 4(a), compare the bars during HWs and normal conditions; and table 2). The contribution from evaporation to UHIs is increased by 1.0 ± 0.1 K during HWs compared to normal days and anthropogenic heat by 1.0 ± 0.2 K in the current climate. This elevated contribution of evaporation during HWs is consistent with observational (Li et al 2015) and modeling studies (Li and Bou-Zeid 2013). Over a water-sufficient surface, an increase of air temperature favors increasing latent heat flux rather than increasing sensible heat flux (Bateni and Entekhabi 2012). In temperate climates, cities are usually water limited due to the large fraction of impervious surfaces; whereas their surrounding rural surfaces are considered as water sufficient because of ample precipitation in this region. During HWs (i.e. temperature increases) evaporation is increased over urban surfaces but not increased as much as over rural surfaces, thus resulting in an enhanced contribution from evaporation to UHIs compared to normal days. The opposite occurs in the dry region under the present-day climate where urban and rural surfaces are water limited. Therefore, the enhanced evaporative contribution to UHIs is weaker for cities in this region (figure 4(c) and table 2). The enhanced anthropogenic heat release during HWs, present in temperate and dry climate region (figures 4(a) and (c) and table 2), are primarily the result of higher air-conditioning (AC) energy use to cope with the heat extremes (see supplementary information available at stacks.iop.org/ERL/13/034003/mmedia).
Figures 4(b) and (d) explain the future trends of UHIs–HW interactions under RCP 8.5. For cities in the temperate region, the synergistic effect is diminished in future scenarios. This is because the enhancement of evaporative contribution to the urban-rural difference during HWs compared to normal days is diminished near the end of this century under RCP 8.5 (figure 4(b) and table 2). The reason lies in the projected increase of precipitation in this region in future warmer climates by CESM (supplementary figure S1(a)). The increase of precipitation, to some extent, turns cities into water-sufficient surfaces assuming that future cities have the same impervious fractions (see section 3.6), so that evaporation over cities can increase as much as over their surrounding rural surfaces when HWs come in.
The situation is relatively different in the dry region. The synergistic effect becomes stronger in future warmer climates, mainly a result of the significantly elevated anthropogenic heat release during HWs. The source of the increase in anthropogenic heat is again primarily from higher AC energy consumption to cope with the extreme heat during HWs. The evaporative contribution to ΔTs is increased during normal and HW days under future warmer climates compared to the current climate. The reason again lies in the projected increase of precipitation in future scenarios (figure S1(b)). In the current climate, cities and their surrounding rural areas largely lack water in this region. In future warmer climates, the water availability of rural surfaces is increased due to the increase in precipitation. The current version of CESM captures the dynamic feedbacks of vegetation to a changing climate state via its biogeochemical component (Oleson et al 2010). The moisturized soil, combined with the CO2 fertilization effect and increasing air temperature, helps vegetation in rural areas develop rapidly in future climates. Rural surfaces in the dry region are no longer 'dry' in the future in the model. Therefore, the total rural evapotranspiration is generally increased in this region in the future. The water availability of urban surfaces, however, is much less increased than rural surfaces by the increased precipitation because of the lack of permeable surfaces in cities. Thus, the urban surfaces will remain water-limited to some extent. The lack of surface evaporative cooling over urban surfaces compared to over rural surfaces is intensified in future warmer climates. Therefore, the evaporative contribution to ΔTs is increased during normal and HW days by the end of century under RCP 8.5 compared to current climate.

Figure 5. Biophysical contributions to UHIs during heat wave and normal days during nighttime. (a), (b): temperate region; (c), (d): dry region. (a), (c): current climate; (b), (d): 2071−2100 RCP 8.5.
Download figure:
Standard image High-resolution image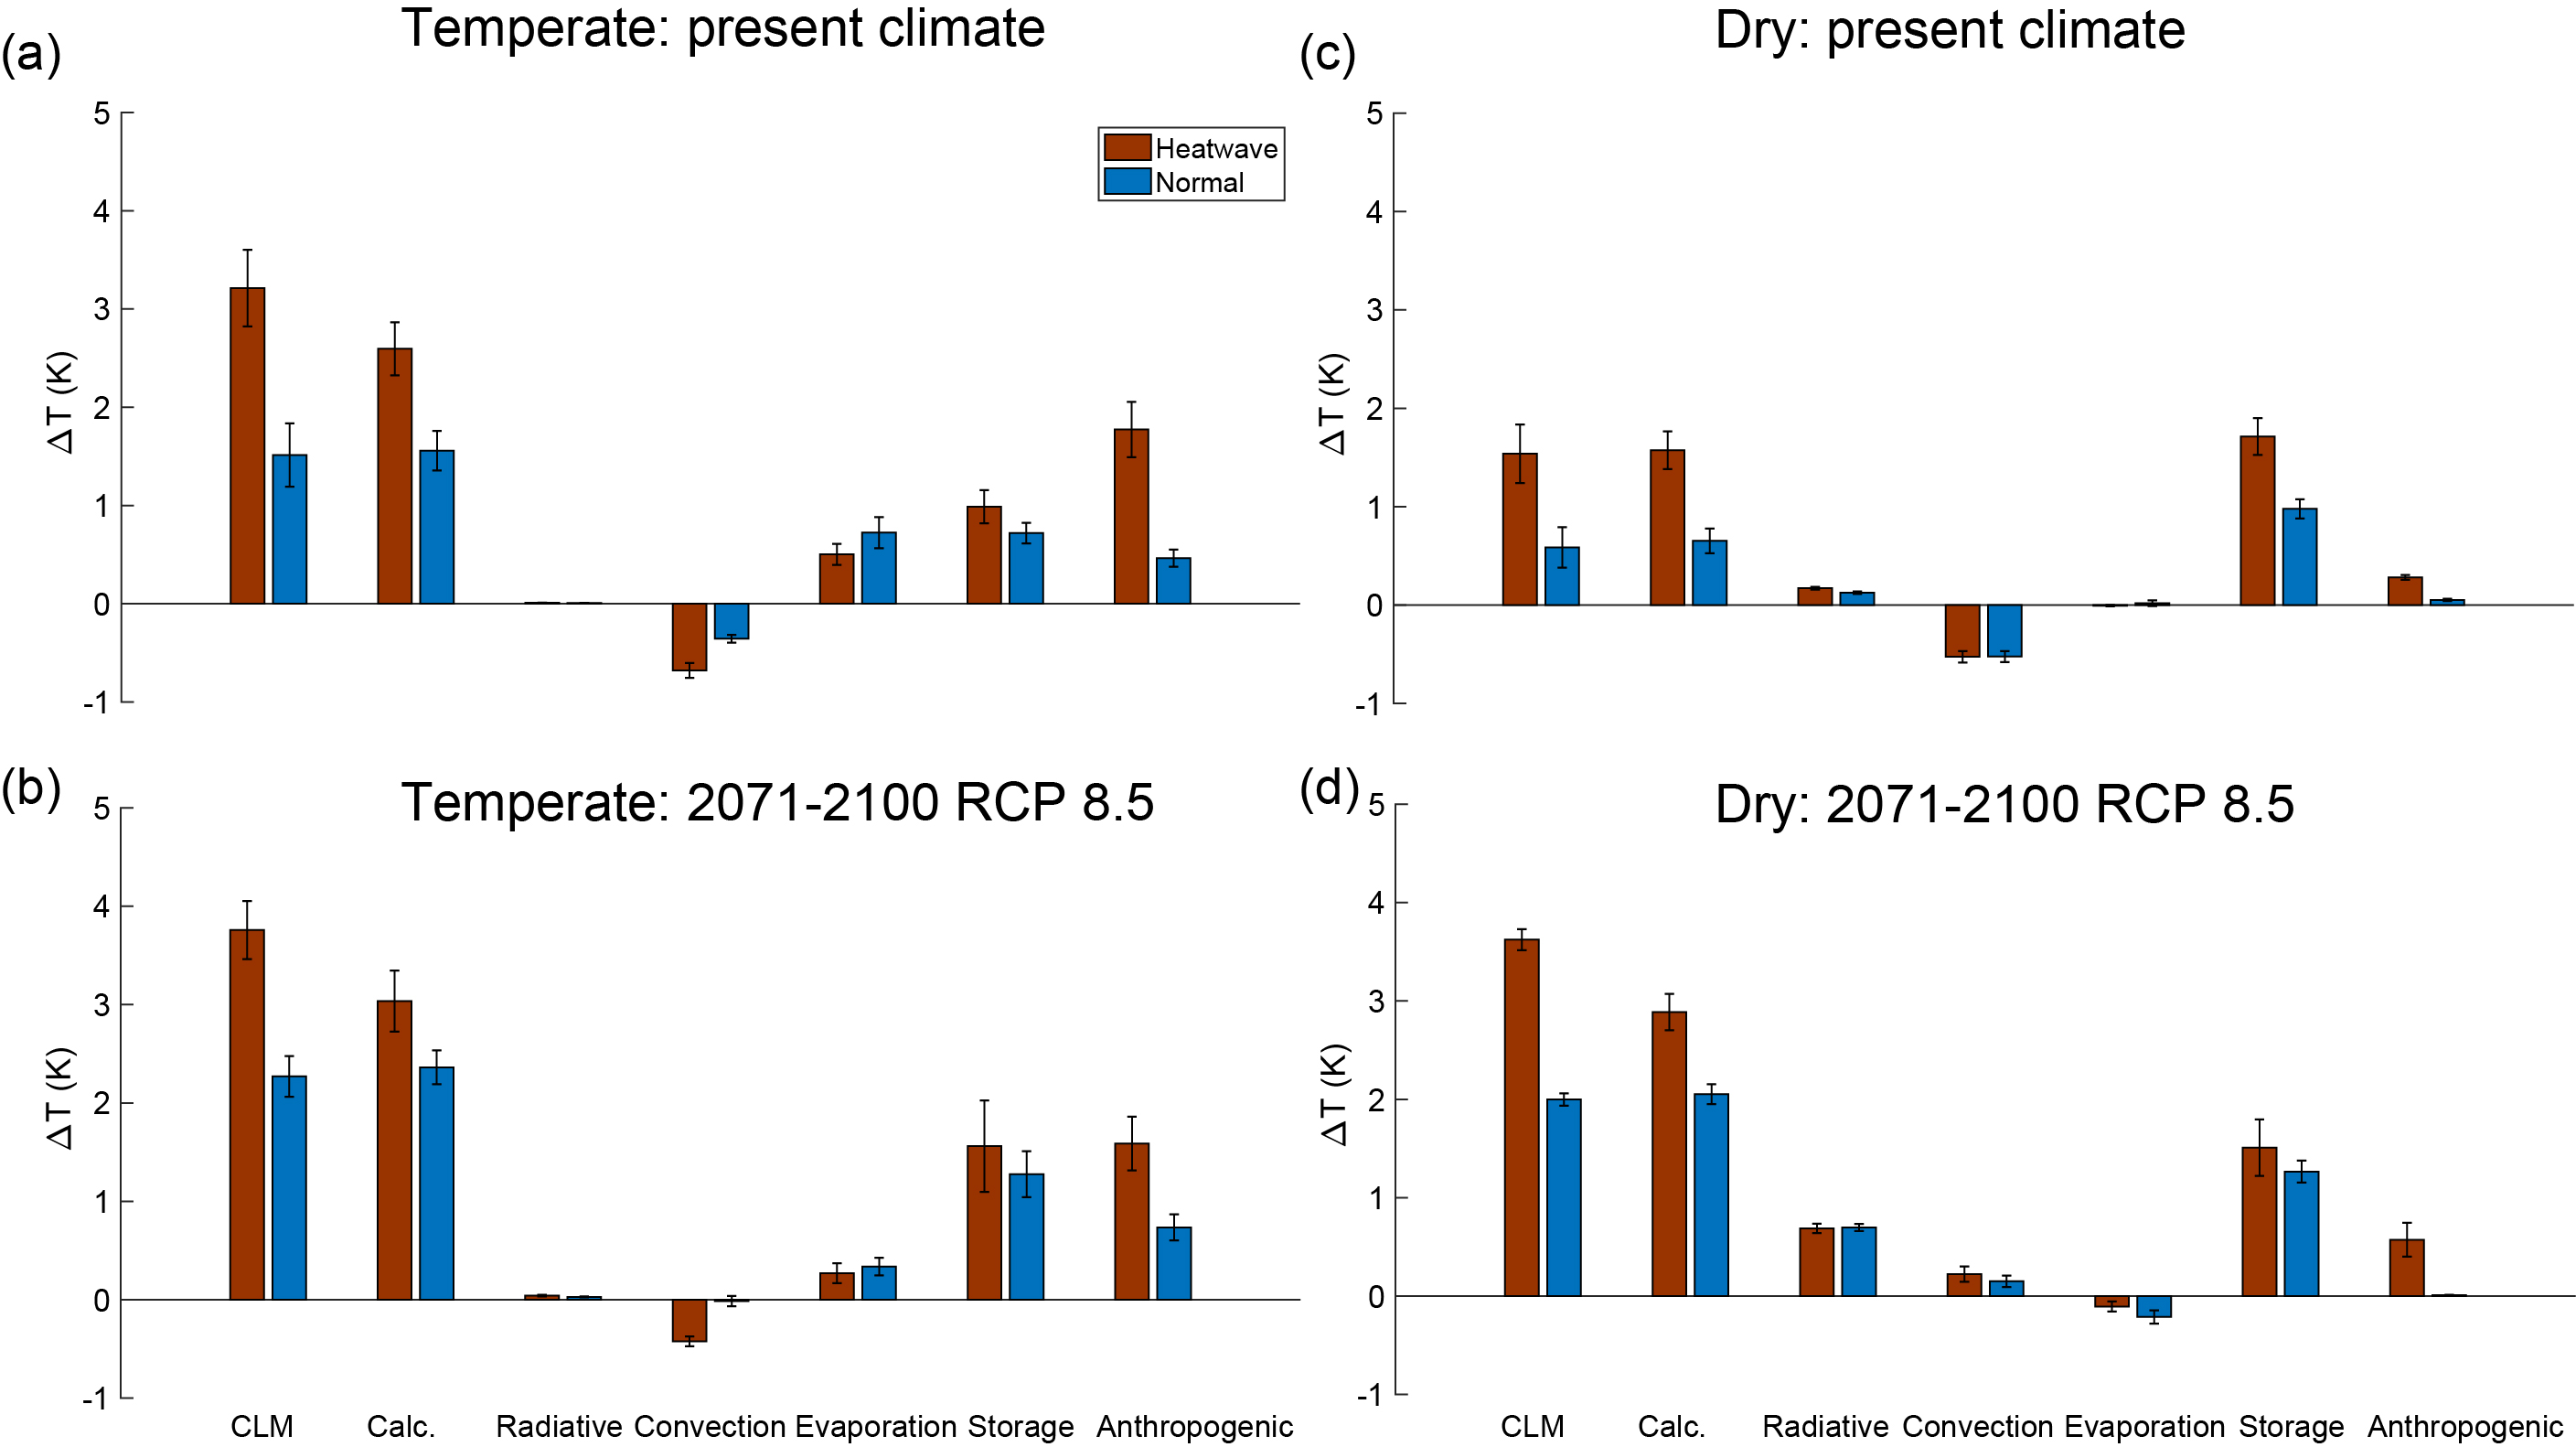
3.4.2. Nighttime
At night, the UHIs—HWs synergistic effects are consistent across climate regions and scenarios. Figure 5 shows that this behavior is primarily the result of significantly elevated anthropogenic heat addition (term 5 in equation (4)) and increased release of stored heat (term 4 in equation (4)) during HWs. Absent solar radiation, convective and evaporative processes are relatively weak at night. Therefore, contributions from these processes are in general low. This reaffirms the well-established theory that the stored heat in the urban structures and materials, and anthropogenic heat release are the dominant contributors to the UHI at night (Oke 1982). The contribution of evaporation at night comes primarily from soil evaporation (plant stomata are closed at night). Because of the comparative lack of evaporative water in the human-made urban land, soil evaporative cooling in the rural areas contributes a significant fraction to the nighttime UHI in the temperate climate (figure 5). In the dry climate, evaporation contribution to the nighttime UHI is very small (figures 5(c) and (d)) due to the fact that this term is proportional to the inverse of β2 (β is the Bowen ratio; see supplementary equation (4)). The enhancement of anthropogenic heat addition during HWs is again because of the higher heat released by AC cooling. The elevated release of heat storage at night is from two sources. First, it is from larger increases in heat stored during daytime in urban areas that have much higher thermal admittance compared to rural areas (Ramamurthy et al 2014). The second source lies in the changes in rural thermal admittance, which can be sensitive to soil moisture, during HWs. Urban thermal admittance is usually less subject to soil condition change because of the use of human-made materials. Therefore, if rural soil moisture drops during HWs (as HWs are usually accompanied by droughts due to a precipitation-temperature feedback), the urban-rural difference in thermal admittance would become larger and thus contribute positively to the UHI (Oke et al 1991, Runnalls and Oke 2000).
The model captured the lag in the release of the elevated heat storage during HWs, that is, the accumulation of stored heat in urban areas in the HW period is gradually released after the atmospheric HW subsides. We find that the heat storage at daytime (stored) and nighttime (released) in the days immediately after the HWs (1−2 d after HW) are on average 5–20 W m−2 greater than that in normal days. This lag effect lasts up to 2 d in the model. These results are consistent with the previous observational and modeling studies (Li and Bou-Zeid 2013, Li et al 2015).
3.5. Limitations
We note four limitations of this study. First, urban land use is not dynamically represented in the current version of CESM. In other words, the urban fraction and geometry in every grid cell are fixed over time. Given that the nighttime UHI shows dependence on the morphological aspects of the city (Oke 1982, Oleson et al 2008), nighttime UHI is likely to increase with urbanization in the future, unless the mitigation of UHI is explicitly taken into account in urban planning. Therefore, the simulated nighttime UHI in the two RCP scenarios in this study are likely lower bounds of the potential nighttime heat stress for growing cities in future climates. Second, although CESM can simulate the dynamic response of building energy use to the environment, its parameterization scheme in the current version is still primitive. The total anthropogenic heat in the model includes only fluxes related to heating and AC, but not traffic-related heat fluxes, potentially causing a slight underestimate in anthropogenic heat. Third, local-scale processes such as advection between adjacent urban and rural land in the same grid cell are not resolved in the CESM. Therefore, impacts of changes in wind speed on the synergistic effects cannot be simulated. According to Li et al (2016), an increase in urban wind speed from 0.1 to 10 m s–1 during daytime under HWs would increase UHI by less than 0.3 K. Last, our results are based on simulations from one ESM under two RCP scenarios rather than multi-model ensembles. CESM is currently the only ESM that has a sufficiently detailed physically-based urban land parameterization in CMIP5 (Phase 5 of the Coupled Model Inter-comparison Project) models. If other ESMs or future scenarios show a different trend in precipitation, the outcomes could be different.
4. Conclusions and implications
This study investigated the interactions between urban heat islands (UHI) and heat waves (HWs) at a large scale under current and future warmer climates (RCP 4.5 and RCP 8.5) using a global climate model. We examined UHI2m (urban-rural difference in 2m-height air temperature) and UHIs (urban-rural difference in radiative surface temperature), showing consistent spatiotemporal patterns between UHI2m and UHIs in their interactions with HWs. We find strong diurnal and climatological signals in the interactions. During daytime, cities in the temperate region show significant UHI—HW synergistic effects in the current climate. These effects are projected to diminish in future scenarios (both RCP 4.5 and RCP 8.5). The opposite occurs in the dry region, where cities show no discernible synergistic effects in the current climate but significant effects in the future. Our biophysical factorization analysis demonstrates that the difference in the increase of urban-rural evaporation and enhanced anthropogenic heat during HWs are key contributors to the synergistic effects during daytime. The contrast in degree of water availability between urban and rural land plays an important role in determining the contribution of evaporation. At night, our results show similar synergistic effects across climate regions and scenarios. The enhanced release of heat storage and anthropogenic heat during HWs are the primary contributors to the synergistic effects at nighttime.
Our results underscore that, besides anthropogenic heat release, the degree of water limitation in the city plays a key role in determining the daytime UHI–HW synergistic effects in temperate and dry region under current and future climates. Urban adaptation and mitigation strategies that involve increasing the green fraction/water availability such as green roof and street vegetation (Georgescu et al 2014, Li et al 2014, Zhao et al 2017) could help reduce the synergistic effects. Increasing and maintaining the greenness in cities demands freshwater supply, especially for those in dry climates. Freshwater is not a free resource and is projected to become scarcer (McDonald et al 2011). Additionally, HWs are usually accompanied by droughts (Fischer and Schar 2010, Seneviratne et al 2006). Therefore, the cost of such strategies is a crucial consideration.
This study highlights the heat risks that urban residents face now and in the projected future. HWs have detrimental impacts on human society and natural ecosystems. The UHI, an additional hot anomaly on the climatological HW, has already aggravated heat stress on urban residents (Patz et al 2005, Tan et al 2010). These risks are even greater if HWs interact synergistically with UHIs. The synergistic effect that we found in the current climate explains contributions to the greater risks in urban areas during HWs (Le Tertre et al 2006, Vandentorren et al 2004).
Health impacts are a key motivation for our study of UHI—HW interactions on a large scale. Heat extremes have adverse impacts on human health and increase the likelihood of heat-related mortality across different regions in the world (Bobb et al 2014, Huang et al 2011, Kovats and Ebi 2006, O'Neill and Ebi 2009, Wu et al 2014, Zanobetti et al 2012). Our results can be interpreted in the context of HW mortality risk. A study based on 43 communities in the United States found that mortality risk increases as temperature increases during a HW (Anderson and Bell 2011). Using their estimates (7.9% increase in mortality risk for every 1 °C increase in average temperature during a HW), and assuming this relationship stays constant in the future, the synergistic effect alone leads to a 3.2% increase in mortality risk in the current climate for temperate cities where risk is fundamentally higher due to humid conditions (Smith et al 2013). Although our results show a diminishing daytime synergistic effect in future warmer climates in this region, urban heat risk will nevertheless increase because the background climatological temperature is rising (GHG warming) and UHI and GHG warming are additive, in addition to factors that are expected to increase vulnerability such as population aging and larger numbers of people with chronic conditions that increase their susceptibility.
The nighttime synergistic effects are consistent across climate zones and scenarios. This raises greater concern as extreme high temperatures at night may be more closely associated with the mortality risk than daytime (Kusaka et al 2012), possibly because of the lack of relief during cooler nights (Schwartz 2005), as well as higher relative humidity at night, leaving residents without air-conditioning subject to extreme indoor heat and humidity. Based on the nighttime estimates in Anderson and Bell (2011), the nighttime synergistic effect in the temperate region in this study leads to an increase of 2.2% in mortality risk in current climate; this number is projected to increase to 4.3% by the end of this century under RCP 8.5.
Acknowledgments
This research was supported by the Carbon Mitigation Initiative and a High Meadows Foundation Fellowship in the Program in Science, Technology and Environmental Policy at Princeton University (to L Z). Q Z is supported by the Director, Office of Science, Office of Biological and Environmental Research of the US Department of Energy under Contract No. DE-AC02-05CH11231 as part of their Regional and Global Climate Modeling program RUBISCO SFA project. E B Z is supported by the US National Science Foundation's Sustainability Research Network Cooperative Agreement # 1444758 and grant # ICER 1664091. We acknowledge high-performance computing support from Yellowstone (ark:/85065/d7wd3xhc) provided by NCAR's Computational and Information Systems Laboratory, sponsored by the US National Science Foundation. The authors declare that they have no conflict of interest.