

Abstract
May 2016 was the third wettest May on record since 1961 over central eastern China based on station observations, with total monthly rainfall 40% more than the climatological mean for 1961–2013. Accompanying disasters such as waterlogging, landslides and debris flow struck part of the lower reaches of the Yangtze River. Causal influence of anthropogenic forcings on this event is investigated using the newly updated Met Office Hadley Centre system for attribution of extreme weather and climate events. Results indicate that there is a significant increase in May 2016 rainfall in model simulations relative to the climatological period, but this increase is largely attributable to natural variability. El Niño years have been found to be correlated with extreme rainfall in the Yangtze River region in previous studies—the strong El Niño of 2015–2016 may account for the extreme precipitation event in 2016. However, on smaller spatial scales we find that anthropogenic forcing has likely played a role in increasing the risk of extreme rainfall to the north of the Yangtze and decreasing it to the south.
Export citation and abstract BibTeX RIS

Original content from this work may be used under the terms of the Creative Commons Attribution 3.0 licence.
Any further distribution of this work must maintain attribution to the author(s) and the title of the work, journal citation and DOI.
1. Introduction
In the context of global warming, more intense and more frequent extreme precipitation events have long been projected (Hartmann et al 2013, Hirsch and Archfield 2015). Faced with increasing climate change risks, society around the world needs a better understanding of such risks to prevent climate-related hazards, especially for regions with high exposure and vulnerability. China, occupying a region as large as Europe, has experienced more intense and frequent precipitation extremes in recent several decades (Zhai and Sun 1999, Yan and Yang 2000, Zhai et al 2005, Qian et al 2007). The lower reaches of the Yangtze River Valley—one of the most important industrial and agricultural zones, and densely populated regions in China—experienced extreme rainfall in May 2016 during which there was one day when the daily precipitation broke the 56-year May daily maximum records at 25 stations (CMA 2016). This heavy and sustained precipitation event led to waterlogging, landslides, debris flow and some other disasters over part of central eastern China, resulting in severe damage to crops and disrupting agricultural production (CMA 2016). Due to the damage-causing capacity and general increasing trend of persistent heavy rainfall (Zolina et al 2010, Chen and Zhai 2013, IPCC AR5 2013), changes in the risk of such precipitation extremes are of great concern to policy-makers and the general public.
Min et al (2011) showed that anthropogenic forcings have contributed to the observed intensification of heavy precipitation events over large parts of the Northern Hemisphere's land area. Zhang et al (2013) found consistency between the multimodel simulated response to the effects of anthropogenic forcing and observed changes in extreme precipitation on average over Northern Hemisphere land. There also exists evidence indicating that changes in heavy rainfall in some regions of southeast China is attributable to anthropogenic forcings (e.g. Burke et al 2016). Though there are numerous studies focusing on this issue, geographical coverage of events remains patchy (Stott et al 2016). In addition, there is a growing demand to do attribution analysis of extreme events timely to inform adaptation planning for flood defences and to support climate risk management in China. In this study, we intend to address how the probability of anomalous wet conditions, similar to those in May 2016 in the lower reaches of the Yangtze River Valley, has changed due to human-induced climate change.
2. Data
The observed daily precipitation data are obtained from Climate Data Center of China National Meteorological Information Center (NMIC), which span the period of 1961–2016. After conducting rigorous quality control as described in Chen and Zhai (2014), 1277 stations are retained around China. Two model ensembles generated by the newly updated Met Office Hadley Centre system (HadGEM3-GA6, Walters et al 2017) for Attribution of extreme weather and Climate Events (updated from Christidis et al 2013, see Ciavarella et al 2017) at a N216 resolution (0.56° × ~0.83° horizontal resolution) are used in our attribution analysis. We use two ensembles. One is forced with a combination of anthropogenic and natural forcings (ALL) and the other is forced by natural forcing only (NAT). The ALL experiment employs observed sea surface temperatures (SSTs) and sea-ice data (HadISST; Rayner et al 2003) as boundary conditions. The boundary conditions for the NAT experiment are provided from the HadISST observational dataset minus an estimate of the anthropogenic contribution derived from the Coupled Model Intercomparison Project Phase 5 (CMIP5) coupled model simulations. More detailed information about the system and forcings used can be found in Christidis et al (2013). During the period 1961–2013, each ensemble comprises 15 members, subsequently expanded to 105 and 525 members for 2014–2015 and 2016 respectively. Since 2014–2015 is used for test cases and ensemble size is not consistent with that for 1961–2013, the reference period is chosen as 1961–2013.
We also adopt the ALL experiments of 37 models (supplementary table S1, available at stacks.iop.org/ERL/13/014015/mmedia) from CMIP5 (Taylor et al 2012) to further assess whether the attribution results with HadGEM3-GA6 are robust. Since the ALL experiments end at 2005, we take 1986–2005 as our present day (PD) and 1901–1920 as an early period (EP). By comparing the changes between two periods, we assess impact of changes in forcing, presumably dominated by changes in anthropogenic forcing, on probability of extreme event from EP to PD.
3. Methodology
For observed monthly mean precipitation in May, the average is a simple average of the station data. For data from model ensembles, the average is calculated from the area-weighted model grid box which fall within the mesh containing some station observations. The mesh grid is the same as the model grid. We use the 'risk ratio' (RR), a probabilistic extreme event attribution approach (Allen 2003, National Academies of Sciences, Engineering, and Medicine 2016), to characterize the anthropogenic contribution to the occurrence of the extreme event, by considering occurrence probabilities P(ALL) and P(NAT). These quantities represent the probability that the risk change of an event in the 'real' world with all forcings, P(ALL), to that in the 'natural' world with only natural forcings, P(NAT). From these estimated probabilities, the RR can be calculated, where RR = P(ALL)/P(NAT). Bootstrapping with replacement from 1000 samples is used to estimate the error on the probability and risk ratio for the occurrence of an event for at least 90% confidence interval. The 90% confidence interval extends from 5%−95% percentiles of the probabilities or risk ratios achieved from the 1000 probability density functions (PDFs) of the 1000 bootstrapped samples. If the resample distribution is slightly asymmetric, the wider side of the distribution is used to define the width of the confidence interval.

Figure 1. (a) Standardized anomaly of monthly mean precipitation, average of available station data within the study region for May over central eastern China. Red dashed line indicates the 1.5σ threshold, equivalent to the magnitude of 2016 anomaly. (b) Distribution of stations (black dots) in the study region.
Download figure:
Standard image High-resolution imageTable 1. Areal mean May precipitation and precipitation inter-annual variability for the climatological period (1961–2013) and 2016.
| Observations | ALL Model | |||
|---|---|---|---|---|
| Statistic\Year | 1961–2013 | 2016 | 1961–2013 | 2016 |
| Mean total rainfall (mm day−1) | 5.6 | 7.9 | 6.8 | 8.0 |
| Standard deviation for R(i) time series (mm day−1) | 1.5 | / | 2.0 | / |
3.1. Region selection
We examine the region (117°E–121°E and 26°N–34°N), containing 108 stations, which have continuously recorded since 1961, as depicted in figure 1(b) in the lower reaches of the Yangtze River Valley, where persistent heavy precipitation in May 2016 was concentrated. As indicated in figure 1(a) and table 1, the area-averaged monthly mean precipitation in May 2016 over this region is 7.9 mm day−1, 40% more than the climatology (5.6 mm day−1) over the period of 1961–2013, and is the third highest during the period of 1961–2016.
Rainfall tends to be a very localized phenomenon, evidenced by a dipole pattern of anomalous rainfall with opposite anomalies presented in Wang et al (2011) between the areas north and south of about 30° N in the lower reaches of Yangtze River Valley over the Meiyu period at interannual time scales. In addition, past research has revealed differences of attributable anthropogenic influence in spatially adjacent regions (e.g. Min et al 2011, Burke et al 2016, Burke and Stott 2017). Therefore, we divided the flood-affected area into two sub-regions, the Northern (30°N–34°N) and Southern parts (26°N–30°N), to examine anthropogenic influences in these two regions separately.
3.2. Threshold
Normalized departures from climatology are widely used to objectively rank synoptic-scale events (e.g. Hart and Grumm 2001, Junker et al 2009, Graham and Grumm 2010). We can objectively compare precipitation variability and extremes across space and time by normalizing climate data relative to a reference period (Duan et al 2015, Jiang et al 2016). In this study, in May of each year i, the standardized anomaly, RA(i), is derived by subtracting the local mean, μ, from the area-average monthly mean precipitation of the available station data within the study region, R(i), and divided by the corresponding standard deviation of inter-annual variability, σ, estimated from the reference period (1961–2013). It can be written as;
RA(i) is used to rank events based on departures from the local climatology in units of standard deviation (σ).
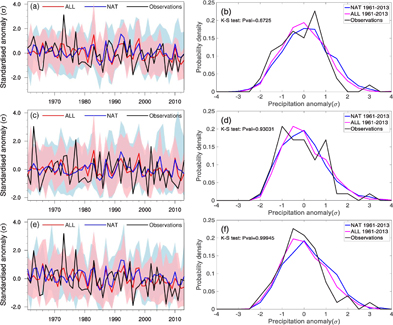
Figure 2. (a) Time series and (b) probability density functions (PDFs) of standardized anomaly of monthly total precipitation in May over 1961–2013 for the whole study region, (c) and (d) same as (a) and (b) but for the northern sub-region, (e) and (f) same as (a) and (b) for the southern sub-region. Black lines indicate observations; red and blue lines represent ensemble means of ALL and NAT HadGEM3-GA6 ensembles respectively; ensemble range of ALL and NAT experiments are shown by light red and blue shadings respectively.
Download figure:
Standard image High-resolution image
Figure 3. The probability density functions (PDFs) of May monthly precipitation anomaly for the three parts of the study region: (a) the whole target region, (b) the northern part of the target region, (c) the southern part of the target region. Red lines correspond to the HadGEM3-A-N216 all forcings run (ALL) for 2016; blue to natural forcings (NAT) for 2016; black to observations over 1961–2013. The vertical lines are the standardized observed precipitation anomalies of May 2016, which are chosen as the thresholds. (The precipitation anomalies in May 2016 for three regions are 1.5, 1.55, and 1.86 standard deviations above the climatological mean.)
Download figure:
Standard image High-resolution imageTable 2. The probability of the extreme precipitation with intensity as high as that in May 2016 for various forcings over three different regions.
| Whole region | Northern region | Southern region | |
|---|---|---|---|
| Observed 1961–2013 | 0.057 ± 0.05 | 0.038 ± 0.03 | 0.057 ± 0.05 |
| ALL 1961–2013 | 0.108 ± 0.02 | 0.053 ± 0.01 | 0.053 ± 0.01 |
| NAT 2016 | 0.259 ± 0.03 | 0.095 ± 0.02 | 0.133 ± 0.03 |
| ALL 2016 | 0.261 ± 0.03 | 0.156 ± 0.03 | 0.091 ± 0.02 |
The observed areal averaged precipitation anomaly for May 2016 exceeds 1.5σ from the 1961–2013 mean, as shown in figure 1(a). The PDF of RA for all years between 1961–2013 indicates that the probability of precipitation anomaly greater than that for May 2016 is about 4% (figure 3(a)), corresponding to a return time of at least 13 years at 90% confidence level. The anomaly of 1.5σ is selected as the threshold for extreme precipitation for our attribution analysis. Using the same method, we calculated anomalies and thresholds for the two sub-regions for both observations and model simulations. The thresholds are 1.66σ and 1.86σ for the Northern part and Southern part respectively (see table 2).
3.3. Model assessment
RA for both the ALL and NAT model simulations were calculated in the same way as in observations, but precipitation means and standard deviations were computed using all ensemble members of the ALL experiment in the period 1961–2013 using all data in the regions. Then for each ensemble member, all simulations were normalized using these values. By doing this, any systematic bias in area-averaged monthly mean precipitation and in inter-annual variability in model simulations are removed in the normalized precipitation time series.
Evaluation of the model simulations was carried out to see if the model could accurately reproduce the characteristics of precipitation in this region. Comparison of the normalized time series between the model ensemble and the observations indicates that the model is generally skillful in reproducing characteristics of May precipitation for the whole target region (figure 2(b)), southern (figure 2(d)) and northern sub-regions (figure 2(f)). The inter-annual variability of the observed time series is included in the range of the model ensemble for these three study regions (with the exception of 1963 and 1973). On average over the entire region, the model overestimates the absolute amount of monthly rainfall by about 21% (see table 1) and its interannual variability by about 33%.
The PDFs of the standardized precipitation anomaly for the observations and model simulations during our climatological period 1961–2013 are visually similar to each other (figure 2(a)). A Kolmogorov–Smirnov two-sample test (Wilks 2006), confirms that there is no significant difference between the distributions constructed with ALL experiments and observations over period 1961–2013 (P-value of 0.67). Low P-values are needed to reject the null hypothesis that two data are from the same continuous distribution. For the northern and southern sub-regions, ALL experiments and observations over period 1961–2013 also have similar PDF distributions with P-values of 0.93 and 0.99 respectively. Whilst the model overestimates the absolute amount of precipitation during May and its interannual variability, the standardized precipitation anomaly corrects these systematic biases. Using this metric, the corrected model precipitation performs well in reproducing May precipitation variability and is suitable for attribution studies of May precipitation in the lower reaches of the Yangtze River Valley.
4. Results
For the whole target region, the probability of areal averaged precipitation anomaly greater than the threshold defined above (1.5σ) is 11% for the ALL experiments over the period 1961–2013 (see figure 3(a)). This probability increases to 26% in 2016. For 2016, the risk of an extreme event with total rainfall as high as that in May 2016 is 2.4 times as large as the climatology. From figure 3, comparing the PDFs of both the ALL and NAT experiments for 2016 with those for climatology, it appears that natural forcing dominates in increasing the probability of the 2016 extreme event. As shown in table 2, the probability of exceeding the threshold of 1.5σ in ALL experiment for 2016 is P(ALL) = 0.261 ± 0.03, while that in NAT experiment is P(NAT) = 0.259 ± 0.03. Correspondingly, the estimated risk ratio is RR = 1.01 ± 0.17, indicating little change in the probability of such event due to human-induced climate change. The strong El Niño that occurred in 2015/2016 may account for the significant enhancement of May precipitation in the Yangtze River Valley in China.
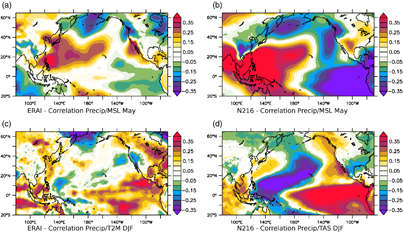
Figure 4. Correlation between the May precipitation over the Yangtze river and May sea level pressure for ERA Interim (a) and N216-ALL ensemble mean (b). Correlation between the May precipitation over the Yangtze river and the 2 m temperatures in the preceding DJF for ERA Interim (c) and the near-surface air temperature for N216 ensemble mean (d). The precipitation time series used for the correlation with ERA Interim variables is that used in figure 1 (observations). For the N216 ensemble, each member is correlated with its precipitation signal before averaging the ensemble correlations.
Download figure:
Standard image High-resolution image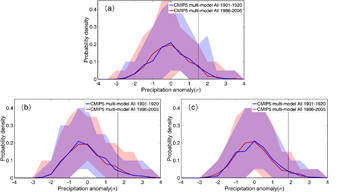
Figure 5. The probability density functions (PDFs) of May monthly precipitation anomaly estimated from CMIP5 models for 1901–1920 and 1986–2005 respectively in the three parts of the study region: (a) the whole target region, (b) the northern part of the target region, (c) the southern part of the target region. Blue lines correspond to the CMIP5 multi-model mean for 1901–1920; red for 1986–2005; corresponding shadings denote the full range of 37 CMIP5 models. The vertical lines are the standardized observed precipitation anomalies of May 2016, which are chosen as the thresholds.
Download figure:
Standard image High-resolution image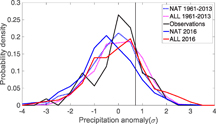
Figure 6. The probability density functions (PDFs) for the standardized anomaly of May mean precipitation difference between the northern sub-region and the southern sub-region. Red lines correspond to HadGEM3-GA6 all forcings run (ALL); blue is natural forcings only run(NAT); dashed lines indicate historical (1961–2013) PDF and solid lines indicate 2016; black indicates observations. The black vertical line is the value for 2016.
Download figure:
Standard image High-resolution image
The link between the El Niño Southern Oscillation (ENSO) signal and the spring precipitation over the Yangtze river has been demonstrated in several studies (Zhang and Sumi 2002, Ying et al 2015, Zhai et al 2016). As it is a main control of the precipitation inter-annual variability, it is important to verify that the model can reproduce this link. To do so, the correlation between May precipitation and May sea level pressure is computed. The correlation with the previous winter surface temperature is also computed (when ENSO signal is the strongest). Results are displayed in figure 4 for ERA Interim reanalysis and for the ensemble mean of 15 members of the N216-ALL simulations. This analysis was also conducted with the NCEP-NCAR reanalysis. Results were found to be very close to ERA Interim and are not displayed. The sea level pressure correlation during May (figures 4(a) and (b)) shows a clear positive pattern over the western North Pacific, associated with an anticyclonic anomaly and an increased transport of moisture from the tropics along the East China coast. Moreover, the ENSO signal is clear in the winter temperature (figures 4(c) and (d)) for both model simulations and reanalysis. Although ENSO may be climate change influenced, ENSO variability, even in the 21st century seems to be within the bounds of the natural variation range based on model simulations (Chen et al 2017). The correlations in the model and in reanalysis show consistent patterns which are closely related to May precipitation over the Yangtze river. Along with greenhouse warming, the extreme rainfall events associated with ENSO events are expected to increase as frequency of extreme El Niño events increases (Cai et al 2014, 2015). A stronger correlation in the model simulations may be due to a too stronger impact of the ocean on the atmosphere, due to the SST forcing, or to other processes affecting the May precipitation not represented in the model. Nevertheless, it appears that the HadGEM3-GA6 N216 model is able to reproduce the main natural variability and is consistent with previous studies on interannual variability in the Yangtze river basin precipitation (Zhang and Sumi 2002, Ying et al 2015, Zhai et al 2016). Therefore, the shift in PDFs of both ALL and NAT experiments for May 2016 compared to climatology, as seen in figure 3, suggests that El Niño had a significant effect on rainfall for this region in 2016. Furthermore, the impact of El Niño seems to be greater than that of anthropogenic climate change in the lower Yangtze valley.
Interestingly, an effect from anthropogenic climate change on the changing risk of extreme precipitation is discovered for the two sub-regions. From the PDFs in figure 3(b), we find that the probability of the event occurring in the northern sub-region is larger in the ALL experiment for 2016 compared to the NAT experiment, with a RR of 1.64 ± 0.52. In contrast, risk of extreme precipitation in the southern sub-region shows a decline due to human-induced climate change (RR = 0.68 ± 0.22). To check the robustness of this result, 37 CMIP5 models are used to examine whether there exists same risk change of extreme May precipitation in ALL experiments. Change of risk in extreme May precipitation are estimated between the period 1986–2005 and the early period 1901–1920. For the whole region and southern region, there seems to be no significant anthropogenic impact on risk of regional extreme rainfall with the RR around 1. However, the RR rises to 1.17 ± 0.43 in the northern region. The risk change in extreme May precipitation is generally consistent with those achieved using HadGEM3-GA6, which demonstrates the results we get is not sensitive to the model selected. Notably, the extent of anthropogenic influence on these two sub-regions differs considerably. This highlights the spatial variability of rainfall and the sensitivity of extreme precipitation attribution to the selection of study region. More importantly, in the condition of nearly negligible human-induced risk change of extreme precipitation for the whole study region, anthropogenic influences played a role in increasing the probability of extreme precipitation events as intense as that in May 2016 in the northern sub-region and decreasing that in the southern sub-region. Thus, we have reason to believe that human influences have shifted the precipitation northwards in the study region. Similar detection was conducted on mean precipitation difference between the northern sub-region and the southern sub-region. The threshold for risk estimation is also selected as the standardized precipitation difference between the northern sub-region and the southern sub-region in May 2016. The result shown in figure 6 implies that human influences have increased the probability of positive anomaly of difference between the two regions, with a risk ratio of 1.73 ± 0.43 at 90% confidence level based on the threshold of May 2016. It evidences that human influences contribute to the shift of precipitation from the southern sub-region to the northern, thus causing the corresponding increase and decrease of occurring risk of extreme precipitation in the northern and southern sub-region respectively. Based on the urban map of East Asia (Schneider et al 2009, Zhang et al 2010), several megacities like Shanghai, Nanjing, and Hangzhou are clustered in the northern sub-region. This region of high urbanization which is exposed to higher risks of extreme precipitation due to anthropogenic influence has implication for city planning and mitigation of extremes.
5. Conclusion
In May 2016, persistent extreme precipitation was observed over the region located in the lower reaches of the Yangtze valley. We find that the increasing likelihood of an extreme rainfall event as intense as that observed in May 2016 is mainly attributable to natural variability, presumably the strong El Niño of 2015–2016, with a risk 2.4 times as large as the climatology. The attributable contribution from anthropogenic climate change is negligible. Interestingly, for the southern sub-region, human influences appear to have reduced the risk of such event with precipitation greater than or equal to that observed in May 2016. Conversely, anthropogenically forced climate change has increased the probability of this kind of intense rainfall in the northern sub-region by a factor of 1.64. Through it is difficult to estimate the role of ENSO on the risk of precipitation extremes using CMIP5 simulations, results show the change in risk of extreme precipitation due to all forcing changes between two periods, presumably dominated by changes in anthropogenic forcing, in CMIP5 models is consistent with HadGEM3-GA6 model. This evidences that the results we found is not sensitive to the model used. Further attribution on precipitation difference between the two regions evidences that anthropogenic influences have shifted precipitation from the southern sub-region to the northern, thus causing the corresponding increase and decrease of occurring risk of extreme precipitation in the two sub-regions respectively.
Acknowledgments
We thank Dr Siyan Dong for helpful comments and discussions. LC and JX were funded by the National Key R&D Program of China (2016YFA0600400) and the National Natural Science Foundation of China (NFSC, 41605066), QT was funded by the NFSC (41675074) and Climate Change Project (CCSF201704), RY was funded by the Postgraduate Research and Practice Innovation Program of Jiangsu Province (KYLX16_0941), and BZ was funded by the NFSC (41575094). This work was largely carried out during a workshop on Operational Attribution at the University of Edinburgh supported by the UK-China Research & Innovation Partnership Fund through the Met Office Climate Science for Service Partnership (CSSP) China as part of the Newton Fund, China.