

Abstract
Carbon dioxide (CO2) emissions from fossil fuels and industry comprise ~90% of all CO2 emissions from human activities. For the last three years, such emissions were stable, despite continuing growth in the global economy. Many positive trends contributed to this unique hiatus, including reduced coal use in China and elsewhere, continuing gains in energy efficiency, and a boom in low-carbon renewables such as wind and solar. However, the temporary hiatus appears to have ended in 2017. For 2017, we project emissions growth of 2.0% (range: 0.8%−3.0%) from 2016 levels (leap-year adjusted), reaching a record 36.8 ± 2 Gt CO2. Economic projections suggest further emissions growth in 2018 is likely. Time is running out on our ability to keep global average temperature increases below 2 °C and, even more immediately, anything close to 1.5 °C.
Export citation and abstract BibTeX RIS

Original content from this work may be used under the terms of the Creative Commons Attribution 3.0 licence.
Any further distribution of this work must maintain attribution to the author(s) and the title of the work, journal citation and DOI.
Global temperatures continue to rise. The five warmest years of average global temperatures have all occurred since 2010, and 16 of the 17 hottest years on record have come since 2000 (NOAA 2017). This year is on track to be the second warmest year after last year's peak. Reducing greenhouse gas emissions remains a priority for industrial and land-based activities (Seneviratne et al 2016, Huntingford and Mercado 2016).
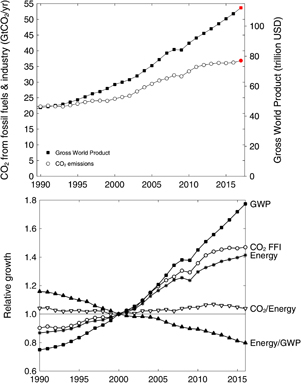
Figure 1. Upper panel: global CO2 emissions from fossil-fuel use and industry (open circles) and gross world product expressed as purchasing power parity (filled squares; World Bank 2017) since 1990. The red symbols are projections for 2017. Lower panel: relative to year 2000, gross domestic product, global CO2 emissions from fossil-fuel use and industry, global energy use (BP 2017), CO2 intensity of the energy system (global CO2 emissions from fossil-fuel use and industry divided by global energy use), and energy intensity of the global economy (global energy use divided by global GDP) from 1990–2017.
Download figure:
Standard image High-resolution image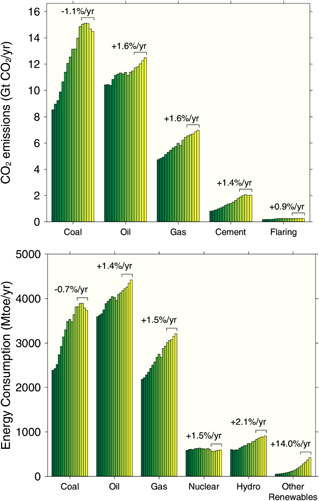
Figure 2. Upper panel: annual global CO2 emissions from fossil-fuel use and industry from 2000 to 2016, with average annual growth shown from 2012–2016. Lower panel: energy consumption by fuel source (million tonnes of oil equivalents) from 2000–2016 (BP 2017).
Download figure:
Standard image High-resolution image
Figure 3. CO2 emissions from fossil fuel use and industry since 1960 for China, the United States, the European Union, India, and the rest of the world (ROW), with open symbols representing projections for 2017. Emissions estimates and leap-year adjusted changes for 2017 are: China (10.5 Gt CO2; +3.5%), the United States (5.3 Gt CO2; −0.4%), the European Union (3.5 Gt CO2; −0.2%), India (2.5 Gt CO2; +2.0%), and the rest of the world (15.1 Gt CO2; +2.3%). Data are from the Global Carbon Project and the Carbon Dioxide Information Analysis Center (CDIAC).
Download figure:
Standard image High-resolution image
As temperatures continue to rise, a temporary stabilization in CO2 emissions from fossil fuel use and industry between 2014 and 2016 appears to be ending, at least in 2017 (figure 1). From 2014–2016, global gross domestic product (GDP) rose steadily, accompanied by minimal growth of 0.4% yr−1 in CO2 emissions from fossil fuels and industry (Le Quéré et al 2016, 2017, Jackson et al 2016,). This trend of rapid decoupling of emissions from economic output was driven firstly by improvements in energy efficiency and secondly by lower carbon intensities, including reduced coal use in China and the United States and growth in low-carbon renewables such as wind and solar in many parts of the world (Peters et al 2017). For 2017, however, we project emissions growth of 2.0% (range: 0.8%−3.0%) from 2016 levels (leap-year adjusted), reaching 36.8 ± 2 Gt CO2 (10.0 ± 0.5 Gt C; Le Quéré et al 2017). The projected increase is driven by sectoral and national changes, some of which we explore briefly below.
Despite a record installation of 161 GW of renewable generating capacity in 2016 (REN21 2017), global fossil fuel use continues to rise (figure 2). Global coal consumption dropped −1.7% in 2016 and by −0.7% averaged over the past five years, but is projected to increase in 2017. Global oil and natural gas use both rose ~1.5% in 2016. Oil consumption increased to 97 million barrels per day (bpd) and is expected to rise a further 1.7% in 2017 (IEA 2017). In fact, global demand for oil is expected to cross the 100 million bpd threshold within a few years, potentially surpassing coal as the largest source of CO2 emissions within a decade (figure 2). Annual growth in total oil consumption of ~3% or more in the Asia-Pacific region has contributed the most to this increase, although consumption there is still at lower per capita rates than in the United States and the European Union.
One surprise over the past 15 years is how little change there has been in the CO2 emissions per unit of primary energy consumption (figures 1 and 2). From 2000–2016, primary energy consumption and CO2 emissions from fossil fuel use both increased ~40% globally (figure 1). In contrast, the fossil fuel use per unit of GDP decreased steadily, driven primarily by greater energy efficiency and structural change (e.g. lower primary energy consumption per unit GDP; figure 1). The global economy is using less energy to produce a unit of wealth, partially because of the higher relative growth of low-carbon products and services. However, the additional energy used to produce more goods still comes primarily from fossil fuels. From 2000−2016, ~80% of the increased primary energy supply (~4 billion tonnes of oil equivalents globally) is attributable to new oil, coal, and natural gas production, with coal supply increasing the most (figure 2).
National emissions changed substantially in 2017 compared to 2016 for several countries (figure 3). China's CO2 emissions were stable in 2016 but are projected to rise 3.5% to 10.5 Gt CO2 this year (range 10.2–10.7 Gt CO2); coal, oil, and natural gas use are expected to increase ~3.0%, 5.0%, and 12%, respectively (Le Quéré et al 2017). In contrast, we expect India's emissions to rise only 2.0% in 2017 to 2.5 Gt CO2 (range 2.4–2.5 Gt CO2), compared to an increase of 6.7% in 2016 and an annual average increase of almost 6% over the past decade. Although India's installed solar capacity almost doubled in 2016 to 12 GW, the reduction in this year's growth is attributable to many factors, including reduced exports, a declining share of industrial and agricultural production in GDP, reduced consumer demand, and both a sudden fall in money circulation attributable to demonetization late in 2016, and a goods and services tax introduced in 2017. If India's economy recovers quickly from these interventions, emissions growth there would be expected to return to previous levels of more than 5% in 2018. Modest reductions in 2017 of −0.4% and −0.2% projected for the United States (5.3 Gt CO2; range 5.2–5.4 Gt CO2) and the European Union (3.5 Gt CO2; range 3.4–3.5 Gt CO2), respectively, are not large enough to offset increases in China, India, and the rest of the world, where CO2 emissions are expected to rise 2.3% in 2017 to 15.1 Gt CO2 (14.8–15.3 Gt CO2) based on projected increases in GDP (Le Quéré et al 2017).
Whether CO2 emissions will continue to rise in 2018 and beyond is unclear. One positive sign is the number of countries where emissions are declining. Over the past decade, 22 countries have seen GDP growth while CO2 emissions from fossil fuel and industry declined significantly (95% confidence level): Austria, Belgium, Bulgaria, Czech Republic, Denmark, France, Hungary, Ireland, Latvia, Lithuania, Luxembourg, Macedonia, Malta, Netherlands, Poland, Romania, Serbia, Slovakia, Sweden, Switzerland, United Kingdom, and United States (Le Quéré et al 2017). These countries comprise 20% of such emissions globally.
Despite this good news, short-term emissions growth appears likely. The World Bank projects global growth in GDP to reach 2.9% in 2018, its highest value since 2011, with the IMF's projection of 3.7% even higher. Producing more goods could increase fossil fuel emissions despite downward pressure from improved energy efficiency and low-carbon fuels. Regardless of the precise growth rate, fossil fuel emissions remain at historic highs, reaching a record level of 36.8 ± 2 Gt CO2 in 2017. At current annual rates of ~41 Gt CO2 for fossil fuels, industrial and land-use emissions combined (Le Quéré et al 2017), time is running out on our ability to keep global average temperature increases below 2 °C and, even more immediately, anything close to 1.5 °C (Rogelj et al 2015). Nothing short of deep and rapid decarbonization will keep the Earth from surpassing the 1.5 °C average temperature threshold in as little as a decade, and 2 °C a few decades after that.
Acknowledgments
The authors acknowledge the many scientists and funding agencies whose efforts and support contributed to the Global Carbon Budget 2017 released by the Global Carbon Project (globalcarbonproject.org). We acknowledge support from Stanford University, Future Earth, and the Gordon and Betty Moore Foundation (RBJ), the Australian Government's National Environmental Science Programme's Earth Systems and Climate Change Hub (JGC), and the Norwegian Research Council (Project #209701) (GPP and RMA).