

Abstract
Understanding the global mass inventory is one of the main challenges in present research on plastic marine debris. Especially the fragmentation and vertical transport processes of oceanic plastic are poorly understood. However, whereas fragmentation rates are unknown, information on plastic emissions, concentrations of plastics in the ocean surface layer (OSL) and fragmentation mechanisms is available. Here, we apply a systems engineering analytical approach and propose a tentative 'whole ocean' mass balance model that combines emission data, surface area-normalized plastic fragmentation rates, estimated concentrations in the OSL, and removal from the OSL by sinking. We simulate known plastic abundances in the OSL and calculate an average whole ocean apparent surface area-normalized plastic fragmentation rate constant, given representative radii for macroplastic and microplastic. Simulations show that 99.8% of the plastic that had entered the ocean since 1950 had settled below the OSL by 2016, with an additional 9.4 million tons settling per year. In 2016, the model predicts that of the 0.309 million tons in the OSL, an estimated 83.7% was macroplastic, 13.8% microplastic, and 2.5% was < 0.335 mm 'nanoplastic'. A zero future emission simulation shows that almost all plastic in the OSL would be removed within three years, implying a fast response time of surface plastic abundance to changes in inputs. The model complements current spatially explicit models, points to future experiments that would inform critical model parameters, and allows for further validation when more experimental and field data become available.
Export citation and abstract BibTeX RIS

Original content from this work may be used under the terms of the Creative Commons Attribution 3.0 licence.
Any further distribution of this work must maintain attribution to the author(s) and the title of the work, journal citation and DOI.
Introduction
Contamination of the marine environment with plastic debris has received considerable interest from the public, policymakers and the scientific community (Rochman et al 2016). One central question is whether plastic debris poses a risk to marine ecosystems, a question that to date cannot be answered for several reasons. First, a risk assessment for plastic debris would start with assessing exposure in the wide variety of marine habitats, which is complicated because, unlike traditional contaminants, plastic items and particles come in an extremely wide variety of sizes, types and properties. Plastic items and particles tend to sink and change properties over time due to weathering, embrittlement, fragmentation and fouling (Andrady 2015), processes whose rates are poorly known. Second, due to the heterogeneity of plastics and the wide variety of associated chemical contaminants, the (toxic) effect mechanisms are manifold, causing widely differing responses in individuals and species with different biological traits (Diepens et al 2015, Rico and van den Brink 2015, Kühn et al 2015). Third, besides heterogeneity in the nature, state and effects of plastic debris, its abundance in the marine environment is extremely variable on spatial scales ranging from meters to hundreds of kilometers, with considerable uncertainty in the processes governing distributions between ocean surface, water column and deep sea sediments (Galgani et al 2015). Hence, closing the global inventory of ocean plastics is one of the main challenges in present research on marine debris (Thompson et al 2004, Hardesty et al 2017). Fourth, on the scale of the oceans the distribution of macroplastics (MA; defined here as > 5 mm) and microplastic (MI; defined here as 335 µm−5 mm) cannot be adequately measured with methods currently available. Also, for plastic particles smaller than 0.335 mm, no methods are currently available to systematically assess their mass distribution in the ocean. We pragmatically refer to this smallest (indeterminate) size class as 'nanoplastic', but we do not explicitly include particles exhibiting colloidal behavior in a fluid.
These four reasons cause the retrospective assessment of fate, bioavailability and ecological effects to be a very challenging task. Hence, for the time being, a prospective ecological risk assessment (ERA) for plastic debris has to rely on large-scale modeling.
Within the context of ERAs for traditional ecological stressors, tiered approaches are frequently used (Posthuma et al 2008). Tiered approaches tailor the complexity of the assessment tools within a tier to the specific requirements of that tier, where lower tiers typically are conservative, fast and relatively simple. Hence, rather than addressing all the aforementioned variability and mechanistic detail on a spatiotemporally explicit scale, understanding the global inventory of plastic (its sources, transformation processes and sinks) on an average 'whole ocean' scale, is a first useful step in a prospective lower-tier exposure assessment for plastic debris. This approach complements recent studies that estimate the global inventory from the 'bottom-up' using ocean measurements (Thompson et al 2004, Eriksen et al 2014, Cózar et al 2014, van Sebille et al 2015). A problem often mentioned is that abundance data exist only for plastic debris at the ocean surface and only for particles larger than the ~ 0.3 mm mesh of most nets, and that loss processes from the ocean surface are poorly known, thus leaving the actual quantity of plastic unknown and its fate unexplained (Cózar et al 2014). However, annual plastic production data are available (Plastics Europe 2013), as well as estimates of plastic debris abundances at the ocean surface (Eriksen et al 2014). Furthermore, it is known that chemical degradation of polymers results in weakening and fragmentation, and that biological colonization and aggregation can induce sinking of buoyant polymers (Kooi et al 2017). We argue that by combining these data with quantitative process descriptions we can estimate apparent 'whole ocean' in situ fragmentation rates for plastic debris as a useful first step for future scenario studies regarding plastic debris. Rather than seeking deterministic detail with respect to all complexities of the system, we adopt a systems engineering analytical approach in order to mechanistically assess past, present and future abundances of plastic debris in the oceans.
Below we present an analytical mass balance model, describe its main underlying assumptions and its parameterization, and apply it to empirical data. The main aim of this paper is to present a heuristic theoretical model that could potentially close the global ocean plastic inventory, and to apply it to the best available data in order to calibrate the model. While this model is certainly not a perfect representation of plastic in the real ocean (as no model can ever be), the model presented here is tractable and solvable, and can thus be used to gain further understanding into which processes dominate the fate of ocean plastic. Such analytical, zero-dimensional models have been extremely useful in other complex problems in systems ecology, econometrics and statistical physics. The secondary aims are to generate first estimates of 'whole ocean' in situ plastic fragmentation rates, and to predict future 'whole ocean' plastic abundances at the ocean surface under three emissions scenarios.
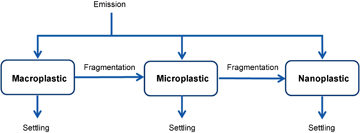
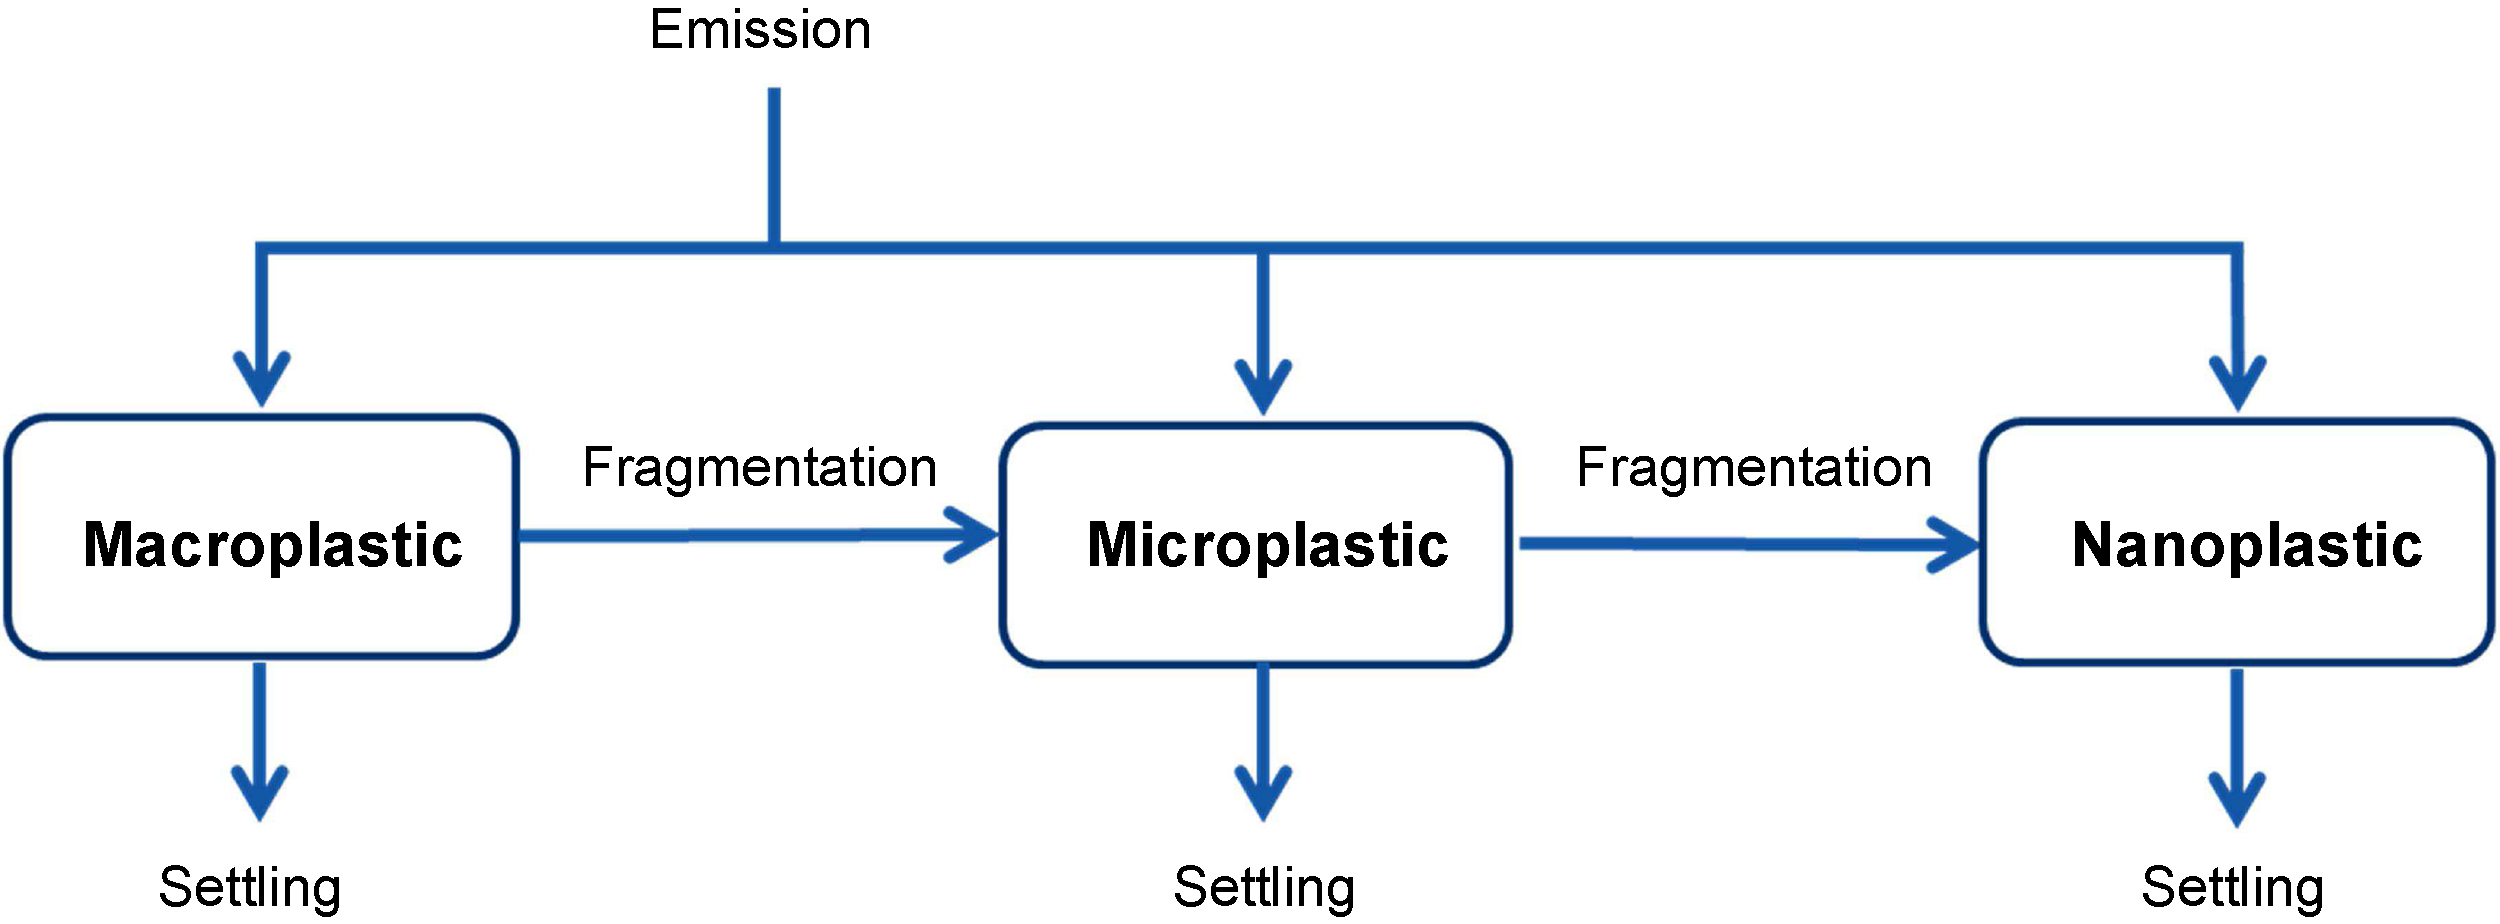
Figure 1. Scheme of the whole ocean emission-fragmentation-settling mass balance model. Known annual emission data are partitioned into macro-, micro- and nanoplastic emissions to the ocean surface layer (OSL). In the OSL, fragmentation from (> 5 mm) macro- to (0.335–5 mm) micro- to (< 0.335 mm) 'nanoplastic' and agglomeration/aggregation of nanoplastic takes place, together with settling to the deeper ocean layers.
Download figure:
Standard image High-resolution imageA whole ocean emission-fragmentation- settling mass balance model
Model assumptions—There are ten assumptions underlying the model approach (figure 1):
- 1.Input of plastic to the oceans can be estimated from annual global plastic production data.
- 2.A constant fraction of this annual production reaches the oceans and is initially buoyant, entering at the surface.
- 3.The plastic particles emitted to and present in the oceans are separated into three operationally defined size fractions: macroplastic, microplastic and nanoplastic particles.
- 4.Macro-, micro-, and nanoplastics comprise constant fractions of the total annual input to the oceans.
- 5.Particles are first considered as spheres, and then are corrected for non-sphericity using (approximate) shape correction factors.
- 6.Macro- and microplastics are subject to degradation, abrasion and fragmentation processes (hereafter collectively referred to as 'fragmentation') occurring either in the water or inside organisms, the mass-based rates of which are proportional to the surface area of the particles.
- 7.Macro- and microplastics are subjected to (net) sedimentation, which can occur either as immediate settling for the fraction of emitted plastic with a density greater than seawater, or as a result of biofouling or by entrainment in biological aggregates (including fecal pellets after ingestion) for plastics with a density lower than seawater.
- 8.The mass balance for initially buoyant macroplastics has the macroplastic fraction of the annual plastic production as gain, and sedimentation and fragmentation to microplastics as loss processes.
- 9.The mass balance for initially buoyant microplastics has the microplastic fraction of annual emission plus fragmentation from macroplastics as inputs, and sedimentation plus fragmentation to nanoplastic particles as loss processes.
- 10.At all times, the difference between the cumulative mass of plastic emitted to the oceans and the mass of macro- and microplastics in the OSL equals the sum of (a) emitted plastic with a density greater than seawater, (b) the mass of settling microplastics, and (c) the mass of nanoplastics.
For a more detailed motivation of these assumptions the reader is referred to the supplementary material available at stacks.iop.org/ERL/12/114028/mmedia. However, it is useful to provide background to a few processes that are not explicitly modeled here. First of all, plastic debris on shorelines is part of the fraction residing on land and thus is omitted from the analysis through assumption 2. Ingestion of plastic debris by marine organisms is a reason for concern when considered from a risk perspective. However, we omitted it from the mass balance equations for two reasons. First, the loss rate through ingestion is small compared to the other loss mechanisms. After all, Desforges et al (2015) report marine zooplankton in the OSL of North Pacific food webs to ingest a negligible < 0.07% of the microplastic number concentration. Ingestion by seabirds has been estimated at ~100 tons per year at present (Van Franeker 2011a), and ingestion by mesopelagic fishes in the North Pacific is an estimated 12–24 thousand tons per year (Davison and Asch 2011), whereas our modeled removal is an excess of 9.4 million tons for 2016 (see below). Even if we would take the estimate of 12–24 thousand tons per year for fish in the North Pacific ten times higher to cover the world oceans, the ingested quantities still would have a negligible effect on the mass balance. Second, ingestion of plastic debris by marine organisms is not considered a permanent sink. After ingestion and gut passage, microplastics generally are egested (eg. Cole et al 2013, Choy and Drazen 2013, Van Franeker et al 2011b) and return to the OSL, which would result in a time-delay in the OSL abundance that can be assumed to be small and relatively constant in time. Alternatively, egested plastics are known to settle in fecal pellets (Cole et al 2016), which is accounted for in assumption 7.
Model equations—The change in the mass of buoyant macroplastics (> 5 mm) over time is calculated using:
in which MAt is the mass of buoyant macroplastic in the OSL (million tons; MT), t is time (yr), Pt is the world plastic production (MT × yr−1), A is the fraction of the world plastic production that enters the oceans (dimensionless), B is the fraction of emitted plastic which is buoyant (dimensionless), C is the fraction of emitted plastic present as microplastic (dimensionless), D is the fraction of emitted plastic present as < 0.335 mm 'nanoplastic' (dimensionless) AMA,t is the time varying total surface area of all the macroplastic present in the OSL (m2), kF (m−2 × yr−1) is the apparent whole ocean surface-area normalized plastic fragmentation rate constant,  (m × yr−1) is the apparent sedimentation rate from the OSL and H (m) is the assumed depth of the OSL (table 1). Subscripts 't' relate to variables that change over time. In equation (1), the first term quantifies the input of buoyant macroplastic to the OSL. The second term quantifies transformation of macroplastic to microplastic due to fragmentation. The third term quantifies removal due to sedimentation.
Table 1. Alphabetical overview of model parameters and variables, their meaning, units and default values.
| Parameter | Meaning | Unit | Default valuea |
|---|---|---|---|
| αMA | non-sphericity shape correction factor for macroplastic | — | 30 |
| αMI | non-sphericity shape correction factor for microplastic, | — | 2 |
| A | fraction of Pt that ends up in the oceans | — | 0.03 |
| AMA,t | time varying total surface area of macroplastic in the OSL | m2 | equation (3). |
| AMI,t | time varying total surface area of microplastic in the OSL | m2 | equation (3). |
| B | fraction of emitted plastic with density lower than seawater (buoyant plastic) | — | 0.62 |
| C | fraction of emitted plastic present as microplastic | — | 0.01 |
| Pt | world plastic production | MT × yr−1 | Pt = 0.0843t2−0 8015t + 3.0191(Koelmans et al 2016) |
| H | Average thickness of the OSL | m | 100 |
| kf | apparent whole ocean surface-normalized plastic fragmentation rate constant | m−2× yr−1 | Fitted |
| LPtNN | 'lost plastic' based on what is detected using 335 µm neuston net (NN) sampling. | MT | equation (4) |
| MAt | mass of macroplastic in the OSL | MT | equation (1) |
| MIt | mass of microplastic in the OSL | MT | equation (2) |
| rMA | representative radius of macroplastic | m | 0.1 |
| rMI | representative radius of microplastic | m | 0.0012 |
| t | time | yr | 1950–2100, dependent on scenario |
| VSMA | apparent macroplastic sedimentation rate from the OSL | m × yr−1 | 0 |
| VSMI | apparent microplastic sedimentation rate from the OSL | m × yr−1 | Fitted |
| σpl | average density of the plastic | tons × m−3 | from VSMIb |
aSource in main text unless indicated otherwise. bcalculated from VSMI and an average OSL seawater density of 1025 kg m−3 using the reversed Stokes equation.
The change in the mass of initially buoyant microplastic (0.335–5 mm) over time can be calculated using:
in which MIt (MT) is mass of buoyant microplastic in the OSL, AMI,t (m2) is the time varying total surface area of all the microplastic present in the OSL and  (m × yr−1) is the apparent sedimentation rate from the OSL (table 1). The first, third and fourth term in equation (2) quantify emission, fragmentation and settling of microplastic in the same way as it is modeled for macroplastic. The second term in equation (2) quantifies the input from fragmentation of macroplastic, which is calculated in equation (1). The total surface area of macro- and microplastic (AMA,t, AMI,t) is calculated from the mass of macro- and microplastic as (detailed explanation provided as supplementary material):
in which σpl is the average density of the plastic material (tons × m−3), αMA and αMI are dimensionless non-sphericity shape correction factors, and rMA and rMI (m) are the representative radii of the macro- and the microplastic particles, respectively (table 1). The third term  in equation (2) represents the fragmentation to particles smaller than microplastics (< 0.335 mm, an operationally defined limit based upon microplastics measurements with plankton nets), which may be referred to as nano-fragmentation (Cózar et al 2014). The resulting 'nanoplastics', together with the microplastics removed from the OSL by biologically-mediated settling (Kooi et al 2017), and the directly settling non-buoyant plastics are hypothesized to represent the 'lost plastic' (Thompson et al 2004, Cózar et al 2014, van Sebille et al 2015), that is, plastic that in the literature is referred to as 'lost' based on what is detected using 0.335 mm neuston net (NN) sampling (
 ). Conceptually,
  thus is defined as the mixture of directly settled non-buoyant macroplastic, settled <5 mm non-buoyant and buoyant plastic, and plastics that slips through the 0.335 mm neuston net. It is calculated from the mass balance as:

There is no empirical information about the < 0.335 mm 'nanoplastic' abundance and settling behavior in the OSL or in the deep ocean. Nanoplastics in the OSL (NPt) are assumed to be formed from fragmentation of microplastics (Koelmans et al 2015) (third term in equation (2)) and are assumed to be removed from the OSL by heteroaggregation-sedimentation (Peijnenburg et al 2015). If aggregation is sufficiently fast, the latter process can be approximated by first order removal (Quik et al 2014) whereas the settling aggregate flocs can be assumed to have the same settling rate from the OSL as microplastics (with settling rate  ) (Velzeboer et al 2014). The settling from the OSL does not automatically imply that the fragmented nano- and microplastic particles reach the ocean floor. It is plausible that part of them start to oscillate at an intermediate depth as was recently shown by Kooi et al 2017. Because of the limited information and uncertainty with respect to these assumptions, we refrained from including the transport or fate of nanoplastics in the main analysis of this paper and provide it as supplementary material (figure S1).
Motivation of model assumptions and default parameter values
A detailed motivation of model assumptions and default parameter values is provided as supplementary material. An overview of model parameters and variables, their meaning, units and default values is provided in table 1.
Model calibration, scenario studies, sensitivity analysis and probabilistic uncertainty analysis
No detailed data on micro- and macroplastic of all sizes over time and for surface and deeper ocean layers is available. This implies that our model study has to remain theoretical and conceptual. Still, the model was defined in such a way that it can simulate micro- and macroplastic abundances reported in recent papers, which allows for calibration of the model parameters that could not be estimated from first principles. The differential equations were solved numerically in RStudio (RStudio 2015) using a 4th order Runga Kutta integrator. We calibrated the model using data provided by Eriksen et al (2014), who estimated both macroplastic and microplastic abundances based on recent available data. Parameters kF and  were optimized until MAt and MIt for 2010 matched the data provided by Eriksen et al (2014).
For the future, three additional hypothetical scenarios were explored: a business as usual (BAU) future emission scenario, a constant emission (CE) scenario, and a zero emission (ZE) scenario. The BAU scenario assumes that annual plastic production and leakage/emission continue to increase according to the polynomial parameters derived from 1950–2013 data (PlasticsEurope 2013, Koelmans et al 2016). The CE scenario assumes that annual plastic production stays at a constant level from July 2016 onwards. The ZE scenario explores what would happen if (theoretical) leakage of plastic to sea were reduced to zero from July 2016 onwards.
The sensitivity of the model output to changes in the parameter values will differ among parameters. A basic sensitivity analysis was performed by quantifying the percentage change in the model output (2010 micro- and macroplastic abundance in the OSL), upon a +10% change in each of the model parameters A, B, C, D, H, rMA, rMI, αMA, αMI, kF and  .
.
The uncertainties in modeled MI and MA abundances in the OSL were assessed in two steps. First, distributions of kF and  were obtained by fitting them to 5000 parameter sets randomly drawn from preset parameter distributions (table S4). It appeared that uncertainty in kF could be described with a log-triangular distribution with boundaries at log kF of −7.3 and −5.7 (figure S2).
  appeared to be statistically significant log-normal distributed (figure S3) and boundaries in log
  were set at ± 1.96 × SD. Second, distributions for predicted MA, MI, NP and LP were calculated for 1950–2016 by Monte Carlo model simulations (10 000 iterations) using the same preset parameter distributions (table S4) and uncertainty estimates derived from the distributions for kF and
  obtained in step one. A detailed specification and motivation of parameter uncertainties is provided as supplementary material.
Results and discussion
Evaluation of optimized parameters
Optimization of kF and  resulted in an accurate fit to the micro- and macroplastic abundances in the whole ocean average OSL as reported by Eriksen et al (2014). The simulation started with a production (Pt) of 1.7 tons per year in 1950 (Plastics Europe 2013), even though in reality some plastic was produced (and likely released) before 1950. This omission of pre-1950 data plays a role only in the first few years with a low plastic abundance and therefore has a negligible effect on the parameter estimates. After the initial emissions input at the start of the simulation, fast fragmentation of macroplastics outpaced emissions, causing a decline in the total amount of MA (figure 2(a)) until the late 1950s. Because plastic emissions have increased rapidly, the macro- and microplastic abundances continued to steadily increase until present, indicating that concentrations in the OSL have not yet reached a steady state. The net accumulation rates in 2010 are 4210 and 1130 tons yr−1 for macro- and microplastics in the OSL, respectively. These are net rates because they account for the loss processes of fragmentation and settling. The mass of < 0.335 mm nanoplastic in the OSL is calculated to be 5430 tons in 2010 (figure S1). This is a very provisional indication, because parameters for nanoplastics are very uncertain, as mentioned above.

Figure 2. Simulation of macro- and microplastic mass in the ocean surface layer (OSL) from 1950 to present time (a). 'Measured' refers to the estimates provided by Eriksen et al (2014). Simulation of the sum of macro- and microplastic in the OSL ('surface plastic') together with the 'lost plastic', that is all plastic that has been removed from the OSL by settling and nanofragmentation (b).
Download figure:
Standard image High-resolution imageIn the early years of plastic production, the losses of small fragmented and settled macro- and microplastics to deeper layers in the ocean ( ) are about two orders of magnitude higher than the total abundance of plastic (MA + MI) in the OSL (figure 2(b)), which slowly grows to a three orders of magnitude discrepancy by 2010. By 2016, 99.8% (196 million tons) of all plastics that had entered the ocean since 1950 had settled to depths below the OSL, whereas the net loss from the OSL in 2016 was 9.4 million tons per year. The remaining OSL mass consisted of 83.7% macroplastic (258700 tons), 13.8% microplastic (42 570 tons) and 2.5% (<0.335 mm) nanoplastic (7750 tons).
The estimated parameter values for microplastic settling rate  and (surface area-normalized) plastic fragmentation rate kF were 33.8 m d−1 and 1.05 × 10⁻⁷ m−2 yr−1 respectively. The credibility of these values can be assessed by comparison to literature values. For instance, McDonnell and Buesseler (2010) found settling rates of marine particles to vary between 10 to 150 m d−1, which is fairly consistent with the value of 3.4−34 m d−1 that we calculate if we assume values for OSL thickness H of 10−100 m. A range of 10–100 m applies to the vast majority of locations in the world oceans (de Boyer Montégut et al 2004). Long et al reported settling rates around 50 m d−1 for small aggregates of settling algae with and without microplastic incorporated (Long et al 2015). Cole et al reported an average settling rate of 38.3 m d−1 for microplastic incorporated in fecal pellets egested by marine zooplankton (Cole et al 2016). Thus, our mass balance model returns settling rates that are consistent with laboratory and environmental data, which supports the credibility of the model. Microplastics incorporated into biological aggregates have been reported to slow the settling rate by reducing their density (Long et al 2015, Cole et al 2016). This can explain the somewhat lower settling rate that we found, compared to those for marine particles. The settling rate for initially buoyant macroplastic was assumed to be negligible, nevertheless we tested this assumption by assigning a range of settling rates or by allowing the model to fit an optimum
  . Interestingly, no good fit was obtained with any positive value for the macroplastic settling rate (
 ) and random optimization always returned a value of zero for this parameter. This supports the assumption of a negligible or small settling rate for initially buoyant macroplastic.
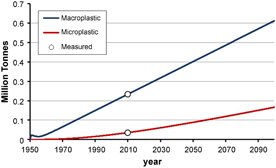
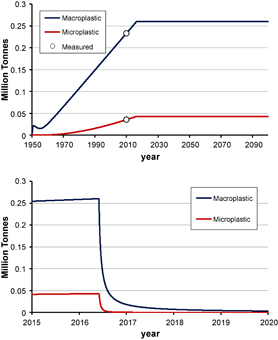
Figure 3. Simulation for the 'business as usual' (BAU) scenario, assuming ongoing emissions of plastic following the polynomial trend that has been observed from 1950 until present time. In the year 2100, masses of macro- and microplastic in the OSL have increased by roughly a factor of three (MA = 0.613 MT, MI = 0.167 MT).
Download figure:
Standard image High-resolution imageFor the plastic fragmentation rate kF of 1.05 × 10⁻⁷ m−2 yr−1 it is more difficult to find literature data for comparison. However, given this value, the model predicts removal from the OSL within about three years (discussed below), which can be considered fast. That plastics disappear from the sea surface on relatively short time scales is consistent with recent observations showing a steep reduction in pre-production plastic pellets since the 1980s in both the North Atlantic subtropical gyre and in North Sea fulmars (Van Franeker and Law 2015). The decreases in identifiable pellets are hypothesized to reflect reduced input after pellet loss prevention measures were instituted. This implies that microplastic disappears from the sea surface on relatively short time scales.
Sensitivity analysis
A 10% increase in the input parameters A, B, rMA, αMA and kF yields a 5% change in the macroplastic mass in the OSL estimated for 2010 (figure S4). For OSL microplastic the changes range between 2 and 9 % (figure S4). Changes are positive when the parameter governs a plastic source term whereas they are negative when they govern a loss term. The model is not sensitive to changes in the fraction of plastic input that is micro- or nanoplastic (parameters C and D), which implies that it is not sensitive to uncertainties in these parameters either. For microplastic, the sensitivity to changes in the settling rate ( ) is 6.6 times higher than that for the fragmentation rate (kF), which emphasizes the importance of settling in the overall removal of microplastic from the OSL and also the need for experimental data to constrain this parameter.
Uncertainty in model parameters and predictions
Uncertainty and variability in data is considered as one of the main factors hampering a realistic assessment of risks associated with plastic debris (Koelmans et al 2017). For the first time we provide a realistic probabilistic assessment of propagating error and uncertainty in estimated abundances of macro-, micro- and (< 0.335 mm) nano-plastic debris in the oceans (figure S1). The uncertainties expressed as SD are log-normally distributed and therefore symmetrical on a log scale (figure S1), and are ± 0.17, ± 0.43 and ± 1.17 for Log MA (MT), Log MI (MT), and Log NP (MT), respectively. Uncertainty thus is substantial, especially for micro- and nanoplastic, and results from uncertainty that propagates through the many model processes required to estimate their formation through progressive fragmentation and sinking.
Future emission scenarios
We explored three future plastic emission scenarios to illustrate possible consequences of changes of the emissions of plastic to sea. The 'business as usual' (BAU) scenario assumes ongoing emissions of plastic following the polynomial trend that has been observed from 1950 until present time (figure 3). In the year 2100, masses of macro- and microplastic in the OSL have increased by roughly a factor of three (MA = 0.6126 MT, MI = 0.1666 MT). In contrast, with the 'constant emission' (CE) scenario (figure 4(a)), plastic masses in the OSL show a steady state. It follows from equations (1) and 2 that steady state occurs when Pt is constant (PSS), and the steady state solution can be obtained by analytically solving equations (1) and (2) and S1 for  . These steady state solutions for the CE scenario are provided as supplementary material. The 'zero emission' (ZE) scenario simulates what would happen if plastic emissions were to stop instantaneously in July 2016. Keeping all other parameters the same, the model predicts a rapid removal of all plastic from the OSL within two to three years (figure 4(b)). An important implication of this zero emission scenario calculation is that it shows that mitigation strategies aiming for a reduction of emissions to the oceans would rapidly lead to lower concentrations of plastics in the OSL.
Figure 4. Simulations for the 'constant emission' (CE) scenario (a) and the 'zero emission' (ZE) scenario (b). The CE scenario shows that when emissions become constant, the concentration in the OSL reaches a steady state. The ZE scenario shows that an emission stop causes rapid removal of micro- and macroplastic from the OSL within three years.
Download figure:
Standard image High-resolution image
General discussion
The motivation for our study was to investigate some of the processes required to understand the global mass inventory of ocean plastics, including estimates of reservoirs and sinks for the 'missing plastic', using a mechanistic, analytical and tractable modeling approach. Our results suggest that fragmentation and settling can potentially explain a rapid removal of initially buoyant plastics from the near-surface ocean. These two processes are intricately linked since settling rates are determined by particle surface area, which increases with decreasing particle size upon fragmentation.
Our objective was not to present or validate a model that is able to predict plastic abundances in the oceans with certainty. Most parameters are poorly known and most parameters are educated guesses based on best available information. There is much uncertainty in the limited data on abundance of plastic debris in the oceans (Eriksen et al 2014, Cózar et al 2014, Van Sebille et al 2015). Most importantly, the model is a useful tool to evaluate the importance of particle fragmentation and settling. Our sensitivity and uncertainty analysis showed that the model is most sensitive to the estimates of the abundance of plastic debris in the OSL, followed by the estimates for the mass fraction of buoyant microplastic that enters the sea. Hence, future studies may focus especially at narrowing down this uncertainty in the predictions and parameter estimates for fragmentation and settling that we provided here.
As suggested in previous studies, the model supports the idea that the average macro- and microplastic debris in the OSL has fairly short residence time, which may have important implications for mitigation strategies. Reduction of plastic emissions to sea will lead to a fast decrease of the concentrations of plastics in the OSL, which would imply a direct decrease in the harmful effects of plastics in the OSL. Plastic debris items with much lower surface area-to-volume ratios than the average we used, may float in the oceans for much longer time, whereas much higher surface area-to-volume ratio macroplastics (e.g. very thin plastic bags and films) may disappear faster; such conditions can be easily simulated by altering model parameters.
Further validation of the model is recommended. This requires more and better data on the abundance of plastic debris, also for the smaller size classes (e.g. Song et al 2014, Enders et al 2015, Kanhai et al 2017). If the model results represent reality, there may be a tremendous mass of microplastic at depths greater than the OSL. The model suggests that the depth distribution of plastic debris changes over time, with an increase of the mass fraction of all plastic that is lost from the ocean surface. Sedimentation of plastic debris to the ocean floor has been confirmed in recent empirical and modeling studies (Kooi et al 2017). This means that we need to focus more attention on possible impacts to mesopelagic and benthic communities.
Acknowledgment
We are grateful to Laurent Lebreton for discussing and providing the error estimates for plastic abundances in the ocean surface layer as reported in Eriksen et al (2014), and to Julia Reisser for commenting on an earlier draft of the manuscript. EvS has received funding from the European Research Council (ERC) under the European Union's Horizon 2020 research and innovation programme (grant agreement No 715386). KLL was supported by the National Science Foundation (OCE-1260403).