

Abstract
The worldwide development of industry and agriculture has generated noticeable increases in atmospheric nitrogen (N) deposition, significantly altering the global N cycle. These changes might affect the global carbon (C) cycle by enhancing forest C sequestration. Here, we used a series of datasets from eight typical forests along the north–south transect of eastern China (NSTEC). These datasets contained information on community structure, C and N concentrations in the soil and the organs (leaf, branch, stem, and fine-root) of 877 plant species, and atmospheric wet N deposition. Using the biomass weighting method, we scaled up the C:N ratios from the organ level to the ecosystem level, and evaluated the C sequestration rate (CSRN) in response to wet N deposition and N use efficiency (NUE) in China's forests based on the principles of ecological stoichiometry. Our results showed that atmospheric wet N deposition had a modest impact on forest C storage. Specifically, mean CSRN was estimated as 231 kg C ha−1 yr−1 (range: 32.7–507.1 kg C ha−1 yr−1), accounting for 2.1% of NPP and 4.6% of NEP at the ecosystem level. The NUEeco of atmospheric N deposition ranged from 9.6−27.7 kg C kg−1 N, and increased with increasing latitude from subtropical to cold-temperate forests in China (P < 0.05). This study provides a new approach for estimating the effect of atmospheric deposition on forest C sequestration based on the principles of ecological stoichiometry.
Export citation and abstract BibTeX RIS

Original content from this work may be used under the terms of the Creative Commons Attribution 3.0 licence.
Any further distribution of this work must maintain attribution to the author(s) and the title of the work, journal citation and DOI.
1. Introduction
Forests represent significant carbon (C) sinks. For instance, Goodale et al (2002) showed that temperate and boreal forests in North America and Europe are important contributors to C sinks. Monsoon subtropical forests in East Asia also represent another important C sink, with a C uptake of 0.72 Pg C yr−1, which is comparable to forests in North America and Europe (Yu et al 2014). To date, scientists have explored the underlying mechanisms of forest C sinks using different approaches, leading to various mechanisms being proposed, including higher forest regrowth, forest growth resulting from climate change, forest management practices, and increased CO2 and atmospheric nitrogen (N) deposition (Reay et al 2008, Thomas et al 2010, Yu et al 2014). Therefore, it is necessary to evaluate the relative contribution of different underlying mechanisms that potentially enhance forest C sinks to manage and predict forest C cycles accurately under the various scenarios of global change (Thomas et al 2010).
In recent decades, atmospheric N deposition has rapidly increased in the terrestrial ecosystems of China, due to large emissions of reactive N caused by the growth of the human population, industrialization, and agricultural intensification (Jia et al 2014, Liu et al 2013, Zhu et al 2015). Increased atmospheric N deposition might have a major impact on forest C sequestration, because most forest ecosystems are N limited in China (Chen et al 2015, LeBauer and Treseder 2008). Some methods have been proposed to evaluate how atmospheric N deposition affects forest C sinks, including model simulations, N fertilizer experiments, empirical correlations between C uptake and N deposition, and the stoichiometric scaling approach (De Vries et al 2009, De Vries et al 2014). However, evaluating how forest C sequestration responds to atmospheric N deposition with high precision remains a major challenge, due to the complicated processes of external N uptake and allocation in natural ecosystems (Templer et al 2012).
The stoichiometric scaling method is a straightforward empirical approach that is based on the assumption that the effects of atmospheric N deposition on C sequestration strongly depend on the C:N ratios of different compartments of the forest ecosystems (such as soil and plant organs), the proportions of external N inputs that are retained, the relative allocation of N uptake to different plant organs, and the N retention fraction in the soil (De Vries et al 2014). The first issue is the C:N ratios of different ecosystem compartments. Some studies have set C:N ratios as a constant (for example, the high C:N ratio of woody tissues, ranging from 100−500) to evaluate how atmospheric N deposition affects forest C sequestration (De Vries et al 2014, Nadelhoffer et al 1999, Townsend et al 1996, Wang et al 2017). However, the constant C:N ratios cannot reflect the differences that exist among different plant organs or communities, which might restrict the accuracy of estimates to a large extent. Second, it is difficult to quantify the relative allocation of N uptake to different plant organs. Although the N isotopic labeling technique has helped to elucidate this process, there is major variation among different plant species (Templer et al 2012).
By considering the biomass of each plant species in a forest community as weighted values, we could scale-up the C:N ratio from plant organs to species, plant functional types (tree, shrub, and herb), plant communities, and, even whole ecosystems (including soils and plants). Thus, the biomass weighting method could be used to assess how N deposition impacts forest C sequestration at the ecosystem level directly. An advantage of this method is that the N allocation fractions of external N input among different plant organs do not need to be quantified. However, this weighting method, combined with information on plant community composition, requires the systematic measurement of C:N ratios of different plant species and different organs, which is very arduous and expensive in practice.
In this study, we selected eight typical forest ecosystems, encompassing subtropical, warm temperate, temperate, and cold temperate zones, along the north–south transect of eastern China (NSTEC) (figure 1). We then measured a series of datasets from these forests. The data involved community structure, C and N concentration in the soil and different organs from 877 plant species, and atmospheric wet N deposition. Based on the principle of stoichiometric homeostasis, we scaled up the C:N ratio to the ecosystem level, and then evaluated how atmospheric N deposition affects forest C sequestration and N use efficiency (NUE). The main objectives of this study were to: (1) evaluate how N deposition affects forest C sequestration in China, using the principles of ecological stoichiometry at the ecosystem level; and (2) explore spatial variation in NUE from subtropical to cold-temperate forests.

Figure 1. Spatial distribution and basic information of the eight forest ecosystems in China.
Download figure:
Standard image High-resolution image2. Methods
2.1. Study sites
The north–south transect of eastern China (NSTEC) is a unique forest belt that is mainly driven by a thermal gradient, and includes almost all forest types in the northern hemisphere. Eight natural forests across the NSTEC were selected to conduct field sampling. These forests are designated as Huzhong (HZ), Liangshui (LS), Changbai (CB), Dongling (DL), Taiyue (TY), Shennongjia (SN), Jiulian (JL), and Dinghu (DH) (figure 1 and table S1). Mean annual temperature (MAT) and mean annual precipitation (MAP) range from −3.7 °C−21.8 °C, and 473−1927 mm, respectively. Soil types vary from brown soils with high organic matter in cold-temperate forests to lateritic red soil with low organic matter in subtropical forests. Correspondingly, vegetation types include cold-temperate coniferous forests, temperate mixed forests, warm temperate deciduous forests, and subtropical evergreen forests. Furthermore, atmospheric wet N deposition decreases from the south to north along the NSTEC transect (Zhu et al 2015) (see supplementary methods available at stacks.iop.org/ERL/12/114038/mmedia).
2.2. Sampling and measurement
We chose the most representative and undisturbed forest to conduct our field samples and community structure survey at each site. The field sampling processes were systematic and basically included all dominant species (for which the sampling biomass accounted for more than 90% of whole ecosystems, unpublished data). Detailed sampling method are provided in the supplementary methods.
In total, we analyzed 2631 leaf samples, 2631 branch samples, 1800 root samples, and 294 stem samples from 877 plant species, in addition to, 64 soil samples, to obtain a series of datasets on C and N content (Zhao et al 2016).
2.3. Scaling-up C:N ratios from organs to ecosystems using ecological stoichiometry
Using the principles of ecological stoichiometric homeostasis (Sterner and Elser 2002), the stoichiometric scaling approach provides the potential to integrate the C:N ratios of different components of forest ecosystems to the ecosystem level (McGroddy et al 2004, Zhang et al 2017), which was termed the biomass weighting method in this study (figure 2). Thus, the ecosystem C sequestration rate in response to atmospheric N deposition (CSRN) could be determined from the ecosystem C:N ratio, N retention fraction, and the intensity of atmospheric N deposition (De Vries et al 2014).
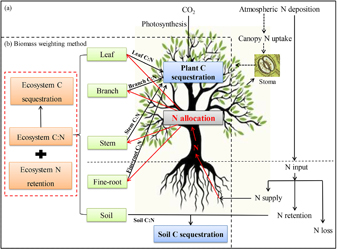
Figure 2. Logical framework of forest carbon (C) sequestration in response to atmospheric nitrogen (N) deposition based on ecological stoichiometric homeostasis. (a) The three fates of atmospheric N deposition input when canopy N uptake is not considered: (1) uptake by the fine-roots of the plant; (2) retention in the soil; and (3) loss through leaching or denitrification. (b) Biomass weighting method used in this study, within which the biomass weighting were used to scale up the C:N ratio from plant organs to species, plant functional types (tree, shrub, herb), plant communities, and, finally, whole ecosystem (including soil and plants). This information was then used to calculate C sequestration in ecosystems.
Download figure:
Standard image High-resolution image2.3.1. Calculating the C:N ratio for compartments and at the ecosystem level
The C:N ratio of plant organs (leaf, branch, stem, and fine-root) and soil was first averaged as an important parameter for each forest type. Then, the biomass weighting method was used to scale-up the C:N ratio from the plant organs (leaf, branch, stem, and fine-root) to species, plant functional types (tree, shrub, and herb), plant communities, and the whole ecosystem using the relative biomass of each plant species (figure S1). Detailed upscaling methods are provided in the supplementary methods.
2.3.2. Fractions of N retention in forest ecosystems
The N retention fractions in the soil and plants were set based on the findings of De Vries et al (2014). Ecosystem N retention was, on average, 75% in temperate forests (25% of N retention in plants and 50% of N retention in soil), with about 25% of atmospheric N deposition being lost through leaching and denitrification. Based on the results of fertilizer trials in temperate forests, Schlesinger (2009) reported that approximately 25%–30% of applied N is retained in the biomass pool and 52% (range: 26%–78%) of applied N is retained in the soils. In contrast, ecosystem N retention in subtropical forests was only estimated as 30% (15% of N retention in plants and soil, respectively) and about 70% of N loss in tropical regions (De Vries et al 2007). The N retention fractions are shown in table S1. Moreover, atmospheric dry N deposition and plant canopy N uptake were not considered in this study because of the complicated physiological processes in leaf stoma and high uncertainty with respect to canopy N uptake coefficients (Sievering 1999).
2.3.3. Calculating C sequestration rates in response to atmospheric N deposition
The C sequestration rate in response to atmospheric N deposition (CSRN) was calculated as:

where CSRN,i (kg C ha−1 yr−1) is the C sequestration of a specific ecosystem in response to atmospheric N deposition; (C:N)i is the C:N ratio of specific ecosystem; Ndep (kg N ha−1 yr −1) is atmospheric wet N deposition in a specific forest ecosystem; fN,ret,i is the fraction of N retention of ecosystem; and i indicates a specific ecosystem.
2.3.4. Calculating N use efficiency (NUE) at the ecosystem level
N use efficiency (NUEeco) at the forest ecosystem level was defined as the quotient of increased C storage caused by external N input, which is classified as plant NUE (NUEplant) and soil NUE (NUEsoil). The formula was:
Then, we combined formula (1) with formula (2), to obtain:

where NUEi (kg C kg−1 N) is the NUE of the plant, soil, or ecosystem; (C:N)i is the C:N ratio of the plant, soil, or ecosystem; fN,ret,i is the fraction of N retention of the plant, soil, or ecosystem; and i represents plant, soil, or ecosystem.
2.3.5. Analysis and statistics
All data in this study were reported as average ± standard deviation (SD). One-way ANOVA with LSD test was used to compare the differences of C sequestration rates in response to atmospheric N deposition in different forest sites and types. All analyses were conducted using the SPSS 13.0 program (Statistical Package for the Social Sciences Inc. Chicago, IL, USA, 2004). A significance level of P < 0.05 was used for all tests.
3. Results
3.1. C:N ratios from organs to ecosystems
The C:N ratios of plant organs (leaf, branch, stem, and fine-roots), ecosystem components (plant and soil), and the ecosystems of eight forest ecosystems are shown in table 1. Compared to the C:N ratio of the leaf, branch, and fine-root, stems had the largest C:N ratio (range: 173–853). Leaves had the smallest C:N ratio of all plant organs (range: 18.4–28.3).
Table 1. C:N ratios (mass ratio) at different levels: plant organs, different components, and ecosystems.
| Method | Components | HZ | LS | CB | DL | TY | SN | JL | DH |
|---|---|---|---|---|---|---|---|---|---|
| Arithmetic average | Leaf | 24.8 ± 0.1 | 21.0±1.2 | 18.4±1.6 | 18.4±0.5 | 27.7±5.0 | 23.8±2.7 | 27.1±0.8 | 28.3±0.8 |
| Branch | 68.8 ± 3.2 | 67.7±5.6 | 55.7±3.2 | 53.5±0.1 | 62.4±3.4 | 50.4±7.7 | 62.0±3.5 | 60.5±8.3 | |
| Stem | 853 ± 60 | 182 ± 32 | 299 ± 111 | 376 ± 39 | 362 ± 176 | 173 ± 54 | 336 ± 51 | 442 ± 118 | |
| Fine-root | 56.6 ± 2.7 | 52.8 ± 3.8 | 43.4 ± 3.8 | 32.3 ± 0.3 | 43.6 ± 3.9 | 71.2 ± 25.1 | 56.6 ± 13.9 | 56.2 ± 5.7 | |
| Soil | 14.5 ± 0.3 | 16.3 ± 2.6 | 10.9 ± 0.6 | 12.2 ± 0.6 | 16.5 ± 0.9 | 10.2 ± 0.1 | 14.9 ± 0.7 | 14.7 ± 0.6 | |
| Biomass weighting | Plant | 188 ± 4 | 108 ± 12 | 90.5 ± 19.8 | 76.2 ± 5.4 | 95.0 ± 9.2 | 83.7 ± 19.3 | 98.4 ± 11.3 | 116 ± 18 |
| Ecosystem | 32.5 ± 8.1 | 37.0 ± 6.1 | 26.6 ± 7.9 | 27.5 ± 3.3 | 35.6 ± 5.5 | 31.9 ± 4.1 | 38.9 ± 1.8 | 48.2 ± 9.6 |
Table 2. Forest C sequestration in response to N deposition in China.
| Forest typea | Sites | NPPb (kg C ha−1 yr−1) | NEPc (kg C ha−1 yr−1) | CSRNd (kg C ha−1 yr−1) | %NPP | %NEP | Forest area (km2) | C sequestration (Tg C yr−1) |
|---|---|---|---|---|---|---|---|---|
| DNF | HZ | 7320 | 2423.5 | 32.7 ± 8.1a | 0.45 | 1.2 | 109000 | 0. 36 |
| MIX | LS | 9200 | — | 269.3 ± 44.7bd | 2.9 | — | 91500 | 1.9 |
| CB | 11750 | 3023.3 | 141.5 ± 41.9c | 1.2 | 4.7 | — | ||
| DBF | DL | 13590 | — | 208.5 ± 25.3cd | 1.5 | — | 762700 | 27.2 |
| TY | 7070 | — | 507.1 ± 77.6e | 7.2 | — | |||
| EBF | SN | 15640 | — | 168.6 ± 21.6cf | 1.1 | — | 356700 | 8.2 |
| JL | 19040 | — | 216.4 ± 10.2df | 1.1 | — | |||
| DH | 26680 | 3959.5 | 307.5 ± 61.3b | 1.2 | 7.8 |
aDNF, deciduous needle-leaf forest; MIX, mixed forest; DBF, deciduous broadleaf forest; EBF, evergreen broadleaf forest. bNPP data were obtained from Luo 1996. cNEP data were obtained from Yu et al 2013. dCSRN was the C sequestration rate that was calculated directly by the biomass weighting method (mean ± SD). Data with the same letters indicate no significant difference at the P = 0.05 level.
Soil C:N ratios ranged from 10.2−16.5, which were far lower than those of plants (range: 76.2–188), and was calculated using the biomass weighting method for the forest community. Moreover, the ecosystem C:N ratio was highest in subtropical evergreen forests (DH; mean value: 48.2 ± 9.6) and lowest in mixed forests (CB; mean value: 26.6 ± 7.9).
3.2. C sequestration rate among different forest ecosystems
The C sequestration rate (CSRN) of atmospheric N deposition varied significantly among the different forest types (P < 0.01), with estimates ranging from 32.7 (HZ)−507.1 (TY) kg C ha−1 yr−1 in the eight forest ecosystems (table 2; mean: 231.5 kg C ha−1 yr−1). Warm temperate deciduous broadleaf forests had the highest CSRN, compared to all other forest types (figure 3). The contribution of CSRN to ecosystem NPP was about 2.1% (range: 0.45%–7.2%), and accounted for 4.6% (range: 1.4%–7.8%) of ecosystem NEP. When combining the forest areas of different regions, forest C sequestration was enhanced by N deposition, with values about 0.36, 1.90, 27.2, and 8.2 Tg C yr−1 in cold temperate coniferous forest, temperate mixed forest, warm temperate deciduous forest, and subtropical evergreen forest, respectively (table 2).
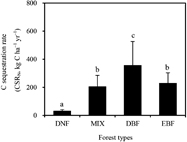
Figure 3. Carbon sequestration rate (CSRN) in response to atmospheric wet N deposition in different forest types. DNF, deciduous needle-leaf forest; MIX, mixed forest; DBF, deciduous broadleaf forest; EBF, evergreen broadleaf forest; Data with the same letters indicate no significant difference at the P = 0.05 level.
Download figure:
Standard image High-resolution image3.3. N use efficiency (NUE) at plant, soil, and ecosystem scales
NUEeco (using the weighting method) ranged from 9.6−27.7 kg C kg−1 N in the eight forest ecosystems. NUEplant values ranged from 12.6−47.1 kg C kg−1 N, and were higher than the NUEsoil values (range: 1.5–8.2 kg C kg−1 N). Interestingly, all NUE values from different scales exhibited a significant latitudinal pattern along the NSTEC. NUEeco (R2 = 0.47, P < 0.0001), NUEplant (R2 = 0.59, P < 0.0001), and NUEsoil (R2 = 0.65, P < 0.0001) all increased from south to north (figure 4).

Figure 4. Nitrogen use efficiency (NUE) related to atmospheric N deposition along the latitudinal transect.
Download figure:
Standard image High-resolution image
4. Discussion
4.1. Variation in C:N ratios among the different components of forest ecosystems
C:N ratios varied significantly among the eight forest ecosystems of China (rang: 26.6–48.2, table 1). Our results showed that scaling-up using the biomass weighting method provides a new way to integrate variation in C:N ratios among the different components of natural forest ecosystems.
Previous studies reported the C:N ratio of plant organs and ecosystem components separately. For example, through arithmetic averaging their collected data, some studies reported that the C:N ratio was about 20 (mass ratio) in forest leaves (McGroddy et al 2004) and 49.5–61.8 in the fine-roots of terrestrial ecosystems at a global scale (Yuan et al 2011). Although these results are comparable to our results (18.4–28.3 for leaf C:N ratio and 32.3–71.2 for fine-root C:N ratio), these previous studies lacked the measured data for all plant species at specific sites because they did not consider the differences in plant community composition across different regions. In natural forests, the stem is a significant pool of C storage, and has the largest C:N ratio, with a value of 173–853. To the best of our knowledge, this study is the first to report the C:N ratio of the stem at a large scale based on measured data. Cleveland and Liptzin (2007) reported a soil C:N ratio of about 6.6 in forest topsoil at the global scale. Furthermore, Tian et al (2010) collected 2473 soil profiles across China, and obtained an average C:N ratio of about 6.5 in the topsoil, which was lower than our results (10.2–16.5 for soil C:N ratio). These differences might be attributed to these previous studies collecting data from the published literature, and producing a larger data sample that resulted in a lower soil C:N ratio.
4.2. Latitudinal patterns of NUE related to atmospheric N deposition
The values of NUEeco, which were inferred from ecological stoichiometric homeostasis, ranged from 9.6−27.7 kg C kg−1 N in the eight forest ecosystems. Our estimate was consistent with previous studies using model simulations and N fertilizer experiments (De Vries et al 2006, De Vries et al 2014, Gu et al 2015, Hyvonen et al 2008, Wang et al 2017). A review by De Vries et al (2009) also showed that forest C sequestration in response to N deposition ranged from 5−75 kg C kg−1 N. NUEplant was much higher than NUEsoil in this study, implying that plants have a greater ability for C sequestration than the soil. Hyvonen et al (2008) investigated how long-term N addition affected C storage in the trees and soils of northern Europe, and found that the cumulative amount of N addition resulted in a mean increase in tree and soil storage of 25 and 11 kg C kg−1 N, respectively. The estimates obtained in this study strongly supported the results of studies using different methods.
Our study also showed that, in response to atmospheric N deposition, the NUE of forest ecosystems increased with increasing latitude along the NSTEC transect (figure 4). Soil N availability is often considered a limiting resource in temperate and boreal forests (McKane et al 2002, Vitousek and Howarth 1991). The inputs of external N through atmospheric N deposition significantly enhance N availability and promote productivity. Subtropical and tropical regions are often considered to be less N-limited than those of temperate regions (Peñuelas et al 2013). Therefore, most N inputs through atmospheric deposition in subtropical and tropical regions are lost through leaching and denitrification (Aber et al 1989, Bai et al 2012), resulting in subtropical regions having lower NUE. In contrast, high-latitude temperate forests have higher NUE, indicating higher C sequestration potential. Such regional differences in NUE compared to atmospheric N deposition should be emphasized in future studies to improve predictions of forest C sequestration under various scenarios of changing atmospheric N deposition.
4.3. Effects of atmospheric N deposition on forest C sequestration in China
CSRN was estimated as 231 kg C ha−1 yr−1 (range: 32.7–507.1 kg C ha−1 yr−1) in the eight typical forest ecosystems along the NSTEC transect, contributing 2.1% of NPP and 4.6% of NEP to these forest ecosystems, on average (table 2). Based on ecosystem modeling and moderate resolution imaging spectroradiometer (MODIS) data (Myneni et al 1999), previous studies estimated that the contribution of atmospheric N deposition was 0.4%–1.6% of NPP in forest ecosystems, with the highest CSRN occurring in deciduous broadleaf forests and the lowest CSRN occurring in evergreen broadleaf forests (Cleveland et al 2013, De Vries et al 2014). Our results partly supported these studies, with the highest CSRN being recorded in the deciduous broadleaf forest (TY). Moreover, the contribution of CSRN to NPP was much higher in the deciduous broadleaf forest (TY), which might be due to higher atmospheric N deposition (19.0 kg N ha−1 yr−1). In comparison, Yu et al (2014) reported that the monsoon subtropical forests of East Asia have high CO2 uptake capacity, due to the combined effects of young stand ages, high atmospheric N deposition, and synchronous water and heat availability. Our results supported these findings, to some extent, with evergreen broadleaf forests in China having higher CSRN, which accounted for a large percentage of NEP (about 8%).
CSRN significantly differed among four of the forest types (figure 3), which reached the highest value in warm temperate deciduous forests. CSRN was significantly different in our two warm temperate deciduous sites, because the N deposition levels could not be compared (TY and DL, table 2); however, other studies reported quite high N deposition in warm-temperate regions (North China and Central China) (Jia et al 2014). Therefore, atmospheric N deposition should have a larger effect on forest C sequestration in the N-limited forests of temperate regions (Peñuelas et al 2013). When combining the forest area of different regions, N deposition enhanced forest C sequestration by about 37.7 Tg C yr−1 in China's forest (table 2). Lu et al (2012) used the DLEM model to simulate the contribution of N deposition to C sequestration, and found that China's forests sequestered 37 Tg C yr−1, being driven by increased N deposition from 1901−2005. Compared to the modeled result, our estimation based on the principles of ecological stoichiometry was reasonable.
4.4. Uncertainties of the estimation method
Several factors are expected to generate uncertainty of the estimates. First, the biomass weighting method needs a large number of measured C and N contents, in addition to detailed data on forest community composition. Moreover, the biomass data of each tree species derived from the allometric biomass equation had large uncertainty, because the allometric equation of specific tree species might vary among sites. However, compared to the traditional estimation method (which estimates plant organs and soil separately, and then sums the two), the biomass weighting method has the advantage in that the allocation fractions of external N input in plant organs do not need to be quantified, which is very difficult in practice, especially in natural forest communities (Templer et al 2012).
The N retention capacity of forest ecosystems might differ among different regions. Although it is very difficult to obtain empirical values for each site, some studies have indicated that ecosystem N retention fractions differ between temperate and subtropical regions and are often much lower in low latitude regions. For example, Bai et al (2012) used natural variations in N15 isotopes by combining two models to trace the global pathways of N loss, and found that denitrification accounts for 35% of N loss from natural soils at a global scale, but accounts for about 70% of N loss in tropical regions. By compiling a series of throughfall N deposition in 50 forest sites across China, Fang et al (2011) reported that the average fraction of throughfall N lost by leaching was much greater in broad-leaved forests (85%) compared to coniferous forests (18%). The possible explanation for the relatively low N retention in monsoon Asia (with broad-leaved forests) might be that unavoidable N loss was partly controlled more by hydrological processes than by a lack of biological demand in warm and wet summers (Fang et al 2011). Moreover, Dise et al (2009) reported that a high N retention fraction (87%) was associated with low atmospheric N deposition (<8 kg N ha−1 yr−1), with lower retention rates being associated with higher N deposition. We tried to use the empirical models reported in Dise et al (2009) to incorporate the impact of N deposition on the N retention fraction, and to establish groups of N retention fractions for each site. However, these models only applied to broadleaf and coniferous forests, with N retention fractions ranging from 0.54−0.87 at our sampling sites, which was similar to the fraction (0.75) used by De Vries et al (2014) in temperate forests. Unfortunately, these models were not suitable for subtropical forests, producing negative values for N leaching. Such regional differences between N retention and atmospheric N deposition require further investigation.
Atmospheric dry N deposition and plant canopy N uptake were not considered in this study. In general, wet deposition is roughly estimated as 40%–80% of total N deposition (Vet et al 2014). Some studies suggested that a certain percentage of atmospheric N deposition (especially dry deposition) is absorbed by the plant canopy via the stomata, leaf cuticle, and bark; thus, the C sink might increase if direct canopy uptake was taken into account, because double or triple the amount of N could be allocated to woody biomass directly (Dezi et al 2010, Sievering 1999, Sievering et al 2007). Fang et al (2011) reported that the DIN (dissolved inorganic nitrogen) in throughfall was 31.6 kg N ha−1 yr−1 at DH site. If we considered throughfall N deposition, the C sequestration rate would increase by 30% compared to wet N deposition. Although atmospheric dry N deposition or throughfall deposition in forest was not considered in this study, it should be incorporated into future studies.
The principles of ecological stoichiometric homeostasis assume that the different components (leaf, branch, stem, root, and soil) of mature forest ecosystems have relatively stable C:N ratios. However, N addition studies indicate that C:N ratios shrink in response to continuous N addition before reaching a new balance (Lu et al 2012, Yang et al 2011). Therefore, the CSRN and NUE reported in this study are more likely to be instantaneous values of ecosystems in a specific period. Nevertheless, the reported ranges and trends of CSRN and NUE in the forest of China could provide an important reference for future assessments of C sequestration in response to N deposition.
5. Conclusions
By combining the scaling-up method based on biomass weighting and the principles of ecological stoichiometric homeostasis, we provide a new way of evaluating how atmospheric wet N deposition enhances forest C sequestration in natural ecosystems. The ecosystem C:N ratio ranged from 26.6−48.2 in eight typical forests from subtropical to cold-temperate regions, while the C sequestration rate (CSRN) was estimated as 32.7–507.1 kg C ha−1 yr−1. Ecosystem N use efficiency (NUEeco) ranged from 9.6−27.7 kg C kg−1 N in the eight forest ecosystems, and increased significantly with increasing latitude along the north–south transect of eastern China (NSTEC).
Acknowledgments
We are grateful to these ecological stations and all monitors from the Chinese Ecosystem Research Network (CERN) for the field sampling and atmospheric N deposition observation. This work was partially supported by the National Nature Science Foundation of China (31570471, 31290221), the program of Youth Innovation Research Team Project (LENOM2016Q0005), and Youth Innovation Promotion Association of CAS.