

Abstract
In drylands, convective rainstorms typically control runoff, streamflow, water supply and flood risk to human populations, and ecological water availability at multiple spatial scales. Since drainage basin water balance is sensitive to climate, it is important to improve characterization of convective rainstorms in a manner that enables statistical assessment of rainfall at high spatial and temporal resolution, and the prediction of plausible manifestations of climate change. Here we present a simple rainstorm generator, STORM, for convective storm simulation. It was created using data from a rain gauge network in one dryland drainage basin, but is applicable anywhere. We employ STORM to assess watershed rainfall under climate change simulations that reflect differences in wetness/storminess, and thus provide insight into observed or projected regional hydrologic trends. Our analysis documents historical, regional climate change manifesting as a multidecadal decline in rainfall intensity, which we suggest has negatively impacted ephemeral runoff in the Lower Colorado River basin, but has not contributed substantially to regional negative streamflow trends.
Export citation and abstract BibTeX RIS

Original content from this work may be used under the terms of the Creative Commons Attribution 3.0 licence.
Any further distribution of this work must maintain attribution to the author(s) and the title of the work, journal citation and DOI.
1. Introduction
Spatial patterns and temporal distributions of rainfall control water balance, watershed responses, water supply, and flood risk. Convective precipitation (e.g. air mass thunderstorms) is an important source of drainage basin moisture in many regions, generating pronounced rainfall variability in space and time that may be affected by the influence of climate warming on water-holding capacity of the atmosphere [1]. However, convective rainstorms are poorly represented in regional water balances and climate models. This is because they are spatially smaller than typical grid resolutions of satellite data products, general circulation models (GCMs), and regional climate models, and temporally they are shorter than the output resolution of these data and models [2, 3]. Therefore, it is currently challenging to assess the potential changes to the water cycle that may emerge due to future climate change in regions where these storms play an important role. This uncertainty thwarts efforts to create plans for sustainable water and land management and conservation within drainage basins in such regions.
Rainfall heterogeneity is acute in semi-arid and arid regions, where convective rainstorms are short-lived and small relative to drainage basin size and dominate runoff generation [4, 5]. Even under a stationary climate in such regions, event-based time series of rainfall recorded over decades from dense gauging networks only represent one realization of many plausible spatial patterns and temporal sequences of rainfall that could occur over different timescales [6–8]. Thus, convective rainfall is essentially random, or stochastic. Furthermore, a nonstationary climate (i.e. climate change) might increase/reduce rainfall and thus influence the water balance within dryland regions, which are already very sensitive to the spatial and temporal expressions of climate (e.g. [9–16]).
Climate changes may be imprinted within storm-event rainfall in complex ways that depend on regional moisture sources and temperature [17]. Precipitation changes in drylands may manifest in wetter (drier) conditions seasonally or annually, in higher (lower) rainfall intensity for a given storm duration, or in some combination of these two effects. It is currently challenging to separate out the impacts of these two classes of climate change (i.e. shifts in annual precipitation totals versus shifts in rainfall intensity), and to assess the interaction of their various combinations. The lack of simple frameworks for such investigation limits progress in anticipating watershed responses to climate change in regions dominated by convective rainfall.
Recent research has demonstrated that rainfall intensity and its expression in annual rainfall is expected to change with climate warming due to a shift in the frequency of extreme events [18] arising from higher moisture holding capacity in the atmosphere [19], and that the evidence for such changes might develop slowly in rainfall records [20]. However, it is unknown how particular classes of climate change might affect rainfall patterns and runoff generation across a basin. This information gap creates challenges for predicting expected hydrologic patterns and processes under shifting climate drivers within dryland drainage basins. It therefore limits progress in research and management of environments that occupy 41% of the Earth's land surface and are home to 1/3 of the global population [21].
It would be useful to have a simple rainstorm generator to investigate spatial and temporal variability in rainfall under stationary or nonstationary climate. Various rainstorm generators exist [22], ranging from those which link the physics of atmospheric circulation to rainfall patterns [23–25], to theoretical approaches of space-time relationships of rainfall over individual storm cycles [26–28], and to empirical–stochastic models, in which weather is simulated by semi-randomly sampling from distributions of measured climate variables [29–31]. Most of these generators are too complex for simple investigative simulation of convective rainfall under climate change in small basins. Notable limitations of existing models include large input data requirements and/or reliance on GCM output to characterize climate change (e.g. [32]).
In this paper, we develop a new parsimonious rainstorm generator, the STOchastic Rainfall Model (STORM), designed for simple multidecadal simulations of rainfall patterns and sequences over an entire drainage basin. The model is based on a combination of theoretical space-time relationships with empirical-stochastic selection of historical rainfall characteristics to create realistic simulations of discrete rainfall events across a basin and over various timeframes (resolution: 1 km; 1 min). A strength of our approach is that STORM is flexible enough to simulate patterns and sequences of rainfall that do not exist within historical records, but are plausible based on past precipitation. Furthermore, the model has the built-in capability to predict watershed response to potential climate changes by censoring or altering relevant input distributions to incorporate the effects of likely climate changes (e.g. toward higher/lower total seasonal rainfall and/or higher/lower intensity storms). We apply STORM to assess the past expression of climate change on rainfall characteristics in a dryland basin in the Lower Colorado River basin. We further explore its imprint on ephemeral channel flow contributions to larger regional rivers, where there are observations of multidecadal declines in streamflow (e.g. [15, 33, 34]).
2. Study area
The Walnut Gulch experimental watershed (WGEW) is a 149 km2 basin tributary to the San Pedro River within the Lower Colorado River basin in SE Arizona (figure 1(a)), a region particularly prone to increased probability of drought [35, 36]. It spans an elevation range of 1219–1927 m above sea level [37], producing a mild orographic effect (figures 1(b) and (c)), associated with the strengthening of convective convergence at zones of high topographic relief [38, 39]. WGEW has been monitored for rainfall since the 1950s with one of the densest rain gauge networks in the world at 0.6 gauges km−2 [40]. Approximately two-thirds of the annual precipitation and ~90% of all runoff in WGEW occurs during high intensity, convective rainstorms during the summer monsoon [5, 41–43]. These storms, which largely originate in the Gulf of Mexico or the Pacific Ocean [44], are limited in area and are typically smaller than the basin size.

Figure 1. Walnut Gulch experimental watershed (WGEW) and orography. (a) USGS 10 m digital elevation model (DEM) hillshade. (b) Mean annual monsoonal PTotal in WGEW for the period 1953–2015. Variation of observed mean monsoonal PTotal versus gauge elevation, illustrating small orographic effect in WGEW for observed data (c) and modeled simulations (d), where dashed line in the latter indicates observed orographic effect. Blue circles represent binned averages over 50 m intervals of elevation, green horizontal lines in (c) represent mean values for three orographic groups used in modeling (see figure S1), and red vertical error bars represent ±1 standard deviation around binned PTotal estimates.
Download figure:
Standard image High-resolution image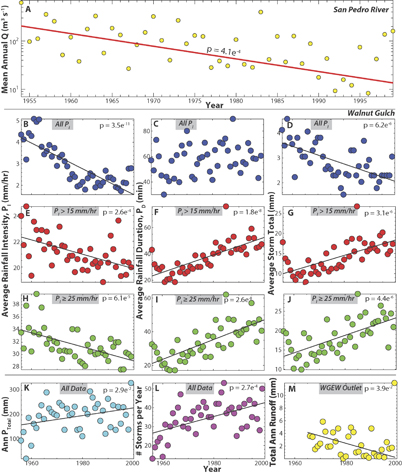
Figure 2. Time series of and Pearson correlation trends in: San Pedro River summer discharge from [15] (a), average event rainfall intensity, duration, and storm totals at WGEW for all PI (b)–(d), PI > 15 mm hr−1 (e)−(g), and PI ≥ 25 mm hr−1 (h) and (i). Panels (k)–(m) show time series of PTotal, number of storms, and observed WGEW runoff. Significant trends are shown as least squares fits with p-values. Note: trend in (m) excludes extreme runoff year of 1999 and runoff for most downstream WGEW gauging station (Flume 1) near basin outlet is reported in mm, discharge normalized by total upstream drainage area.
Download figure:
Standard image High-resolution imageFrom a regional water resources perspective, an important question is why discharge in the downstream San Pedro River (sub-tributary to the Colorado River) declined by >50% in the latter half of the 20th Century, within which the overall trend largely is dominated by a discharge decrease in the summer monsoon season (~70% decline [15], figure 2(a)). There is lingering debate about whether this streamflow decline can be attributed to regional changes in precipitation (historical climate change) and associated runoff from monsoonal ephemeral flow, or to increased lowland groundwater abstraction [15, 39]. Both have important implications for water resources in this dryland region. We aim to address climate change trends in rainfall characteristics in WGEW and their potential impacts on runoff and ultimately, to provide new insights on the likely causes of the observed multidecadal decline in downstream streamflow in this part of the Lower Colorado basin.
3. Methods
In this paper, we investigate historical trends in event precipitation across the network of gauges at WGEW. Then we use STORM to explore the likely impacts of shifts in precipitation due to climate change on runoff. STORM uses an empirical–stochastic approach, which involves assembling probability distributions of key rainstorm characteristics, followed by Monte Carlo sampling of these distributions to simulate spatial and temporal variability of rainstorms across a spatial grid.
3.1. Model initialization
To initialize STORM, we created probability density functions (pdfs) representing key storm attributes based on aggregated analog and digital precipitation event data from long-term rain gauges in Walnut Gulch (www.tucson.ars.ag.gov/dap/). We treated the paired storm event data (intensities and durations) collected from all gauges during the summer monsoon season (May–September) as discrete samples drawn from a larger population of storms and thus concatenated these data for further analysis of intensity–duration relationships (see below). We also computed monsoonal precipitation totals by taking the product of intensity and duration for each event (storm total) and accumulating these storm totals for each year of record.
We then assembled pdfs for subsequent random sampling as follows (see supplementary material available at stacks.iop.org/ERL/12/104011104011/mmedia for more detail). (1) A pdf of annual precipitation totals (PTotal, mm y−1) fit by a normal distribution to computed total monsoonal rainfall for each year over 62 years (1954–2015), for each gauge that had at least five decades of rainstorm event data (n = 85 gauges; n = 5270; figure S1(a). (2) A pdf of storm areas (A, km2), was fit by extreme value distribution (figure S1(b)) to data digitized from a previous spatial interpolation analysis of 300 storm events over a 17 year period (figure 5 of [4]). (3) We established a model domain using a Universal Transverse Mercator 0.5 km spatial storm-center grid with a 5 km buffer around the watershed (figure S1(c)). Points on this grid are randomized in the model for determination of storm-center location for each generated rainstorm (uniform distribution). (4) A pdf of rainstorm durations (PD, minutes) was fit by generalized extreme value distribution to aggregated instantaneous storm data from all gauges (n = 185 110; figure S1(d)). (5) To determine storm-center intensity (PI, mm hr−1) based on each selected value of duration, we randomly select one from a family of rainfall intensity-duration curves that define the phase space for these two storm variables (figure S1(e)). Each curve is assigned a probability of selection within STORM based on the general observation that the largest rainstorms are less probable than smaller ones (figures S2 and S3). (6) Finally, we compute the rainfall intensity gradient (figure S1(f)) for each storm to represent the strong tendency for a decay in PI from the storm center to the storm margins. To determine PI at each gauge or grid position that lies within the radius of the simulated rainstorm, we compute the spatial storm gradient based on a two-dimensional Gaussian rainfall surface that represents quadratic exponential decay of PI with distance from the storm center [26]:

where PI,x is rainfall intensity (mm hr−1) at a distance x (km) away from the storm center (x = 0), PI,x = 0 is the rainfall intensity (mm hr−1) at x = 0, and β is decay parameter describing the decline in rainfall with distance from the storm center. Previous work in WGEW and other basins dominated by convective rainfall has shown very steeply declining rainfall intensity with distance from the storm center [45, 46].
3.2. Model operation
To operate STORM, we begin in Year 1 of a simulation by selecting from the pdf of annual PTotal (figure S1(a)). Then for each simulated year, we generate a series of storms with randomly selected rainstorm characteristics expressed on a grid (see below) until the selected PTotal is exceeded by at least half of the gauges in the basin. In other words, each simulation year is complete when the median value of running PTotal at all data output locations on the grid (either explicit gauge locations for model evaluation or arbitrary grid locations for model simulation), exceeds the selected value of PTotal for that year. Then a new simulation year begins.
For each simulated storm, we randomly select (figure S1): (1) storm center location; (2) storm PD (1 minute resolution); (3) intensity–duration curve number, which defines rainstorm PI at the storm center as a function of the selected duration, modified by a randomized fuzzy tolerance within ±5 mm hr−1; and (4) storm area, from which we calculate storm radius (assuming circular storm shape) as  . We then apply the computed storm gradient (equation (1)) to determine PI for each affected output grid location (or gauge location). To do this, we project r on the basin map, and determine which grid locations are affected using Euclidean geometry and then compute PI,x for each affected grid cell excluding the storm center.
3.3. Orography, model evaluation, and climate change scenarios
The simulation procedure for STORM described above was enhanced to include orography, the tendency for precipitation to vary with elevation. We used the hypsometric method to evaluate the elevational control on total monsoonal precipitation. The orographic effect is thus included by dividing the basin into three orographic groups of elevations (green horizontal lines in figure 1(c)), which broadly define spatial areas of the basin. We use these orographic groups to further modify selection probabilities for intensity-duration curves (figures S1E and S2). Essentially, we increase the probability of selecting more intense storms where the storm center is located at higher elevation, and vice versa (supplementary material).
We evaluated the model's skill at generating distributions of the various storm characteristics that are statistically similar to those of the original dataset from which pdfs were derived. To this end, we evaluated selected rainfall characteristics at 85 gauge locations (figure 1(a)) from 30 ensembles of thirty-year simulations of STORM. We compared rainstorm characteristics that emerge from the model, rather than those which are forced by it. The resulting statistical tests demonstrated high model skill without model tuning (supplementary material figures S4−S6).
Once we were satisfied with the model's simulation skill, we modified the inputs to STORM to investigate rainfall resulting from two classes of climate change and their interactions over a grid within the basin. First, we looked at step changes in overall wetness by increasing/decreasing the distribution mean of PTotal by one standard deviation, while maintaining the pdf shape (figure S1(a)). These simulations of changes in wetness are indicated by PTotal(+) or PTotal(−). Second, we investigated step changes in storminess (i.e. value of storm event PI for a given PD) by multiplying the selected PI value at the storm center by a scalar fraction (supplementary material) and adding (subtracting) the product to the selected PI value to reflect increased (decreased) storminess. This effect propagates into PI at any location within the storm area by equation (1) and shifts the phase space of PI–PD up or down to reflect step changes in storminess (figure S1(e)). These simulations of changes in storminess are indicated by PI(+) or PI(−). Finally, we looked at the combined effects of each permutation of these classes of climate change. Note that the simulated climate change scenarios presented here are heuristic rather than accurate characterizations of climate change projections.
To estimate the first-order effects of rainfall on runoff, we assumed a spatially uniform infiltration rate of 15 mm hr−1 based on previous work in this basin [4, 5, 39, 47]. We use this threshold rate to calculate local infiltration-excess precipitation (herein referred to as potential runoff, ROPot) from STORM rainfall output for each modeled scenario.
We investigated the impact of each climate change scenario on precipitation as measured by five metrics calculated from model output at each grid location for each simulation year: (1) number of storms; (2) mean storm total (rainstorm total averaged over all events); (3) total ROPot as cumulative sum of discrete storm events of PI > 15 mm hr−1 as ROPot = Σ[(PD/60 min) ⁎ (PI>15–15 mm hr−1)]; (4) ROPot coefficient (ROPotCoeff) as ROPot/PTotal; and (5) total ROPot for discrete heavy rainfall events where PI ≥ 25 mm hr−1 as ROPotHeavy = Σ[(PD/60 min) ⁎ (PI≥25–15 mm hr−1)]. The heavy rainfall metric is most diagnostic of likely runoff response within the drainage basin. The degree of spatial heterogeneity in ROPotHeavy (measured by coefficient of variation, CV) reflects the likelihood of runoff reaching the basin outlet.
During sufficiently long storms, overland flow is generated and runoff arrives at the Walnut Gulch channel, where it moves downstream toward the San Pedro River, albeit with significant transmission losses of ~65% [43]. However, since our model only simulates the rainfall, computed metrics from STORM output provide a first-order indication of watershed response to climate change and corresponding contributions to downstream streamflow trends. A more detailed understanding of watershed response to climate change can be assessed by driving a rainfall-runoff model with rainfall series and inter-storm periods generated by STORM (see supplementary material for more detail).
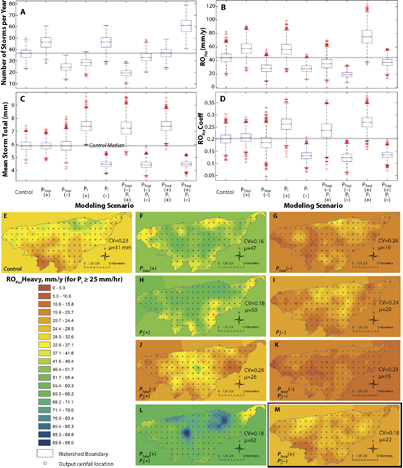
Figure 3. Annual watershed response variables to modeled scenarios. Boxplots of number of storms per year (a), ROPot (b), storm total (c), and ROPotCoeff (d). Spatial maps of ROPotHeavy (for PI ≥ 25 mm hr−1) based on thirty ensembles, each of 30 years, for the following scenarios: current climate [Control] (e), PTotal increase [PTotal(+)] (f), PTotal decrease [PTotal(–)] (g), storminess increase [PI(+)] (h), storminess decrease [PI(–)] (i), PTotal(–) and PI(+) (j), PTotal(–) and PI(–) (k), PTotal(+) and PI(+) (l), and PTotal(+) and PI(–) (m). Panel (m) (black outline) is the most representative of recent historical climate change in WGEW. Spatial coefficients of variation (CV) and mean values (µ) are also shown on each map.
Download figure:
Standard image High-resolution image
4. Results
Figure 1(d) depicts the orography generated by STORM after an ensemble of 30 × 30 year simulations, based on our probabilistic treatment of PI−PD curve selection (figure S2). The averaged results reasonably match the general elevational trend in PTotal observed in the historical record (figure 1(c)).
Figures 2(b)–(m) present historical precipitation and runoff trends in WGEW, corresponding to the multidecadal period of the observed negative trend in streamflow in the San Pedro River (figure 2(a), supplementary material). Surprisingly, historical observations reveal a multi-decadal decline in precipitation intensity for all rainstorm events (figure 2(b)—All PI), for events capable of generating local runoff (figure 2(e)—PI > 15 mm hr−1), and for heavy precipitation events (figure 2(h)—PI ≥ 25 mm hr−1). While there is no trend in PD for All PI (figure 2(c)), there are increasing trends in duration for events categorized as PI > 15 mm hr−1 and PI ≥ 25 mm hr−1 (figures 2(f) and (i)). In terms of average storm totals, there is an overall decrease in rainfall depth for All PI (figure 2(d)), even though storm totals have increased for the two categories of higher intensity (runoff-producing) rainfall, due to their longer durations (figures 2(g) and (j)).
In summary, rainstorms in WGEW declined in intensity and in total amount of water delivered per storm over the multi-decadal period, but higher intensity storms became longer, delivering more water to the land surface per storm (even under declining intensity). Cumulative rainfall characteristics at WGEW show that PTotal has increased over the decadal period, along with the number of storms occurring each year (figures 2(k) and (l)). Taken together, these factors highlight that runoff-producing rainfall events have concomitantly decreased in number over this period in favor of many more small events. As a potential consequence, ephemeral runoff at the WGEW outlet has significantly declined over the late 20th Century (figure 2(m); supplementary material), which is consistent with the negative streamflow trend in the downstream San Pedro River (figure 2(a)).
Figure 3 presents STORM results for a range of climate change scenarios involving step changes in wetness (PTotal +/–) and/or storminess (PI +/–) at WGEW, all of which are compared to the Control scenario, that represents stationary historical rainfall. Changing wetness and storminess impacts the number of storms per year intuitively (more storms for PTotal(+) and PI(–), and vice versa). Similarly, storm totals (total rainfall depths per storm) remain largely unchanged for PTotal(+/–) compared to the Control scenario because the storm PI–PD relationship is kept constant even though wetness is changed. However, changes in storminess (i.e. PI for a given PD) markedly affect number of storms and storm total magnitudes (figures 3(a) and (c)). When the two climate change effects are combined in STORM, some interesting interactions emerge. PI(+) counterbalances the effect of PTotal(+) in terms of number of storms per year, yielding a distribution of values identical to that of the Control run. In contrast, PTotal(–) dominates over PI(–) by reducing the number of storms from the Control scenario (figure 3(a)). Combining PTotal(+) with PI(–) produces the largest number of storms of any modeling scenario, which results in a very low mean storm total (figure 3(c)), a model result that is consistent with WGEW historical observations (figures 2(d),(k), and (l)).
The computations of ROPot and ROPotCoeff at each output grid location yield additional information on how the modeled scenarios might be expected to affect watershed response in WGEW. In general, for a given PTotal distribution, storminess differences significantly influence potential runoff. The PI(–) scenario produces a stronger effect than PI(+), markedly decreasing both ROPot and ROPotCoeff compared to the Control run due to the relative loss of high intensity storms that contribute rainfall above the runoff threshold (figures 3(b) and (d)). Within the combined-effect scenarios, ROPot (and ROPotCoeff) is higher for PTotal(+)/PI(+) than in the Control scenario, and it is lower than in the Control runs for PTotal(+)/PI(–). Since PTotal(+)/PI(–) well represents observed WGEW precipitation trends (figure 2), model output from STORM suggest these changes in rainfall characteristics in this ephemeral basin should result in decreased runoff.
Figures 3(e)–(m) present maps of ROPotHeavy for each of the modeled scenarios (30 × 30 year simulations each), along with their means (μ) and coefficients of variation (CV). These maps indicate the total amount and spatial distribution of annual excess heavy rainfall that is highly likely to generate runoff in the watershed [39]. Independently, step changes in PTotal and PI have an approximately equivalent and expectable influence on ROPotHeavy, in terms of average values and spatial heterogeneity. For example, increases in wetness or storminess raise average values of ROPotHeavy across WGEW, while lowering its spatial heterogeneity by a similar degree (and vice versa, figures 3(e)–(i)). The ROPotHeavy results suggest that climate changes expressed through wetness and storminess can have measurable influence on runoff produced at the basin outlet. However, the heavy rainfall results differ from those that include all storms that are likely to generate local runoff, but which are closer to the threshold (PI > 15 mm hr−1). For all such storms, PTotal(+) generates a similar average value of ROPot to PI(+), even though the PI(+) scenario produced a higher runoff coefficient. This illustrates a balance between wetness and storminess (figures 3(b) and (d)).
The STORM output on heavy precipitation from the combined-effect scenarios demonstrates interactions between these two classes of climate change. For example, PTotal(–)/PI(–) produces low ROPotHeavy (as expected), but in a manner that is no less or more heterogeneous than the Control scenario. In contrast, PTotal(+)/PI(+) generates the highest ROPotHeavy, but with low spatial heterogeneity (figures 3(k) and (l)). Notably, results from the PTotal(+)/PI(–) scenario (which best represents decadal trends at WGEW, figure 2), illustrate a decline in ROPotHeavy across the basin (figure 3(m), black outline) compared to the Control. STORM results suggest that the historical climate trend at WGEW produces less and more spatially homogeneous ROPotHeavy, thus suggesting an overall negative trend in runoff for the basin.
5. Discussion
Here we investigated whether the results from our STORM simulations could improve understanding of why the summer flow in the San Pedro River has declined by >50% in the latter half of the 20th Century ([15], figure 2(a)), a phenomenon that has been observed more widely within the Colorado River basin during the recent prolonged drought [34]. We found that climate change at WGEW is expressed as reduced overall rainfall intensity, with higher monsoonal rainfall totals and more storms per year (but with fewer heavy rainstorms). Our modeled scenario of PTotal(+)/PI(–) best represents these observed multidecadal trends. STORM produces corresponding output that is consistent in relative magnitude (and similar in absolute magnitude) to the historical record of precipitation and runoff for the multidecadal period of interest. Thus, STORM can be used to provide insights into the probable watershed responses to these multidecadal changes in precipitation for applications in research or management.
Based on the historical observations and output from STORM, we conclude that the negative multidecadal trend in runoff observed at WGEW (figure 2(m)), could arise directly from the expressed trends in precipitation observed in this basin, over a period of rising temperature (figure S7). STORM revealed that lower rainfall intensity, even with the higher total precipitation, yields fewer intense storms and lower average potential runoff (figures 3(b), (e), (h), (k), (l), (b) and (m)). For example, the PTotal(+)/PI(–) scenario yielded 9 mm, or 0.3 mm y−1 less ROPotHeavy than the Control scenario. Ephemeral basins like WGEW experience high transmission losses (~65%) as streamflow transits through the channel to the basin outlet [43]. Based on our modeling and such estimates of high transmission loss rates (−0.3 mm y−1 minus 65% transmission loss = −0.11 mm y−1), it is therefore plausible that the observed decadal decline in runoff at the WGEW basin outlet (−0.09 mm y−1, figure 2(m)) is a direct consequence of a reduced number of heavy rainfall events and the associated decline in heavy precipitation totals during the monsoon (figure 3(m)). Heavy rainstorms were apparently replaced during this period of warmer climate with many more, less intense storm events that raised annual totals, but did not contribute appreciably to runoff. In addition, coupled with the observed increase in temperatures, infiltrated rainfall contributing to vadose zone moisture was likely to be rapidly lost due to the correspondingly higher evaporative demand over this period (e.g. [33]), thereby quickly resetting infiltrability to its maximum and further reducing potential runoff contributions to the stream.
If these climate change trends are expressed more broadly within the Lower Colorado River basin, it is possible that they do or will have more substantial consequences for streamflow in the major trunk streams, in addition to affecting vegetation cover and erosion rates [48–50]. Nevertheless, based on our analysis, we conclude that the negative trend in streamflow observed at WGEW can only explain ~6% of the decadal decline in San Pedro River summer season streamflow. Although there are additional ephemeral streams that are possibly also contributing lower monsoonal runoff to the San Pedro (e.g. the Babocomare), we intuit that the observed streamflow decline in the lowlands is instead largely due to other factors. These include a combination of accelerated rates of groundwater abstraction, reduced regional groundwater recharge in the surrounding upland areas, and progressive declines in snowpack [51–53]. These net water losses are likely to have lowered regional water tables and by extension, subsurface contributions to this lowland trunk stream [15], regardless of trends in regional ephemeral flow.
The hydrological analysis presented here has broader implications for the manifestations of climate change in dryland basins around the globe. Given that GCMs are currently unable to resolve convective precipitation, a model such as STORM could provide detailed and nuanced insight into the spatial and temporal components of convective rainfall over a dryland (or other) basin, and the expected watershed responses to plausible climate changes. Recent work has highlighted negative trends in rainfall regimes in Eastern Africa, for example, expressed in storminess [54]. Such trends are likely to affect runoff, groundwater recharge, etc, but their impact on regional water balance are currently unresolved. More broadly, upward trends in air temperature are known to affect moisture-holding capacity of the atmosphere, which may produce more heavy rainfall events [17]. However, in moisture-limited (dryland) regions it is plausible that there are upper limits to atmospheric moisture during convective events, even when evaporative demand is very high, due to limited moisture supply from the land in these dry landscapes (supplementary material).
STORM is widely applicable and simple to use due to its low data requirements, its flexibility to assess different classes of climate change, and its ability to generate numerous stochastic ensembles. Potential applications of STORM include characterizing variability in water supply or flash flood risk, investigating the potential impacts of climate changes on water resources, or generating spatially explicit hydrologic input to drive watershed response models, land surface models, or even geomorphic landscape evolution models (supplementary material).
6. Conclusions
In this paper we presented STORM, a simple, flexible, and parsimonious simulation model which can be used by researchers and managers to investigate plausible impacts of climate change on rainstorm-delivered water to the land surface. STORM's output can be subsequently used in other quantitative and modeling frameworks to explore the partitioning of rainfall between the surface and subsurface, ecohydrology, runoff and erosion, and landscape evolution. STORM output and historical data suggest historical climatic changes affected precipitation in the Lower Colorado River basin over a multi-decadal period. We infer that this climatic expression, in turn, was responsible for lower runoff delivered from regional ephemeral tributaries, but has not appreciably contributed to negative streamflow trends in the lowlands.
Acknowledgments
The authors declare no conflicts of interests. Supplementary material is provided as eight figures and corresponding text in an online pdf, available at stacks.iop.org/ERL/12/104011104011/mmedia; rainfall data is freely available from www.tucson.ars.ag.gov/dap/ and additional data and model output may be obtained from MBS (e-mail: bliss@eri.ucsb.edu). We acknowledge helpful conversations with Mary Nichols, Mark Nearing, Dan Hobley, and Jim Kirchner's seminar group at ETH, and reviews from several anonymous referees that led to improvements to this paper. We also acknowledge support of National Science Foundation EAR-1700555 to MBS.
ORCID iDS
Michael Bliss Singer https://orcid.org/0000-0002-6899-2224
Katerina Michaelides https://orcid.org/0000-0002-7996-0543