

Abstract
Fluvial floods are typically investigated as 'events' at the single basin-scale, hence flood management authorities may underestimate the threat of flooding across multiple basins driven by large-scale and nearly concurrent atmospheric event(s). We pilot a national-scale statistical analysis of the spatio-temporal characteristics of extreme multi-basin flooding (MBF) episodes, using peak river flow data for 260 basins in Great Britain (1975−2014), a sentinel region for storms impacting northwest and central Europe. During the most widespread MBF episode, 108 basins (~46% of the study area) recorded annual maximum (AMAX) discharge within a 16 day window. Such episodes are associated with persistent cyclonic and westerly atmospheric circulations, atmospheric rivers, and precipitation falling onto previously saturated ground, leading to hydrological response times <40 h and documented flood impacts. Furthermore, peak flows tend to occur after 0−13 days of very severe gales causing combined and spatially-distributed, yet differentially time-lagged, wind and flood damages. These findings have implications for emergency responders, insurers and contingency planners worldwide.
Export citation and abstract BibTeX RIS

Original content from this work may be used under the terms of the Creative Commons Attribution 3.0 licence.
Any further distribution of this work must maintain attribution to the author(s) and the title of the work, journal citation and DOI.
1. Introduction
Floods endanger lives, damage the built environment, cause disruption and accrue significant economic losses. The Sendai Framework for Disaster Risk Reduction [1] recommends better mapping and management in areas prone to flooding to increase resilience through public and private investment in disaster risk prevention and reduction measures. The UK Climate Change Risk Assessment [2] highlighted that flood risks are already significant in the UK and are expected to rise as a consequence of climate change. Pragmatic and well-targeted actions were called for with respect to high magnitude flood risks for communities, businesses and infrastructures [2]. Anecdotally, high-magnitude flood episodes also tend to impact large areas covering multiple river basins [3–6].
To date, fluvial flooding has tended to be studied on a basin-by-basin basis with respect to physical processes and impacts [7–15]. Some statistical methods for creating design floods rely on pooled data from multiple basins [16, 17], but these approaches are indifferent to any spatial and temporal relationships in the data, whereas multivariate extreme value statistics are useful for estimating return periods for major events [18–20] and for characterizing spatially varying and time-lagged extreme flows [21–23]. Within the reinsurance sector, weather-driven multi-basin 'catastrophe models' are widely used to estimate economic losses due to flooding [24, 25]. Statistical approaches to joint probabilities [21, 22, 26–29] have been extended to multi-basin flooding (MBF), as well as simulation of extreme flow events for northeast England using conditional probability models [30]. Historical MBF episodes have also been investigated in Germany [31, 32], and across Europe climate models have been used to project economic losses [e.g. 33]. However, so far in Great Britain (GB) and elsewhere, there have been no national-scale analyses using simple and pragmatic statistics that specifically focus on the spatio-temporal characteristics of extreme MBF and their links with extra-tropical cyclones (ETCs), that are known to affect the most extreme single-basin floods [34].
The MBF approach here proposed overcomes the limitations of single-basin return period estimation, with the possibility of developing a national-scale return period for improved risk communication. A MBF episode can simultaneously impact very large regions, with the chance to overwhelm emergency responses, e.g. coordinated by the UK Environment Agency. In addition, MBF may coincide with ETCs, which together create a multi-peril scenario of flood-wind impacts. Such episodes may be more severe than what planned for; illustratively, combined flood-wind impacts at the 16 year return period are increased by the link between perils, costing an additional £0.3 billion for domestic UK properties [35].
We present a pragmatic approach for detecting and quantifying the characteristics of extreme MBF episodes and their links with ETCs. We use GB as pilot area, but deploy techniques that are applicable wherever there are gauged river flow data. We searched a window of 1 to 19 days for coincident peak flow annual maxima (AMAX) in 260 non-nested river basins during the 1975–2014 period. Following sections describe the data, methodological approach and metrics, then the six most extensive and temporally distinct MBF episodes identified. We confirm that these most extensive MBF had widespread impacts [36–42] and mostly occurred during winter. A particularly powerful aspect of our approach is that it is compatible with the synoptic-scale (i.e. ~1000 km horizontal length scale) of atmospheric conditions and land-surface properties. This allows severe MBF episodes to be evaluated alongside categories of atmospheric circulation (Lamb weather types, LWTs), antecedent rainfall as a proxy for soil moisture (Standardized Precipitation Index, SPI), atmospheric rivers (ARs), and storminess (very severe gale, VSG, frequency). Moreover, the hydrological response (joining time, Jt) for large and small basins is examined to determine lagged responses in the system. Finally, the causes and implications of extreme MBF and their relationship with ETCs are discussed.
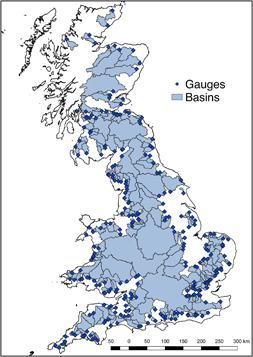
Figure 1. Network of hydrological stations and related areas of basins used in the analyses. The 260 non-nested gauges were selected from an initial network of 648 (figure S1) based on record length, and geographic coverage. Some areas are under-represented (e.g. east England) because they are either ungauged or do not have data for the 1975−2014 period.
Download figure:
Standard image High-resolution image
Figure 2. Distribution of basins contributing to the extreme multi-basin flooding (MBF) episodes in Great Britain (GB) during 1975–2014 for six time window lengths (L, event set E). The maps show respectively: (a) L = 1 day (dmax = 27/12/1979); (b) L = 2 days (dmax = 30/10/2000); (c) L = 4 days (dmax = 01/01/2003); (d) L = 6 days (dmax = 30/10/2000); (e) L = 8 days (dmax = 02/12/1992); and (f) L = 16 days (dmax = 01/02/1995). Flood Yield (FY) is a severity metric that represents each basin's peak flow annual maximum (AMAX) normalized by the relative basin area (A) and dmax is defined as the day where the largest number of AMAX have been registered within each episode.
Download figure:
Standard image High-resolution imageTable 1. Extreme multi-basin flooding (MBF) episodes in Great Britain (GB) during 1975–2014 (event set E). Observations are derived from 19 time windows up to 18 days prior to dmax (i.e. the day where the largest number of peak flow AMAX have been registered). See main text for details. (a) Window length (L) in days; (b) Total drained area (TDA, km2) involved in each episode (i.e. sum of the areas of all involved basins); (c) TDA percentage (%) of the 260 basins affected within each episode; (d) Percentage (%) of GB land area affected within each episode; (e) Dates of episodes, where the top row is dmax; (f) Number of basins with AMAX registered within each distinct day; (g) Total number of basins with AMAX registered within each distinct episode; (h) Percentage (%) of total number of basins (out of 260) with concurrent AMAX per episode; (i) Daily Lamb weather type (LWT); (j) Average joining time (Jt, in days), within an episode, for larger basins (A ≥1000 km2); (k) Average Jt for small basins (A <1000 km2). In (j) and (k) uncertainties are 1 standard error.
| (a) | (b) | (c) | (d) | (e) | (f) | (g) | (h) | (i) | (j) | (k) |
|---|---|---|---|---|---|---|---|---|---|---|
| Time window length (L, days) | Total drained area (TDA, km2) | Total drained area (TDA, %) | GB area % | Date | No. basins per day | No. basins per episode | No. basins % | LWT | Average joining time (A ≥ 1000 km2) | Average joining time (A < 1000 km2) |
| 1 | 23 399 | 18.6 | 11.18 | 27/12/1979 | 66 | 66 | 25.3 | C | − | − |
| 2 | 17 787 | 14.1 | 8.50 | 30/10/2000 | 62 | 68 | 26 | C | 2 | 1.91 ± 0.0 |
| 29/10/2000 | 6 | CSW | ||||||||
| 4 (3 & 5 same dmax as 4) | 31 370 | 24.9 | 14.99 | 01/01/2003 | 34 | 75 | 28.7 | C | 2.83 ± 0.3 | 2.94 ± 0.1 |
| 31/12/2002 | 7 | S | ||||||||
| 30/12/2002 | 29 | C | ||||||||
| 29/12/2002 | 5 | C | ||||||||
| 6 | 24 971 | 19.8 | 11.93 | 30/10/2000 | 62 | 86 | 33 | C | 5 ± 1 | 4.93 ± 0.2 |
| 29/10/2000 | 6 | CSW | ||||||||
| 28/10/2000 | 0 | C | ||||||||
| 27/10/2000 | 2 | W | ||||||||
| 26/10/2000 | 0 | W | ||||||||
| 25/10/2000 | 16 | NW | ||||||||
| 8 (7 same dmax as 8) | 27 674 | 22.0 | 13.22 | 02/12/1992 | 49 | 96 | 36.8 | C | 7 ± 0.8 | 5.91 ± 0.3 |
| 01/12/1992 | 1 | SW | ||||||||
| 30/11/1992 | 19 | SW | ||||||||
| 29/11/1992 | 2 | S | ||||||||
| 28/11/1992 | 0 | ANE | ||||||||
| 27/11/1992 | 5 | SW | ||||||||
| 26/11/1992 | 17 | W | ||||||||
| 25/11/1992 | 3 | SW | ||||||||
| 16 (9 to 15 & 17 to 19 same dmax as 16) | 58 491 | 46.9 | 27.94 | 01/02/1995 | 19 | 108 | 41.4 | W | 13.73 ± 0.9 | 11.97 ± 0.3 |
| 31/01/1995 | 16 | SW | ||||||||
| 30/01/1995 | 9 | ANE | ||||||||
| 29/01/1995 | 9 | C | ||||||||
| 28/01/1995 | 10 | C | ||||||||
| 27/01/1995 | 16 | S | ||||||||
| 26/01/1995 | 14 | N | ||||||||
| 25/01/1995 | 3 | C | ||||||||
| 24/01/1995 | 2 | W | ||||||||
| 23/01/1995 | 3 | CNW | ||||||||
| 22/01/1995 | 3 | C | ||||||||
| 21/01/1995 | 1 | C | ||||||||
| 20/01/1995 | 2 | C | ||||||||
| 19/01/1995 | 0 | CS | ||||||||
| 18/01/1995 | 0 | SW | ||||||||
| 17/01/1995 | 1 | CS |
2. Peak flow data
Highest instantaneous (15 min) peak flows (m3s−1) in each water year (1st October−30th September) were extracted from the 1975−2014 record. These annual maxima (AMAX) series were drawn from 260 gauged basins widely distributed across Great Britain (GB), within a 40 year block that provides the best compromise between spatial and temporal coverage. Our network of stations is non-nested (i.e. one gauge per basin) and covers 60.1% of GB land area (figure 1). This is equivalent to Network A used in a previous related study [43] but with more representative coverage across GB. The mean basin area (A) is 484 km2, ranging from 12 km2 (Pointon Lode) to 9948 km2 (Thames), and average basin elevation is 149 m a.s.l. Data were obtained from the National River Flow Archive using WINFAP-FEH v4.1: http://nrfa.ceh.ac.uk/content/winfap-feh-files-version-history and, for Scotland, from the Scottish Environment Protection Agency.
3. Methods
A pragmatic metric that defines the hydrological severity of a multi-basin flooding (MBF) episode, particularly one that highlights the spatial distribution of basins involved, is not yet available. So far, the severity of a single-basin fluvial flow is readily defined by the peak discharge, and it is also possible to rank MBF severity using the most extreme peak flow of the basins under study [23, 29]. Alternatively, severity may be defined in terms of economic impact [33, 35], but complete and comparable residential and commercial loss estimates are extremely difficult to obtain for all but the most severe historical events. Recent studies have begun to assess the severity of flooding episodes by considering the whole UK, effectively extending the paradigm applied to single-basin floods by looking at monthly mean river flows [3, 12] and seasonal river flow accumulations [4].
The MBF metrics proposed here are based on a deliberately straightforward procedure that counts the total number of basins involved in each episode. Our principal metric, denoted ng, uses the summed number of independent gauges that report a peak flow annual maximum (AMAX) within a given multi-day time window (L). This extends a previous single-day approach [43] to include MBF episodes where AMAX fall within a window of length of L days from 1 up to 19, ending on the day where most gauges report their AMAX, denoted dmax.
The following procedure was implemented (R code in supplementary data available at stacks.iop.org/ERL/12/114009/mmedia) to identify MBF and determine their ng. Firstly, for each day j determine ng,j and list these in descending order, creating the list of MBF episodes for L = 1 day. Then for each L > 1, using episodes of the L = 1 day list anew for each L, follow these 4 steps: (1) ascertain that the current episode (C) is the largest (i.e. greatest 1 day ng) as yet un-amalgamated remaining on the list; (2) identify any other basins reaching their AMAX within the specified time window before C; (3) add all their ng,j to C's count and flag the smaller episodes as being amalgamated with C, which prevents any day contributing to more than 1 episode for a given L; (4) repeat (1)−(3) until no more amalgamation is possible. Hence, when considering the ng metric, the most extreme MBF episode is defined as that with the greatest number of basins exhibiting near concurrent AMAX within the specified time window (L). However, two other characteristics were derived for each episode. These are: (i) the multi-basin Flood Yield (mFY, supplementary data A); and (ii) the total drained area (TDA) of the basins reaching their AMAX within an episode. These use the same list of episodes, and basins, defined by the ng metric, but an alternative quantity to rank severity. The mFY index is potentially biased towards small basins, whereas TDA intrinsically assigns greater weight to larger basins.
The AMAX dates for individual river basins are denoted event set A. Event set B comprises extreme MBF episodes with severity defined in terms of ng, taking the largest temporally distinct episodes defined by six key time windows with different lengths, varying from 1 to 16 days (figure 2, table 1), and the 10 next largest episodes in each key time window. Event set C contains the most extreme L = 13 days MBF episode for each water year defined using mFY, and set D is similar except defined by TDA. Event set E consists of the six most extreme episodes defined by ng (figures 2, 3(a) and (b), table 1). Replicated days are removed such that days occurring in two or more window lengths' episodes, necessary only in B and E, are never counted twice. Similarly, days with >1 single-basin AMAX are not counted repeatedly for national-scale analyses (figures 3(c) and (d)). Where different observations need to be shown basin-by-basin, multiple basins recording their AMAX are permitted to contribute on the same day (figure 4).
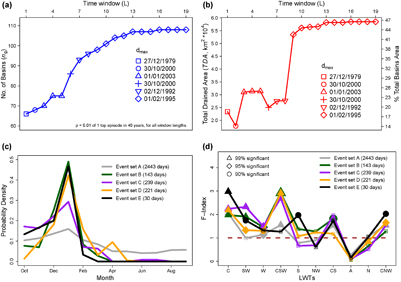
Figure 3. Characteristics of the extreme MBF episodes (event set E), compared to event sets A, B, C and D. (a) Maximum number of basins with concurrent AMAX (ng) versus window length (L), defining the most extreme episodes (event set E); (b) as in (a) but for total drained area (TDA), measured by km2 and by percentage (%) of total study area; (c) temporal distribution of peak flow AMAX occurrences for the extreme episodes in event sets A-E; and (d) frequency of Lamb Weather Types (LWTs) associated with event sets A-E with respect to their expected occurrence, calculated as a flood index (F-Index) [43]. Duplicated days in event sets in (c) and (d) have been removed. Significance was determined using the binomial test (supplementary data F.1 and F.3). The LWTs shown are based on event set E; event sets A-D also contain other LWTs (figure S2).
Download figure:
Standard image High-resolution image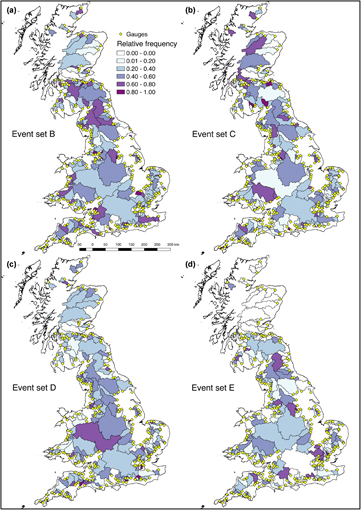
Figure 4. Distribution and relative frequency of occurrence of peak flow annual maxima (AMAX) within event sets B, C, D and E. (a) Event set B; (b) event set C; (c) event set D; and (d) event set E. The colour scale is a ratio (i.e. from 0 to 1) of AMAX occurrences in a given basin relative to the basin with the largest number in that panel, with dark colours indicating most occurrences.
Download figure:
Standard image High-resolution image4. Results
4.1. Characterizing severe multi-basin flooding (MBF) episodes
The most extreme multi-basin flooding (MBF) episodes defined by ng, i.e. by the concurrent number of basins reaching their peak flow annual maxima (AMAX), obtained from 19 time window lengths (L), comprise five temporally distinct episodes (event set E, figure 2 and table 1). These are: dmax = 27/12/1979 (66 basins involved, 18.6% of study area, window length L = 1 day); 30/10/2000 (68, 14.1%, L = 2 days); 01/01/2003 (75, 24.9%, L = 4 days); 02/12/1992 (96, 22%, L = 8 days); and 01/02/1995 (108, 46.5%, L = 16 days), with dmax representing the day, in each episode, where the largest number of AMAX have been recorded. If different time windows return the same date, the window with the largest number of concurrent AMAX is given. However, the L = 6 days episode (30/10/2000, figure 2(d), table 1) is included because the number of basins involved (86) and total drained area (TDA, 24 971 km2) are both much larger than the L = 2 days episode. Figure 2 shows the regional distribution and basin-by-basin Flood Yield (FY, supplementary data A) severity of these six episodes.
The ng metric ranges from 66 (L = 1 day) to 108 (L = 16 days), plateauing at L ≅ 13 days (figure 3(a)). For all time windows, the number of co-occurrences is notably larger than expected by chance (p < 0.01, binomial test, supplementary data F.1). The TDA ranges from 17 787 km2 (L = 2 days) to 58 491 km2 (L = 16 days), again plateauing at L ≅ 13 days (figure 3(b)). These areas correspond to a TDA percentage of 14.1% and 46.5% of the area of the 260 gauged basins respectively, or 8.5% and 27.9% of the total land area of Great Britain (GB, figure 3(b), table 1). Window length L = 13 days is used to define event sets C and D as it captures the largest episodes whilst retaining the maximum temporal resolution.
Figure 3(c) shows that the six most extensive MBF episodes (event set E) tended to occur during the winter (December−February), closely matching the pattern of event sets A-D. However, AMAX occurrences in January are more common for MBF episodes (event sets B-E) than for single-basin events (event set A). Spatially, event set E episodes impacted a substantial proportion of our study basins (figures 2 and 4(d)). However, when considering more episodes (event sets B-D) the spatial distribution of basins impacted is even larger, with all the study area affected (figures 4(a), (b) and (c)). Figure 4 shows also that the relative frequency of AMAX occurrences is homogenously distributed across all the basins for all event sets considered, possibly excluding Scotland for set E. This contrasts with precipitation distributions during winters dominated by westerly or cyclonic patterns [44], when rainfall tends to respectively decrease from west-to-east or is heavier in the east.
The average joining time (Jt, supplementary data B) for larger (A ≥1000 km2) and smaller (A < 1000 km2) basins within MBF episodes was compared. Considering time windows (L) separately for event set E (figure S3), only when L = 2 or 16 days do larger basins join significantly later than small ones (t-test non-paired, supplementary data F.2), and the delays were modest, just 0.1 and 1.8 days respectively (table 1). Event sets B-D replicate this, showing occasional significance but a difference in Jt <48 h. A time to peak (Tp) response analysis (supplementary data C) [45, 46] for larger basins further indicates Tp <40 h, again less than the ~13 day time-span that appears to define extreme MBF episodes.
4.2. Relationship to inundation episodes
Severity measured by ng is a proxy for overbank flow and fluvial flood extent. Only a fraction of the basins' areas will actually be inundated. However, the six extreme MBF episodes (event set E, figure 2) all resulted in widespread flooding demonstrating the relevance of the ng metric as a diagnostic:
- The December 1979 episode (figure 2(a)) was the most severe in South Wales since 1960 and in some areas the worst in a century, causing extensive floods that killed four people, necessitated the evacuation of hundreds and caused millions of pounds of damage [36].
- The Autumn 2000 episodes (figures 2(b) and (d)) were described as the most devastating in England since 1947, and associated with the wettest 12 month period since 1776 [37, 38].
- The January 2003 episode (figure 2(c)) was reported by the Environment Agency in FloodLink [39] with most severe floods in the East Midlands, where the Trent basin had 118 flood warnings and 14 flood watches issued between 29/12/2002 and 03/01/2003.
- The November/December 1992 episode (figure 2(e)) was reported by the UK Met Office [40] after floods impacted southern England during the night of 25th/26th November. However, the worst phase occurred on the 29th, when flooding in Wales devastated homes and caused widespread road and railway disruptions.
- The February 1995 episode (figure 2(f)) caused severe floods on at least 7 rivers, following heavy frontal precipitation in January 1995 which was 79% above the 1961–1990 average [41, 42].
4.3. Relationship to atmospheric patterns
Daily UK synoptic-scale atmospheric patterns are characterized by Lamb weather types (LWTs) [47, 48]. The frequency of LWTs for days during extreme single- and multi-basin peak flow episodes was compared with the entire 40 year catalogue of LWTs (figure 3(d)). In this comparison, a flood index (F-Index, supplementary data D) [43] is defined as the ratio of observed to expected frequency of LWTs. This was undertaken for event sets: A (2443 days), B (143 days), C (239 days), D (221 days) and E (30 days), excluding replicate dates. Statistical significance of the F-Index was calculated using a binomial test (supplementary data F.3).
Overall, the cyclonic (C-type) LWT is strongly associated with the peak flows with a 99% statistically significant F-Index ≥1.98 for all event sets considered, in particular flooding was ~3 times more likely than expected during C-type occurrences for event set E. The south-westerly (SW), westerly (W), and cyclonic SW (CSW) types are also associated with AMAX events (p <0.01, 0.05 and 0.1), and therefore more likely linked with widespread flooding. Southerly (S) types are significantly represented in event sets E, but not in event sets A-D (figure 3(d)). Therefore, a pattern of C- and W-types contributing to widespread peak flows is depicted and the multi-basin event sets B-E show very similar F-Index results when compared to single-basin AMAX (event set A, figure S4).
It is also of interest if these circulation systems are particularly 'wet'. Atmospheric rivers (ARs) are corridors of intense horizontal water vapour transport within the warm conveyor belt of extra-tropical cyclones (ETCs) [34, 49]. The dates of event set E episodes are compared with the Brands et al AR archive [50] derived from ERA-Interim reanalysis [51]. Four out of the five temporally distinct MBF episodes' most extreme flows (i.e. dmax dates) occurred on the same day as an AR, which on average happen on only 30% of extended (October–March) winter days (p <0.01, binomial test, supplementary data F.4).
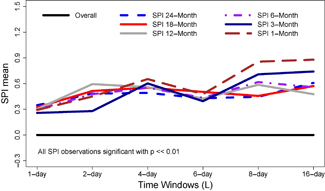
Figure 5. Mean standardized precipitation index (SPI) for episodes within event set B for each window length (L) and SPI time scale (24-1 Month). Lines are episodes' SPI averages with colours indicating: dashed blue = SPI 24 Month; red = SPI 18 Month; grey = SPI 12 Month; dashed purple = SPI 6 Month; dark blue = SPI 3 Month; dashed brown = SPI 1 Month. The black line represents the overall (40 year , 1975–2014) SPI average i.e. zero by definition. All episodes have SPI that are significantly different from the long-term mean at 99% level (t-test, not paired, supplementary data F.5).
Download figure:
Standard image High-resolution image4.4. Relationship with antecedent soil moisture conditions
Wet soil moisture antecedent conditions increases the likelihood of flooding [52]. The standardized precipitation index (SPI, supplementary data E) [53, 54] is widely used as a proxy for this physical property and 3–24 month SPI values are distinctively high for historical flooding episodes [55–57]. Whilst the sample of episodes in event set E is too small to show a pattern, SPI aggregated across impacted basins [58] is higher than average across all window lengths (L) for event set B (p ≪ 0.01, t-test non-paired, supplementary data F.5), increasing with L (figure 5). Event set C, based on the multi-basin flood yield (mFY) metric, by incorporating a forced regularized annual sampling, demonstrates that flood magnitude is greater in 'wet' spells (SPI >0.5) than 'dry' periods (SPI <−0.5) with mean mFY = 26.9±3.4 (1σ) and 17.1±1.3 (1σ) as calculated from SPI 12 Month. Indeed, for this comparison, all except SPI 1 Month are significant (p <0.05, t-test, 2-tailed). Event set D (based on TDA) shows no signal for this well-established flood-SPI connection, suggesting that the metric based on mFY might better reflect physical processes.
4.5. Relationship to very severe gales
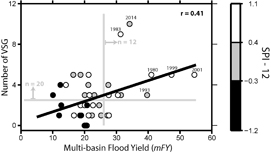
Flooding and severe wind have been reported for some ETCs impacting western Europe [3, 59]. A potential association between extreme MBF and severe storms was, therefore, investigated. In a year-by-year analysis the most extreme L = 13 days mFY episodes (event set C) correlates positively with the number of days with very severe gales (VSG) as defined by the Jenkinson Gale Index [48] in that year (r = 0.41, p = 0.0088, 2-tailed t-test, supplementary data F.6) (figure 6). Taking the most severe 50% and 30% of years for wind and flow respectively, co-occurrence is expected 6.0 times in 40 years, but 10 are observed (p = 0.021; Monte Carlo simulation with n = 10000), making coincidence of extremes 67% more likely than what would be expected by chance.
Figure 6. Number of very severe gales (VSG) versus extreme multi-basin Flood Yield (mFY) episodes for each water year (1975–2014, event set C). Black circles = SPI 12 month < −0.3; Grey circles = −0.3 < SPI 12 month < 0.4; White circles = SPI 12 month > 0.4. n = 20 represents the 50% most extreme VSG and n = 12 the 30% most extreme mFY episodes.
Download figure:
Standard image High-resolution image
Furthermore, the timing of these episodes is the basis for insights into the physical processes at work. For 5 out of 10 observed co-occurrences, the most extreme peak flows recorded on dmax are on a day with VSG, and 9 of 10 peak flows are within 0–13 days after a VSG day (p ≪ 0.001, binomial test). This contrasts with 0 out of 10 peak flow episodes found in the preceding 0–13 days of a VSG day. In agreement with the flood-SPI analysis, the relationship is notably less strong for event set D (based on TDA), indicating that mFY may better reflect physical processes in storm systems.
Wet ground is a pre-requisite to the most severe peak flow episodes, but there is also a link with gales. Six out of the 10 most severe episodes have a SPI 12 month between +0.4 and +1.1 (figure 6, white circles), whereas less severe episodes tend to show a negative SPI (figure 6, black circles). The two outliers in figure 6 (1983 and 2014) reflect previous studies [4, 44, 60–63] that showed that the number of cyclones were particularly high over the GB during these years. However, the largest mFY for these two episodes may be depressed by the AMAX measure of extremeness which, by definition, limits the number of occurrences per year. Therefore, these observations are likely valid given, if influenced by the analytical method used.
5. Discussion
5.1. A new multi-basin approach
We have presented various diagnostics for the evaluation of multi-basin flooding (MBF) episodes. The first metric (ng) detects key 'episodes' by summing the concurrent number of basins attaining their peak flow annual maximum (AMAX) within a given time window (L), then ranking the episodes based on ng. We also considered episodes ranked by total drained area (TDA) and multi-basin flood yield (mFY). When episodes are identified in terms of ng, this gives perhaps undue weight to small basins, but TDA emphasizes larger rivers. The mFY can either weight small basins, when calculated as here or large ones if area and flow were each summed before dividing them. All are practical options, but awareness of any biases and use of multiple metrics is recommended to ensure robust insights.
There are various advantages with this approach to MBF analysis. First, because of the different time windows (L) used within each metric, it enables the identification of extreme peak flow episodes that are driven by persistent rain-bearing weather systems by accounting for variations in time-lags between precipitation and peak flows, that depend on rainfall properties, basin area and geology. Second, it provides a national-scale flood measure allowing more meaningful comparison with synoptic-scale weather patterns than at the scale of individual basins, regardless of the catchment area [35]. Third, whichever metric is selected a return period that is applicable across a whole country can be estimated.
A single, national rather than basin-scale, return period has a potentially important role in risk communication. Such metrics could address the question often posed by flood managers: 'Why is there a 1 in 100 year flood event every year?' This impression arises because return period estimates are traditionally based on flows at a single gauge. The MBF metrics proposed here would yield the 1-in-100 year episode based on a return period estimate that integrates information across all basins in a network.
5.2. Widespread concurrent impacts
Our results show that extreme MBF episodes affect large areas (figure 2), with likely commensurate damages [36–42]. For instance, the L = 16 days episode captures ~46% of the study area, or ~27% of Great Britain (GB), with 108 basins concurrently reaching their AMAX (figures 2(f), 3(a) and (b), table 1). Aspects of the physical processes driving these widespread episodes appear similar to those deduced from single-basin studies [3, 4, 7, 8, 11–13, 15, 44]. First, W- and C- Lamb weather types (LWTs) associated with MBF (figure 3(d), table 1) have been linked to frequent floods [43, 64], the wettest winters in England and Wales [44], and >80% of extreme flows on the River Eden (UK) [64]. The W-type, in particular, represents one of the main drivers of high rainfall and flows in the UK [64, 65] as well as flooding throughout central Europe [e.g. 64]. Second, MBF is larger (by mFY) in wet years, i.e. when the SPI >0.5, and in longer time windows when the SPI is higher, suggesting antecedent soil moisture conditions may play a role. Third, as for single-basin floods [34], the most extreme MBF episodes coincide with atmospheric rivers (ARs).
The observation that single-basin flooding in GB occurs mostly during winter also applies to MBF (figure 3(c)). This is due to frequent storms and their associated precipitation [66], combined with lower evapotranspiration, and wetter antecedent soil conditions (figure 5) that ultimately combine to generate higher flows [11, 12]. However, compared to single-basin flooding, the largest MBF are even more strongly typified by occurrence in January (figure 3(c)), when the most favourable atmospheric flood-generating conditions (C, SW, W and CSW circulation types) are more likely. This close association with synoptic weather is not surprising, but neither it is required by or self-evident a priori from single-basin analyses.
A key feature that distinguishes large MBF from their single-basin counterparts is their duration (i.e. ≅ 13 days, figures 3(a) and (b)). This is greater than currently accounted for in other studies [28], and indicates that at least one notable source of persistence or 'memory' in the physical system is required. With a time to peak (Tp) <40 h [45, 46], these sources cannot be within the channelized flow paths, a view supported empirically by larger basins joining episodes at essentially the same time as smaller ones (table 1, figure S3). This observation also rules out, from the possible sources of 'memory', reservoirs delaying flow outside of the channels, and is reconciled by the fact that concentration time increases with basin area [67]. Thus, we postulate that a 'memory' exists in either antecedent soil or groundwater levels [55–57] (figure 5) and/or in persistent atmospheric patterns during notably wet years [3, 4, 12, 44, 59, 61], such as known ETCs clustering in extreme winters [63]. These elements of 'memory' likely exist for larger European rivers (e.g. Rhine), although they are less easily decoupled because time-scales attributable to the processes overlap more.
5.3. Compounding flood and wind impacts
Extra-tropical cyclones (ETCs) were identified as a driver of MBF, firstly via an association with cyclonic LWTs and ARs. Also, when considering these high flows in terms of extreme mFY for each water year within L = 13 days (event set C), a relationship with damaging winds predominantly caused by ETCs is also demonstrated. A significantly positive correlation exists between VSG and MBF, with co-occurrence of extremes 67% more likely than by chance and high flows occurring within 0–13 days after a VSG day. Hence, building on case studies of notable years [4, 12, 13, 44, 61, 62] and the Trent basin in central England [35], this is the first systematic, national-scale evidence that the severest aspects of wet and windy winters tend to co-occur and are linked by the physical processes associated with ETCs. Often these phenomena are viewed separately: severe ETCs bring extreme winds [68] whilst slower moving, less windy ETCs bring large accumulated rainfall totals and extensive flooding in GB [63, 66, 69]. Thus, our evidence of coincident widespread flood and wind on the same day in 5 out of 10 years and within 13 days in another 4 of those years contradicts a prevailing view that storms such as Desmond was exceptional in bringing both very severe wind and widespread flooding [3, 59]. These findings also highlight the importance of considering longer time-lags when assessing dependencies between weather-driven hazards where both may not occur in the same defined extreme episode. As far we are aware, this is the first statistical evidence of a time-lagged link between widespread flooding and severe wind for any nation. Our methodology also enables potential detection of such inter-dependencies elsewhere.
One implication of coincident floods and severe winds is that worst-case years are likely more severe than previously thought. With the association apparently strongest for the most extreme episodes, the effect of this co-occurrence likely increases combined flood-wind insurance losses for domestic UK properties in bad years [35]. Moreover, GB is located beneath the North Atlantic storm track and is, therefore, affected by the passage of ETCs [66] which bring extreme winds [68] that can subsequently affect central Europe [63, 70]. Since ETCs can continue to strengthen after landfall, this effect may extend to a much larger physical and financial scale than the GB alone. Furthermore, there is a likely three-way association between widespread flooding, severe wind and storm surges that warrants investigation.
5.4. Operational implications
The Environment Agency is responsible for contingency planning, forecasting and managing the consequences of widespread flood episodes. Regional 'footprints' of past severe episodes (figure 2) reveal the extent to which authorities in neighbouring areas could be impacted simultaneously. This is relevant when coordinating and sharing equipment and personnel during such episodes. For instance, the Midlands region of the Environment Agency lies in a pivotal location since it may be called upon to provide resources to affected areas to the North and South. During the severe flooding in December 2015, personal and equipment were drawn from regions hundreds of kilometres away from the epicentre of Northwest England and Southern Scotland. This might not be feasible in the event of a MBF episode on the scale of January/February 1995 (figure 2(f)). However, knowledge of the likelihood and pattern of MBF provides a basis for role-play exercises as part of the contingency planning for such episodes.
Both the UK National Flood Resilience Review [71] and UK Climate Change Risk Assessment [2] recognise interdependencies between critical networks (e.g. electricity, water and transport) and the need to manage indirect flood impacts on the economy. However, their emphasis remains on integrated, yet single-basin solutions involving 'natural' flood management, improved property- and asset-level resilience, and planning controls. Widespread flooding in Australia in 2011, and multiple events in Central Europe since 2002, show the need for a higher-level strategy for managing extensive, transboundary flooding [72]. Moreover, the likelihood of MBF could increase with ETCs intensity and ARs frequency and magnitude expected to rise under anthropogenic climate change [49, 66, 70, 73–75].
Acknowledgments
The authors thank the Scottish Environment Protection Agency for providing Scottish peak flow data, the Centre for Ecology and Hydrology for the SPI data, Swen Brands for providing the AR array along with detailed information, the RCUK (CENTA NERC) for the funding availability, the editor and two anonymous referees for their constructive comments. The authors declare no competing financial interests.
ORCID iDS
Paolo De Luca https://orcid.org/0000-0002-0416-4622
: Appendix
Appendix. Table of Notation Acronyms used within the text and full definition.
| Acronym | Definition | Unit |
|---|---|---|
| A | basin area | km2 |
| AMAX | peak flow annual maximum | m3 s−1 |
| ARs | atmospheric rivers | kg m−1 s−1 (integrated horizontal water vapour transport, IVT) |
| dmax | the last day of a multi-basin flooding episode, where the largest number of basins recorded their AMAX | day |
| ETCs | extra-tropical cyclones | − |
| FY | Flood Yield | m3 s−1 km−2 |
| F-Index | Flood Index | − |
| GB | Great Britain | − |
| HAs | hydrometric areas | − |
| Jt | joining time | days |
| L | time window | days |
| LWTs | Lamb Weather Types | − |
| MBF | multi-basin flooding | − |
| mFY | multi-basin Flood Yield | m3 s−1 km−2 |
| ng | metric with severity based on the number of basins concurrently reaching their AMAX within a given time window | − |
| SPI | Standardized Precipitation Index | units of standard deviation |
| Tp | time to peak | hours |
| TDA | total drained area | km2 |
| VSG | Very Severe Gales | G > 50 (G = gale index) [48] |