

Abstract
A primary subtropical evergreen broadleaved forest in southwest China experienced a particularly extreme snowfall event during January 2015. The 2015 event enabled the quantification of the impact of the extreme meteorological event on the forest carbon balance. We analyzed five years of continuous measurements of CO2 exchange across the biosphere/atmosphere interface in the forest using an eddy covariance technique. We quantified how exposure to an extreme meteorological event affected ecosystem processes that determine gross primary productivity (GPP) and ecosystem respiration (Reco), and thus annual net carbon (C) sequestration. The forest canopy was severely damaged by the heavy snow, and the leaf area index (LAI) decreased significantly from January to July 2015. GPP, net ecosystem exchange (NEE), and Reco all sharply decreased in 2015 after the heavy snow. On average, a strong decrease of 544 g C m−2 year−1 in annual NEE in 2015 was associated with a decrease of 829 g C m−2 year−1 in annual GPP and a decrease of 285 g C m−2 year−1 in annual Reco. Overall, annual net C uptake in 2015 was reduced by 76% compared to the mean C uptake of the previous four years. A sharp increase in carbon uptake was also observed in 2016, indicating that long-term, continuous measurements should be carried out to evaluate the overall response to the disturbance.
Export citation and abstract BibTeX RIS

Original content from this work may be used under the terms of the Creative Commons Attribution 3.0 licence.
Any further distribution of this work must maintain attribution to the author(s) and the title of the work, journal citation and DOI.
1. Introduction
Forest ecosystems are key components of the global carbon cycle and their carbon balance is strongly influenced by climate. Specifically, climate extremes, such as heatwaves, droughts, storms, or fires, can lead to a decrease in forest ecosystem carbon stocks (Bréda et al 2006, Reichstein et al 2013). In addition, trees take a long time to regrow and increase forest biomass. Hence, forest ecosystems are sensitive to climate extremes.
Primary subtropical evergreen forests are among the most important biomes globally because of their large primary productivity (Tan et al 2011, Tan et al 2012) and their role as hot spots of biodiversity (Beiderwieden et al 2007).
These forests are widely distributed and well protected in Yunnan province, southwest China. The Ailaoshan National Nature Reserve in southern Yunnan hosts about 5000 ha of primary subtropical evergreen forest. This area is exposed to monsoon regimes from the southwest and from the southeast.

Figure 1. The location of the study site (ALS: Ailaoshan). The figure was created using Arcgis 8.2 software (ESRI Inc., Redlands, CA, USA) (www.esri.com/software/arcgis/arcgis-for-desktop).
Download figure:
Standard image High-resolution imageWe used an eddy covariance approach to examine the carbon balance of a 300 year old subtropical evergreen broadleaved forest located within the Ailaoshan reserve. A previous study at this site suggested that this forest acts as a large carbon sink (Tan et al 2011). Therefore, even a small shift in climate conditions or in the severity or frequency of climate extremes could change the strength of the carbon sink.
A previous study in East Asian subtropical evergreen forest ecosystems showed that warming contributed little to photosynthesis, yet significantly increased ecosystem respiration. Consequently, warming could reduce NEE and weaken the existing carbon sink function (Tan et al 2012). A warming experiment in the primary subtropical forest increased soil temperature by 2.1 °C, and thereby increased heterotrophic respiration by 22.9% during a four year observation period (Wu et al 2016). The Dinghushan evergreen broad-leaved forest in southern China is undergoing a transition from a forest dominated by a cohort of larger individuals to a forest dominated by a cohort of smaller individuals in response to the warming and drying environment (Zhou et al 2013). Although several studies have investigated the effect of climate change on the carbon balance and forest biomass (Tan et al 2012, Wu et al 2016, Zhou et al 2013), little is known about the effects of climate extremes on the carbon budget of the primary subtropical forest.

Figure 2. Instruments mounted on the meteorological tower.
Download figure:
Standard image High-resolution imageYunnan province experienced a particularly extreme climate anomaly during January 2015, with a heavy snowfall of up to 50 cm in depth on the ground, which led to severe forest damage and many broken branches in large trees (supplementary figures S2 and S3 available at stacks.iop.org/ERL/12/104014/mmedia). Climate model simulations have shown that intense snowfall events are likely to become more frequent in this region in the future (Sun et al 2010). Therefore, the snow event provided a unique opportunity to directly evaluate how the carbon balance changes in response to damage in primary subtropical evergreen forests.
We analyzed five years of continuous measurements of CO2 exchange across the biosphere/atmosphere interface in the forest by means of the eddy covariance technique. The main objective was to quantify how exposure to an anomalously heavy snow affected ecosystem processes that determine GPP and Reco, and thus annual net C sequestration. The forest canopy structure is possibly changed due to the large and freshly broken branches. We hypothesized that the snow damage will strongly reduce the strength of the carbon sink in the primary subtropical evergreen forest.
2. Study site and methods
The study area is in the Xujiaba region of southwest China in the Ailaoshan National Nature Reserve at 24°32'N, 101°01'E and 2476 m above mean sea level (figure 1). It lies within a protected section of a 5100 ha evergreen forest with a stand age of more than 300 years (Yang et al 2007). Mean annual air temperature is 11.3 °C, with monthly mean values ranging from 5.4 to 23.5 °C. The site receives an annual average of 1840 mm of precipitation.
The soils are loamy alfisols. The top 10 cm of soil had a pH of 4.2, total organic C (TOC) content of 116 g kg−1, and total nitrogen (TN) content of 7 g kg−1 (Liu et al 2002, Chan et al 2006).
The forest was primarily dominated by Lithocarpus hancei (Benth.) Rehder, Machilus bombycina, Castanopsis rufescens (Hook.f.et Th.) Huang et Y.T. Chang, and Lithocarpus xylocarpus (You 1983). The mean canopy height was 20 m, tree density was 2728 ha−1, the median tree height was 9.0 m, median diameter at breast height was 9.5 cm, and the median basal area in the plot was 91 m−2 ha−1 (Schaefer et al 2009).
2.1. Microclimatic observations
An eddy covariance system was installed on a scaffolding tower at a height of 34 m above ground level, which is 14 m above the mean canopy height (figure S1). The eddy covariance (EC) flux system consisted of a 3D sonic anemometer (CSAT3, Campbell Scientific Inc., Logan, UT, USA) and an open-path infrared gas analyzer (Li-7500, Li-Cor Inc., Lincoln, NE, USA). The operation of the two instruments and the recording of raw data at 10 Hz were controlled by a datalogger (CR3000, Li-Cor Inc.). Instruments for measuring air temperature (Ta), air relative humidity (RH) (HMP45C, Vaisala, Helsinki, Finland), and wind speed (Ws) (A100R, Vector Instruments, Denbighshire, UK) were installed at seven heights (figure 2) and recorded at 30 m in intervals. Instruments for measuring wind direction (W200P, Vector Instruments) were installed at the top of the tower. Radiation sensors for downward, upward, short-wave, and long-wave radiation (CNR-1/CM11, Kipp & Zonen, Delft, the Netherlands) were installed at 26.5 m in height on a horizontal pole 3 m away from the tower. Further, photosynthetically active radiation (PAR) was measured using linear sensors (LQS70-10, APOGEE, Logan, UT, USA). Profiles of soil temperature (Tsoil) and soil water content (SWC) were measured at 0, 5, 10, 15, 20, 40, 60, and 100 cm in depth (CS616_L, Campbell; and 105 T/107 L, Campbell, respectively). Raw data were recorded at 30 m in intervals by a datalogger (CR1000, Li-Cor Inc.). Soil heat flux (G) was measured by two heat flux plates (HFP01, HukseFlux, Delft, the Netherlands).

Figure 3. The maximum snow depth in Ailaoshan station from 1997 to 2016.
Download figure:
Standard image High-resolution image2.2. Leaf area index measurements
Leaf area index (LAI) is an important biophysical parameter of canopy structure and an indicator for monitoring forest ecosystem dynamics. LAI was measured by a canopy analyzer (Model LAI-2200, Li-Cor Inc.). We sampled 20 sites, which were selected in a random sampling design to represent a different fraction of the total forest canopy in the 1 ha forest plot. The LAI-2200 measurement was the combined result of one of the top of the tower readings (34 m) followed by the average of 15 forest floor readings at each site. We calculated the standard deviation of LAI in each period. The LAI was measured on the 10th of every month and all measurements were made under overcast conditions to reduce the effect of scattered blue light in the canopy.
2.3. Data processing
GPP is gross ecosystem primary productivity (g C m−2 time−1) and can be expressed as:

where NEE is the net ecosystem CO2 exchange (g C m−2 time−1); and the balance between photosynthetic C assimilation and C-releasing respiration, Reco, is total ecosystem respiration (g C m−2 time−1). The carbon flux was computed using an eddy flux data-processing program from 30 m in time periods (Li et al 2008). To obtain daily, monthly, and annual sums, we performed a gap-filling routine. Generally, data gaps occurred at night when precipitation obscured the sensors, or due to power supply shortages. Three-dimensional rotation of the coordinates was applied to all half-hour wind components to remove the effect of instrument tilt and irregularity of the airflow. The flux data were corrected for the variation in air density caused by density fluctuations due to heat and water vapor fluxes (Webb et al 1980).
The missing data (about 18%) in flux and micrometeorological measurements, due to equipment failures, power-failures, and system maintenance, were filled using an online program based on standardized methods after Reichstein et al (2005) maintained by the Max Planck Institute (www.bgc-jena.mpg.de/~MDIwork/eddyproc/index.php). Gaps in the precipitation data subset were filled using data from a nearby weather station. Overall, the energy closure ratio was 0.70 using 30 m in data (figure S3). This is well within the range of values found at other FLUXnet sites (Wilson et al 2002).
Significant effects of soil temperature and soil water content on ecosystem respiration rates were determined by multiple linear regressions. All data processing and statistical analyses were conducted using the Statistical Analysis System (SPSS 22.0 Software, SPSS Inc. 2013, IBM, Armonk, NY, USA). Significant differences between means were tested using one way-ANOVA.
3. Results
3.1. Microclimate and canopy changes
The heavy snow event occurred over a three-day period between January 9 and 11, 2015. The amount of snow that fell over those three days was close to 50 cm in snow depth on the ground (figure 3). The early 2015 snow was the heaviest on record since 1997 for the ecological station.
To evaluate the impact of the 2015 heavy snow event on the ecosystem, we divided the data into two groups: the average for 2011–2014, which we considered a normal year and the amount for 2015. Figure 4 shows the mean daily course of the main microclimatic factors (Ta_1.5 m, PAR_1.5 m, wind speed at 1.5 m (Ws_1.5 m), soil water content at 5 cm (SWC_5 cm), and soil temperature at 5 cm (Tsoil_5 cm) averaged for 2011–2014, 2015, and 2016.

Figure 4. Annual variability of air temperature at 1.5 m (Ta_1.5 m, (a)), photosynthetically active radiation at 1.5 m (PAR_1.5 m, (b)), wind speed at 1.5 m (Ws_1.5 m, (c)), soil water content at 5 cm (SWC_5 cm, (d)), and soil temperature at 5 cm (Tsoil_5 cm), (e)), averaged over the period of 'normal' years (2011–2014), 2015, and 2016.
Download figure:
Standard image High-resolution imageIn general, Ta_1.5 m was higher than the average normal year since March 2015 (figure 4(a)). PAR_1.5 m in 2015 was higher than the average normal year, characterized by a maximum PAR of 92 μmol m−2 s−1 in May. Ws_1.5 m was higher than that in an average normal year during the rainy season. Soil water content in 2015 was also higher than in the normal years. SWC_5 cm in 2016 was higher than in 2015. Soil temperature under snow cover showed constant values above 0 °C. Immediately after snowmelt, Tsoil_5 cm exhibited an increase. In 2015, the main discrepancies compared to normal years were observed in the period March–December, which were characterized by a mean soil temperature 1.2 °C warmer than the average for 2011–2014.
LAI in each month of 2015 was lower than the average value during 2011–2014 (figure 5). Specifically, LAI from January to July in 2015 decreased significantly. From August 2015, LAI increased rapidly and the difference between the normal years and the anomalous snow year declined. LAI in each month of 2016 was higher than in 2015.
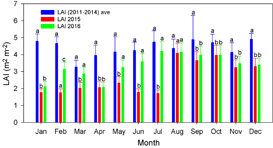
Figure 5. Annual variability of leaf area index (LAI) averaged over period of 'normal' years (2011–2014), 2015, and 2016. Bars indicate standard deviation. Different letters above bars indicate significant differences (one way ANOVA; p < 0.05).
Download figure:
Standard image High-resolution image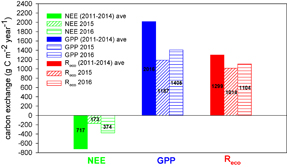
Figure 6. Actual change in ecosystem annual carbon for normal years (2011–2014), the anomalous snow year (2015), and 2016.
Download figure:
Standard image High-resolution image3.2. Ecosystem carbon flux changes
Annual GPP, NEE, and Reco were estimated during the study period 2011–2015. GPP, NEE, and Reco all sharply decreased in 2015 after the heavy snow event. On average, a strong decrease of 544 g C m−2 year−1 in annual NEE in 2015 was associated with a decrease of 829 g C m−2 year−1 in annual GPP and a decrease of 285 g C m−2 year−1 in annual Reco. Therefore, GPP in 2015 decreased by 41% and Reco decreased by 22%. Overall, annual net carbon uptake in 2015 was reduced by 76% (figure 6). An increase of 201 g C m−2 year−1 in annual NEE in 2016 was associated with an increase of 218 g C m−2 year−1 in annual GPP and an increase of 90 g C m−2 year−1 in annual Reco. Overall, annual net carbon uptake in 2016 sharply increased by 116% (figure 6). That is to say, this is a resilient ecosystem.
Figure 7 shows the annual course of GPP, NEE, and Reco averaged over the normal years (2011–2014), the anomalous snow year (2015), and 2016. The annual variation of NEE exhibited a different dynamic averaged over the normal years (2011–2014), the anomalous snow year (2015), and 2016. The values of NEE in normal years were negative (figure 7(a)), indicating the forest ecosystem persisted as a carbon sink. However, the values of NEE on some days in 2015 were positive and the ecosystem shifted between being a carbon sink and source. The values of NEE in 2016 remained at a middle level. GPP in 2015 was lower than in normal years (figure 7(b)). From May in 2016, GPP was higher than in 2015. The difference of Reco between 2011 and 2014 and 2015 varied greatly (figure 7(c)).
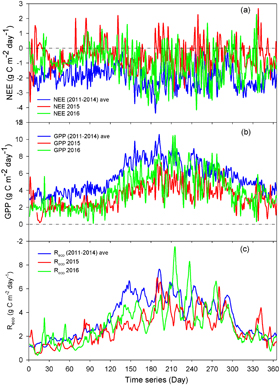
Figure 7. Annual course of NEE (a), GPP (b), and Reco (c) for normal years (2011–2014), the anomalous snow year (2015), and 2016.
Download figure:
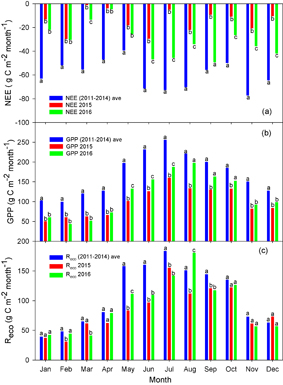
Standard image High-resolution imageFigures 6 and 7 provide an overall picture on an annual basis, but we were not able to distinguish contributions of the individual months. We therefore quantified the sum of GPP, NEE, and Reco for each month that contributed to the annual anomaly (figure 8). The NEE of each month in 2015 was significantly lower than the normal years, and NEE was even closer to zero in March of 2015 (figure 8(a)). The GPP of each month in 2015 was also lower than the normal years (figure 8(b)). From January to June, Reco was lower than the normal years, and the difference decreased gradually from July. Reco in December in 2015 was even higher than the normal years (figure 8(c)). Reco in August of 2016 was significantly higher than in 2016 (figure 8(c)).
Figure 8. Monthly sum of NEE (a), GPP (b), and Reco (c) for normal years (2011–2014), the anomalous snow year (2015), and 2016. Different letters above bars indicate significant differences (one way ANOVA; p < 0.05).
Download figure:
Standard image High-resolution image
4. Discussion
Selective logging is an important land use in forested areas throughout the humid tropics (such as the Brazilian Amazon and tropical areas of Asia) that results in high levels of forest damage and substantial losses of carbon from the primary forests (Pinard and Putz 1996). However, the primary old-growth subtropical evergreen broadleaved forest in our study has been carefully protected from logging in the Ailaoshan Nature Reserve. Moreover, the primary forest only rarely experiences severe natural disturbances, such as fire, windfall, insect attacks, or heat waves, underscoring its status as an old undisturbed forest. Therefore, the heavy snow provided evidence to directly quantify the effect of canopy damage on the carbon balance in the primary old-growth subtropical evergreen broadleaved forest.
A very broad and flat canopy in this primary broadleaved evergreen forest would catch a large amount of solar radiation and subsequently produce a large amount of photosynthetic carbon, but in the extreme snow year (2015), snow damage likely reduced photosynthetic efficiency. The large old branches were more likely to catch snow and more likely to break when snow did accumulate (figure S2). However, large old trees do not act simply as senescent carbon reservoirs but actively fix large amounts of carbon compared to smaller trees (Stephenson et al 2014). A single big tree can add the same amount of carbon to the forest in a year as is contained in an entire mid-sized tree (Stephenson et al 2014). A previous study at this site showed that the large old trees also did not stop sequestering carbon, but, rather sequestered a significant amount. Approximately 60% of the increases in biomass was contributed by the growth of large trees (diameter at breast height > 60 cm) (Tan et al 2011). The big branches of large trees that make up the canopy were broken and LAI decreased significantly. Overall, the heavy snow caused severe structural damage to the entire canopy with a total GPP loss of 41% comparing with normal year in this ecosystem.
Ecosystem respiration is composed of autotrophic (foliage, stems, and roots, etc) and heterotrophic (microbes, soil fauna, litterfall, and coarse woody debris (CWD), etc) components whose contributions to total respiration vary in space and time.
From January to June in 2015, GPP and LAI were significantly lower than the average of 2011–2014, likely because of a decrease in woody tissue respiration of foliage and stems after the snow damage.
Soil respiration is controlled by substrate supply (soil organic matter, litterfall, roots, etc) and environmental factors (soil temperature, soil water content, etc). Although a large number of fallen branches and leaves would maintain higher soil temperature and soil moisture content over longer periods without precipitation, the large fallen branches were fresh and had hard woody density (figure S3), resulting in slow decomposition rates before the rainy season. Therefore, the contribution of fallen branches to soil respiration was relatively small at the beginning. Thus, total ecosystem respiration in the first half of 2015 was lower than that in normal years.
With increasing temperature and rainfall in July, the LAI of the sublayer and canopy increased sharply, the respiration of foliage also increased. After half a year, the fallen branches were gradually broken down and converted into CWD (Chambers et al 2000). A previous study in a tropical rainforest showed that more than 75% of CWD carbon loss is through respiration (Chambers et al 2001). In addition, the fine branches and leaves also became litterfall, providing easily decomposable carbon for microbial growth, which leads to a positive feedback on soil organic matter decomposition (Chapela et al 2001, Wu et al 2014). Soil temperature and soil water content combined to promote ecosystem respiration (figure S4). On the other hand, the snowfall might lead to increases in tree mortality, resulting in root respiration change. The contribution of root respiration to total ecosystem respiration should be estimate in the further study. Ultimately, ecosystem respiration increased from July 2015 and even exceeded the respiration of normal years in December. Thus, the annual Reco only deceased by 22% in this forest. With the gradual decomposition of broken branches, Reco increased and Reco in August 2016 was even higher than the average value of the normal years.
An open canopy reduces the diffusion radiation ratio and subsequently weakens ecosystem carbon uptake (Gu et al 2002, Tan et al 2011). Overall, a 76% decrease was observed in the annual net CO2 uptake in the forest after the extreme snow event. Although the impact of a heavy snowfall depends on the specific climate anomalies, the 2015 event serves as an example that enables the quantification of the impact of such climate anomalies on the carbon balance.
Although the occurrence of extreme climate events, for instance droughts, heatwaves, storms, and associated disturbances, can offset carbon sinks or even cause net losses in carbon storage (Reichstein et al 2013), the mechanisms and impacts of extreme climate events on the carbon balance were different. For example, the heavy snow in this study broke the canopy structure. This sharply increased the growth of seedlings and saplings due to the open forest canopy, resulting in a sharp increase in carbon uptake in 2016 in comparison to 2015. To a certain extent, this was due to the physical damage.
However, drought or heatwaves can affect the whole ecosystem carbon balance and water cycle, including the canopy trees, seedlings, saplings, soil microbial communities, root distribution, and adaptation, as well as the associated competition among them (Reichstein et al 2013, Rowland et al 2015). Therefore, further research should address the integration of different mechanisms in studies of specific extreme events and provide a mechanistic basis for projecting the effects of different extreme events on the carbon balance (Reichstein et al 2013).
Although the five years of eddy-covariance data provided unambiguous evidence for a strong reduction in the carbon sink in this evergreen forest in 2015 and a sharp increase in carbon uptake in 2016, long-term, continuous measurements should be carried out to evaluate the overall response to the disturbance (Ciais et al 2005, Ma et al 2016), such as shifting competitive abilities between tree species, changes in forest micrometeorology, and changes in carbon pool decomposition and nutrient-supply processes (Ciais et al 2005, Ma et al 2016).
Acknowledgments
We thank Qi Luo and Han-Dong Wen for their assistance in the field. This work was supported by Ailaoshan Station for Subtropical Forest Ecosystem Research (ASSFE), Chinese Ecosystem Research Networks. This study was funded by the National Natural Science Foundation of China (41671209, U1602234, 31290221), the National Key Research and Development Program of China (2016YFC0502105) and the Yunnan Natural Science Foundation of Yunnan Province, China (2013FB077).