

Abstract
China has produced increasingly large quantities of waste associated with its accelerated urbanization and economic development and deposited these wastes into landfills, potentially sequestering carbon. However, the magnitude of the carbon storage in China's urban landfills and its spatial and temporal change remain unclear. Here, we estimate the total amount of organic carbon (OC) stored in China's urban landfills between 1978 and 2014 using a first order organic matter decomposition model and data compiled from literature review and statistical yearbooks. Our results show that total OC stored in China's urban landfills increased nearly 68-fold from the 1970s to the 2010s, and reached 225.2–264.5 Tg C (95% confidence interval, hereafter) in 2014. Construction waste was the largest OC pool (128.4–157.5 Tg C) in 2014, followed by household waste (67.7–83.8 Tg C), and sewage sludge was the least (19.7–34.1 Tg C). Carbon stored in urban landfills accounts for more than 10% of the country's carbon stocks in urban ecosystems. The annual increase (i.e. sequestration rate) of OC in urban landfills in the 2010s (25.1 ± 4.3 Tg C yr−1, mean ± 2SD, hereafter) is equivalent to 1% of China's carbon emissions from fossil fuel combustion and cement production during the same period, but represents about 9% of the total terrestrial carbon sequestration in the country. Our study clearly indicates that OC dynamics in landfills should not be neglected in regional to national carbon cycle studies as landfills not only account for a substantial part of the carbon stored in urban ecosystems but also have a respectable contribution to national carbon sequestration.
Export citation and abstract BibTeX RIS

Original content from this work may be used under the terms of the Creative Commons Attribution 3.0 licence.
Any further distribution of this work must maintain attribution to the author(s) and the title of the work, journal citation and DOI.
1. Introduction
Urbanization is a complex phenomenon that involves simultaneous changes in social, economic and environmental dimensions (Grimm et al 2008, Seto and Ramankutty 2016, Zhao et al 2016). We are witnessing the largest wave of urbanization in history characterized primarily by a dramatic shift of population from rural to urban areas and extensive physical expansion of urban land uses (Wigginton et al 2016). Contemporary urbanization has profound impacts on the biogeochemical cycles of the Earth system, both within cities and far beyond their boundaries, by transforming the land surface conditions, hydrology, and atmospheric chemistry (Kaye et al 2005, Churkina 2008, Grimm et al 2008, Seto et al 2010). Fundamentally different from natural ecosystems fueled by solar energy, the maintenance of urban ecosystems relies heavily on fossil fuels. Consequently, more than 75% of global anthropogenic carbon dioxide (CO2) emissions over the past century have been generated from cities (Lester 2002). On the other hand, large amounts of carbon have been found in urban environments not only in natural pools such as vegetation and soils but also in anthropogenic ones including buildings and landfills (Churkina et al 2010, Edmondson et al 2012, Zhao et al 2013). Therefore, the urban carbon balance constitutes a non-negligible component of the global carbon cycle; rigorously quantifying carbon flows and stocks in urban ecosystems is becoming increasingly important to ensure the completeness and accuracy of carbon cycle research and reporting at regional to global scales.
The carbon cycle of urban ecosystems has received increasing attention during recent years (Decina et al 2016, Milesi et al 2005, McKinley et al 2011). Existing studies have focused mostly on carbon storage in natural pools (Davies et al 2011, Hutyra et al 2011, Tang et al 2016), and rarely on carbon stored in anthropogenic pools such as landfills. With the growth of population and improvement of living standards, the amount of municipal solid waste (MSW) has soared across the world (Buenrostro and Bocco 2003, Pokhrel and Viraraghavan 2005, Karak et al 2012). The per capita MSW generation rate per year increased from 357.7–445.3 kg in the 1960s to 565–759.2 kg in the 2000s for developed countries and from 40.2–284.7 kg in the 1980s to 109.5–525.6 kg in the 2000s for developing countries (Chattopadhyay et al 2009, Troschinetz and Mihelcic 2009, Karak et al 2012). As the cheapest disposal method of solid waste, landfilling is currently the most common way to store MSW in most countries (Renou et al 2008). However, few studies (e.g. Churkina et al 2010, Churkina 2016) exist on investigating carbon storage in landfills over large areas and these studies differ in how landfill carbon dynamics (e.g. decomposition of landfill OC) may be represented. The combination of urban expansion and limited research on landfill carbon dynamics clearly calls for more regional to global studies to understand the role of landfills in the carbon cycle.
China has experienced unprecedented urbanization in parallel with its economic boom since the initiation of economic reforms and open-door policies in the late 1970s (Chan 2010, Zhao et al 2015a, 2015b). As the world's most populous country, its urban population grew from 0.17 billion in 1978 to 0.75 billion in 2014 (NBS 1979, 2015a). China's population is projected to be 1.45 billion by 2030 with 67% living in urban areas (UN 2014). From 1981 to 2014, the number of cities grew from 226 to 664 (NBS 1982a, 2015b), and the urbanized area increased from 7438 to 49 773 km2 (NBS 1982b, 2015a). Data from the Assessment Report for Household Waste Management show that the delivered quantities of household waste grew from 25.08 Tg in 1979 to 170.81 Tg in 2012 (Song 2015). China produces approximately 29% of the world's MSW each year (Dong et al 2001). No country has ever experienced such a magnitude and rate of increase in MSW as China is now going through (Beccali et al 2001, Wang and Nie 2001). Therefore, a thorough assessment of carbon stocks and dynamics in China's landfills may contribute greatly to understand the role of urban areas in the carbon cycle at regional to global scales.
In a previous study, we estimated carbon storage in China's urban areas but did not include carbon stored in landfills (Zhao et al 2013). Here, we use the Intergovernmental Panel for Climate Change (IPCC) methodology with consideration of degradation, along with data compiled from literature review and statistical yearbooks, to quantify the dynamics of carbon stored in landfills of Chinese cities from 1978 to 2014. Our main research questions are: (1) what are the magnitude, spatial pattern, and temporal change of OC stored in China's landfills? (2) What roles have the major waste sources played in contributing to landfill carbon storage in China and how are they different from those in the United States? (3) What are the most sensitive, therefore important, variables in studying carbon dynamics in China's landfills? To address these questions, we have the following specific aims: (1) estimate the OC storage in China's landfills at national, regional and provincial scales; (2) understand the temporal and spatial distributions of landfill carbon storage in China from different waste components; (3) quantify the uncertainty of estimates and perform a sensitivity analysis; and (4) compare our results for China with those estimated by Churkina et al (2010) for the conterminous United States to understand the role of cultural differences on carbon storage in urban landfills.
2. Materials and methods
OC storage in landfills includes carbon stored in waste from households, construction, and sludge from water treatment plants deposited at landfills. Household waste includes food, paper, textiles and wood. Construction waste mainly consists of construction, demolition, and decoration wastes. Because relevant information was lacking at the city level, we estimated the carbon storage in urban landfills at national and regional scales by combining the provincial-level statistical data and the data from extensive literature review (e.g. carbon content of each waste component).
The first simple MSW landfills in China were constructed in the 1960s (Chen et al 2012). Therefore, our estimation of landfill wastes starts from 1965. According to the IPCC methodology for calculating methane generation from solid waste disposal under different climate conditions (Pipatti et al 2006), the carbon storage in landfills (S(t)) at time t is calculated using the following equation (equation (1)):

where S(t)hou, S(t)con and S(t)slu are the landfill carbon storage from household waste, construction waste, and sludge, respectively. OC in industrial waste and medical waste are not included because of a lack of relevant data. We believe the impact is minimal as their contribution to the total waste is relatively small according to previous studies (Churkina et al 2010, Wang and Wang 2012).
The landfill carbon storage in household waste is calculated using the following equation (equation (2)):

where j ranges from 1 to 4 representing the four components making up household waste (i.e. food, paper, textiles, wood); OChou ij is the household waste inflow into stock j during year i; and kij is the decomposition coefficient for stock j during year i. It can be seen from the equation that the OC attributed to household waste in a given year (t) depends on the inflows and decomposition of OC in previous and current years (i = 1965,...,t).
The landfill carbon storage in construction waste is calculated using the following equation (equation (3)):

where j ranges from 1 to 3 representing the three components making up construction waste (i.e. construction, demolition, decoration); i and t are the same as in equation (2); kij is the decomposition of stock j in year i; and OChouij is the construction waste inflow into stock j.
The landfill carbon storage in sewage sludge is calculated using the following equation (equation (4)):

where OCslui represents the sludge waste inflow into landfill (note: there is only one component for sludge waste), and ki is the decomposition coefficient for sludge during year i.
The advancement of capping technology can significantly reduce the decomposition of waste in landfills and facilitate the permanent conservation of carbon deposited there. To the best of our knowledge, there is unfortunately no systematic study examining the effect of capping technology on the decomposition coefficient of waste in landfills across large spatial and temporal scales. China has widely adopted the phytocapping technology in urban landfill sites since the Tenth Five-Year Plan period (2001–2005). Technology generally advances in a staircase-like pattern. Accordingly, we used two decomposition coefficients k1 and k2 to represent the impact of landfill capping technology development with k1 from the IPCC model from the period from 1965 to 2002 (Pipatti et al 2006), and k2 since 2003 when the collection of statistical data of sanitary landfills began in China (Huang et al 2006, Chen et al 2010). The value k2 was derived from k1 and the affecting factor of capping technology (Pipatti et al 2006, Lamb et al 2014). The decomposition coefficients for different components, regions and periods are listed in table 1. The fractions of solid waste from construction, demolition and decoration, the percentage of decoration space in the completed floor space, the organic carbon content in construction waste, and the fraction of construction waste deposited to landfills are listed in table 2. The methods for quantifying the annual inflow of the waste components are presented in the online supplementary data available at stacks.iop.org/ERL/12/104013/mmedia.
Table 1. Default value and range of decomposition coefficient (k) for different components in different regions of China between 1965 and 2014.
| Components | k1 (1965–2002) (Pipatti et al 2006) | k2 (2003–2014) (Pipatti et al 2006, Lamb et al 2014) | ||
|---|---|---|---|---|
| Default value | Range | Default value | Range | |
| Northeast China | ||||
| Food | 0.185 | 0.1–0.2 | 0.043 | 0.023–0.047 |
| Paper | 0.06 | 0.05–0.07 | 0.014 | 0.012–0.016 |
| Textiles | 0.06 | 0.05–0.08 | 0.014 | 0.012–0.019 |
| Wood | 0.03 | 0.02–0.04 | 0.007 | 0.005–0.009 |
| Sewage sludge | 0.185 | 0.1–0.2 | 0.043 | 0.023–0.047 |
| Construction waste | 0.09 | 0.08–0.1 | 0.021 | 0.019–0.023 |
| North and Northwest China | ||||
| Food | 0.06 | 0.05–0.08 | 0.014 | 0.012–0.019 |
| Paper | 0.04 | 0.03–0.05 | 0.009 | 0.007–0.012 |
| Textiles | 0.04 | 0.03–0.05 | 0.009 | 0.007–0.012 |
| Wood | 0.02 | 0.01–0.03 | 0.005 | 0.002–0.007 |
| Sewage sludge | 0.06 | 0.05–0.08 | 0.014 | 0.012–0.019 |
| Construction waste | 0.05 | 0.04–0.06 | 0.012 | 0.009–0.014 |
| East, Central-south and Southwest China | ||||
| Food | 0.17 | 0.17–0.7 | 0.04 | 0.04–0.165 |
| Paper | 0.06 | 0.06–0.085 | 0.014 | 0.014–0.02 |
| Textiles | 0.06 | 0.06–0.085 | 0.014 | 0.014–0.02 |
| Wood | 0.03 | 0.03–0.05 | 0.007 | 0.007–0.012 |
| Sewage sludge | 0.17 | 0.17–0.7 | 0.04 | 0.04–0.165 |
| Construction waste | 0.15 | 0.15–0.2 | 0.035 | 0.035–0.047 |
Table 2. Parameters used in this study, and their uncertainties at 95% confidence intervals and sources.
| Parameters | Periods | Mean | Uncertainty | Reference |
|---|---|---|---|---|
| cfoo (10 g kg−1) | 1965–2014 | 7.22 | [4.33, 10.12] | (Ji et al 2005, Gao et al 2007) |
| cpap (10 g kg−1) | 1965–2014 | 25.96 | [22.25, 29.67] | (Ji et al 2005, Gao et al 2007) |
| ctex (10 g kg−1) | 1965–2014 | 30.12 | [24.65, 35.59] | (Ji et al 2005, Gao et al 2007) |
| cwoo (10 g kg−1) | 1965–2014 | 28.31 | [23.14, 33.48] | (Ji et al 2005, Gao et al 2007) |
| ccon (10 g kg−1) | 1965–2014 | 3.69 | [2.75, 4.63] | (Ji et al 2005, Gao et al 2007) |
| wh (%) | 1965–1978 | 10 | [7, 13] | (NDRC 2014) |
| 1979–1990 | 20 | [14, 26] | (NDRC 2014) | |
| 1991–2002 |  a a |
[0.7 mean, 1.3 mean]b | (NDRC 2014) | |
| wc (%) | 1965–2014 | 32.78 | [26.22, 39.34] | (Liu 2012) |
| ws (%) | 1978–2014 | 31 | [24.8, 37.2] | (Wang 2010) |
| dcon (kg m−2) | 1965–2014 | 55 | [44, 66] | (Lu et al 2008) |
| ddem (t m−2) | 1965–2014 | 1.35 | [1.08, 1.62] | (Lu et al 2008) |
| ddec (kg m−2) | 1965–2014 | 55 | [44, 66] | (Lu et al 2008) |
| fs (%) | 1965–2014 | 10 | [8.5, 11.5] | (Lu et al 2008) |
aThe formula was used to calculate the value between 1991 and 2002 according to the expert knowledge that the fraction of household waste deposited to landfill grows continually (NDRC 2014). bIt was assumed that the 95% confidence interval of wh between 1991 and 2002 was 0.7 × mean and 1.3 × mean.
It can be seen from the above description that the decomposition of OC in landfills in our study is calculated by waste component after stratifying the integrated waste into component waste streams of differing qualities. Our approach is different from the Pipatti et al (2006) algorithm in that the latter calculates the decomposition of waste as an integrated entity, not by its component. The values of most variables used in calculating the inflows and decomposition of landfill OC storage are derived from literature review or from statistical reports. As stated previously, we have quantified the 95% confidence intervals of all the variables given the available data. In the estimation of OC storage uncertainty, it is assumed that the uncertainty of all variables follows the normal distribution. A total of 10 000 Monte Carlo simulations were executed for these input variables to calculate total carbon values and uncertainty following the method of Zhao et al (2013). The values for all variables in each of the 10 000 calculations were randomly and independently drawn from their normal distributions.
3. Results
3.1. Temporal change
Total OC storage in China's landfills increased from 2.6 ± 0.1 Tg C (mean ± 2SD, hereafter) in 1978 to 244.7 ± 10.1 Tg C in 2014, with an average annual growth of 6.7 ± 0.3 Tg C yr−1 (figure 1, table S6). The total OC storage grew gradually before 1990 and a sharp increase occurred between 1990 and 1996. From 1997 to 2014, the total OC stock increased exponentially (figure 1(a)). Among the waste pools, construction waste is the largest pool across the entire time and increased from 2.2 ± 0.1 Tg C in 1978 to 142.4 ± 7.4 Tg C in 2014. The OC stored in household waste is the second largest pool, increased from 0.38 ± 0.01 Tg C in 1978 to 75.6 ± 4.1 Tg C in 2014. Sludge was the smallest OC pool, increased from 0.004 ± 0.002 Tg C in 1978 to 29.8 ± 10.1 Tg C in 2014.
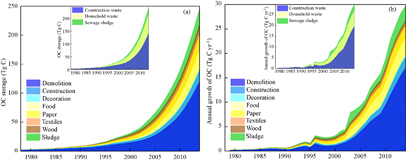
Figure 1. Temporal changes of carbon storage (a) and annual growth (b) for eight components (big graph) from three landfill pools (inserted wind) at national scale from 1978–2014.
Download figure:
Standard image High-resolution imageThe contribution of each pool and component in total OC storage has changed over time (figure 2). The share of OC storage in construction waste declined significantly from 85.1% in 1978 to 51.5% in 2004, and then increased slightly to 58.2% in 2014. In contrast to the trend of construction waste, the share of household waste grew continuously from 14.7% in 1978 to 35.7% in 2005, and then decreased slightly to 30.9% in 2014. The share of sewage sludge in total carbon storage in landfills increased slightly from 0.2% in 1978 to 1.1% in 1989, then increased dramatically to 12.8% in 2004, and remained around 10.8%–11.3% afterwards. The annual growth of total OC and its components generally increases over time (figure 1(b)). It was only 0.3 ± 0.1 Tg C yr−1 in 1979, gradually increased to 3.2 ± 0.8 Tg C yr−1 in 2000, and further grew substantially to 29.8 ± 10.1 Tg C yr−1 by 2014. The mean annual growth rates of total OC stored in the landfills for the 1970s, 1980s, 1990s, 2000s and 2010s are estimated to be 0.3 ± 0.1, 0.5 ± 0.1, 2.0 ± 0.9, 9.2 ± 0.5 and 25.1 ± 4.3 Tg C yr−1, respectively. The growth of OC in the construction waste, particularly in the component of demolition, played a very important role in the annual growth of total OC in the landfills, especially since the beginning of the 21st century. These are consistent with the trend of the total carbon stored in landfills over time.
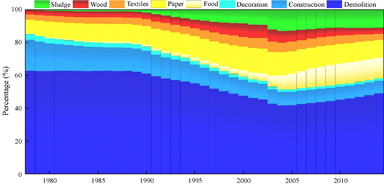
Figure 2. Temporal change of the contribution of each component to total OC storage (%) during the period between 1978 and 2014.
Download figure:
Standard image High-resolution image3.2. Spatial distribution and change
3.2.1. Regional scale
The order of the magnitude of total carbon storage by region is slightly different between 1978 and 2014 (figure 3). The spatial distribution of landfill-stored OC is characterized by higher values in east, north, and central-south China and lower OC in northeast, southeast, and northwest China (figure 3 and table S7). Landfills in east, north, and central-south China stored 0.64 ± 0.05, 0.55 ± 0.04 and 0.46 ± 0.04 Tg C in 1978 and 106.0 ± 8.6, 36.0 ± 1.8 and 49.9 ± 4.2 Tg C in 2014, respectively. The landfills in the northeast, southeast, and northwest together shared only 35.7% and 21.6% of the total OC in 1978 and 2014, respectively. The spatial distribution of OC stored in the three waste pools at the regional scale is similar to that of the total OC storage (table S8).
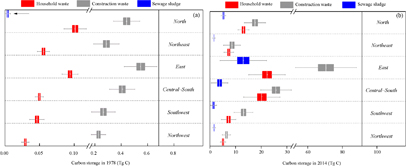
Figure 3. Carbon storage in China's landfills stored in three pools at regional scales for the year 1978 (a) and 2014 (b) at 95% confidence intervals.
Download figure:
Standard image High-resolution image3.2.2. Provincial scale
Furthermore, OC storage in China's urban landfills varied significantly at the provincial scale (figure 4). The top three provinces for landfill OC storage in 1978 are Shandong (0.17 Tg C), Hebei (0.17 Tg C) and Sichuan (0.18 Tg C), accounting for 20.2% of total carbon storage. The second group consists of nine provinces (or municipalities) each with OC storage ranging from 0.1 to 0.14 Tg C, together accounting for 40.9% of total national OC stock. The remaining 19 provinces, each with OC storage below 0.1 Tg C, comprised the remaining 38.8%. By 2014, the top four provinces are Zhejiang (29.4 Tg C), Jiangsu (28.9 Tg C), Guangdong (15.6 Tg C) and Shandong (14.2 Tg C), accounting for 40.3% of total carbon stocks in China's urban landfills, and the cities in the other 27 provinces together contributed about 60% of the total OC. The variation of the major OC pools and components by province is further described in the online supplementary data.

Figure 4. Carbon storage (Tg C) in the provinces (municipalities or autonomous regions) in China's landfills in 1978 and 2014 (except Taiwan, Hong Kong and Macao). BJ: Beijing, TJ: Tianjin, HB: Hebei, SX: Shanxi, IM: Inner Mongolia, LN: Liaoning, JL: Jilin, HLJ: Heilongjiang, SH: Shanghai, JS: Jiangsu, ZJ: Zhejiang, AH: Anhui, FJ: Fujian, JX: Jiangxi, SD: Shandong, HeN: Henan, HuB: Hubei, HuN: Hunan, GD: Guangdong, GX: Guangxi, HN: Hainan, CQ: Chongqing, SC: Sichuan, GZ: Guizhou, YN: Yunnan, TB: Tibet, SnX: Shaanxi, GS: Gansu, QH: Qinghai, NX: Ningxia and XJ: Xinjiang.
Download figure:
Standard image High-resolution imageThe carbon accumulation rate of OC in landfills at the provincial level is highly related to its OC storage in the 2010s (figure 5). Therefore, the spatial pattern of landfill carbon sequestration is similar to that of landfill OC storage across China. The top four provinces for landfill carbon sequestration are Zhejiang (3.4 Tg C yr−1), Jiangsu (3.3 Tg C yr−1), Guangdong (1.8 Tg C yr−1), and Shandong (1.6 Tg C yr−1).

Figure 5. Relationship between landfill carbon sequestration rate and carbon storage in provinces of China from 2009–2014.
Download figure:
Standard image High-resolution image3.3. Sensitivity analysis
The total OC storage estimates in China's urban landfills in 2014 are relatively insensitive (less than 4% change) to a 10% increase in each of the input variables (figure 6). The most sensitive variables are the OC fraction of construction waste and the fraction of construction waste deposited into landfills, with a sensitivity of 3.1%. The next sensitive group of variables are the fraction of solid waste density of demolition, percentage of demolition in the completed floor space and the floor space under construction, with a sensitivity of 2.6%. The third group of variables with a sensitivity of 1.6%, includes the household waste delivering quantity and the fraction of household waste deposited to landfills. The relative sensitivity of the fourth group of variables ranged from 1.0% to 1.5%, including decomposition coefficients of food and sludge before 2002 and after 2003. The sensitivities of the remaining variables are smaller than 0.7%. It should be noted that increased values of the decomposition coefficients generally lead to a decrease of total OC storage in the landfills as expected. The decomposition coefficient of construction waste has played a minor role in reducing the total uncertainty in the estimated carbon storage in China's landfills as its sensitivity is only −0.3%.

Figure 6. Sensitivity of total carbon storage in landfills to a 10% increase in the each of the input variables.
Download figure:
Standard image High-resolution image4. Discussion
4.1. Role of the landfills in storing carbon in cities
We found that OC storage in China's urban landfills was 75.9 ± 3.8 Tg C in 2006, while the total OC storage in China's urban ecosystems was estimated to be 653.1 ± 60.6 Tg C (table 3). It was estimated that the total carbon stock in China's terrestrial ecosystems amounted to 77.4 Pg C (1 Pg = 1015 g) around that time (Fang et al 2007, Yang et al 2007). This suggests that OC stored in landfills accounted for 11.6% of the country's urban ecosystem carbon stock and 0.1% of the country's terrestrial ecosystem carbon stock. However, the area of China's landfills in 2006 was only 85.7 km2 (MOHURD 2014), accounting for 0.25% of the urban area, and 0.0009% of the total land area of China. Consequently, the carbon density in landfills was much higher than that in urban areas and land areas, about 50 and 110 times the carbon density of the country's urban ecosystems and terrestrial ecosystems, respectively. The annual growth (i.e. sequestration rate) of OC in China's urban landfills has accelerated over the past three decades. It amounted to 25.1 ± 4.3 Tg C yr−1 in the 2010s, equivalent to 1% of China's carbon emissions from fossil fuel combustion and cement production during the same period (Liu et al 2015), but represents about 9% of the carbon sequestration in all terrestrial ecosystems in China for the period 2001 to 2005 (Tian et al 2011). Our results agree with the only existing study on urban carbon stocks that include landfill pools where Churkina et al (2010) found that landfills accounted for 11% of the carbon stored in urban ecosystems in the conterminous United States. Given the magnitude of carbon stored in the landfills and its change over time, they should not be neglected in regional to global carbon cycle research.
The landfills represent the third largest OC pool in urban areas in 2006 at both the national and regional scales, storing less carbon than soils and buildings but more than vegetation and humans (table 3). Landfill carbon pool accounted for 6.8%–17.3% of the entire urban ecosystem carbon storage in different regions. This indicates that the pool size of landfills is substantial, although it is relatively young in comparison to the natural pools of vegetation and soils (Churkina 2016). Furthermore, we found that landfills have surpassed the buildings, becoming the second largest OC pool at both the national and regional scales in the 2010s. According to the current growth trend and judging from the past 30 years, landfills could become the largest OC pool of China's urban ecosystems in the 2020s, ahead of soils. Carbon stored in landfills was an important pool of urban ecosystems, and should not be neglected in regional to global carbon cycle research.
Table 3. Organic carbon storage (mean ± 2SD) in natural and anthropogenic pools of China's urban landfills in 2006 at regional and national scales at 95% confidence intervals by combining the estimates from this study and our previous one (Zhao et al 2013).
| Region | Vegetation (Tg C) | Soils (Tg C) | Buildings (Tg C) | Humans (Tg C) | Landfills (Tg C) | Urban ecosystem (Tg C) |
|---|---|---|---|---|---|---|
| North China | 3.4 ± 0.9 | 38.8 ± 11.5 | 27.3 ± 5.5 | 0.6 ± 0.2 | 14.6 ± 0.7 | 84.8 ± 12.9 |
| Northeast China | 6.3 ± 2.0 | 62.0 ± 38.0 | 19.9 ± 5.2 | 0.6 ± 0.2 | 6.5 ± 0.4 | 94.2 ± 39.1 |
| East China | 18.7 ± 4.4 | 90.5 ± 19.7 | 70.5 ± 12.4 | 1.8 ± 0.5 | 29.4 ± 3.4 | 210.8 ± 23.7 |
| Central-south China | 10.2 ± 2.7 | 82.0 ± 30.5 | 53.3 ± 10.8 | 1.6 ± 0.4 | 14.4 ± 1.3 | 161.9 ± 32.5 |
| Southwest China | 3.0 ± 0.9 | 35.5 ± 17.3 | 22.6 ± 5.5 | 0.6 ± 0.2 | 6.5 ± 0.6 | 68.0 ± 18.2 |
| Northwest China | 0.8 ± 0.2 | 14.8 ± 4.5 | 11.9 ± 2.7 | 0.3 ± 0.1 | 4.5 ± 0.3 | 32.3 ± 5.2 |
| China | 42.4 ± 5.7 | 323.5 ± 56.7 | 205.6 ± 19.2 | 5.5 ± 0.7 | 75.9 ± 3.8 | 653.1 ± 60.6 |
4.2. Spatiotemporal patterns of OC storage in landfills
Our study shows that most of the OC in landfills is in the east and central-south, while a small amount of the OC in the southwest and northeast, which is largely consistent with the major east/west split of population density and degree of urbanization in China, namely the 'Hu Huanyong line' (Yang et al 2014). Similar results have been reported for the spatial patterns of CH4 emissions from China's landfills (Cai et al 2014), hazardous air pollutant emissions from municipal solid waste incineration (Tian et al 2012), and pollutants such as mercury (Liu et al 2016), black carbon (Wang et al 2012) and antibiotics (Zhang et al 2015). In other words, the waste and by-products are mainly produced in the economically-developed and populated areas. Zhejiang and Jiangsu, as the two most developed and urbanized provinces, contributed almost 25.0% of the total carbon storage in China's landfills. In contrast, Tibet and Qinghai, the least populated and urbanized autonomous regions/provinces in China, had the lowest landfill carbon storage. Another factor that might have contributed to the spatially uneven distribution of China's urban OC storage is the age of landfills (Churkina et al 2010). In general, the more developed the region or province is, the earlier a landfill has been created with more time to accumulate carbon there.
Construction waste constitutes the largest proportion of the total urban OC storage in landfills across the entire study period, not only at the national scale but also the regional and provincial scales, followed by household waste and sewage sludge. Among construction waste components, demolition waste accounted for most of the total OC storage for most provinces and most regions, suggesting that renovation, reconstruction, and recycling of the existing architectures have been important vehicles for realizing China's urbanization blueprint along with the rapid development of the nation's economy. However, the contributions of the components such as food, paper, wood, textiles and sewage sludge to the total OC in the landfills have increased significantly over time and diminished the relative importance of construction waste for nearly all the regions. This suggests that the composition of waste deposited into China's urban landfills has shifted in the past three decades with an increasing proportion from household waste and sewage sludge. The shift in the consumptive structure of Chinese urban residents has significantly affected the country's composition of waste deposited into landfills.
4.3. Comparisons with the United States
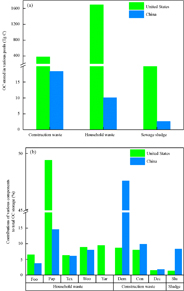
We compared the OC storage in landfills and its partitioning among various pools and components between China and the United States in the year 2000 (when the estimate for the United States was available) to shed light on the possible mechanisms behind the similarities and differences between the two large countries. The OC storage in China's urban landfills is much smaller than their counterparts in the United States, at about 1.5% of that in the United States. The OC stored in construction waste, sewage sludge, and household waste of China's urban landfills are 4.8%, 0.6%, and 9.4% of those in the United States, respectively (figure 7(a)). Obviously, construction waste is the largest carbon pool of landfills in China's urban areas, followed by household waste whereas household waste is the predominant carbon stock of landfills in the United States. Demolition and paper wastes are the largest contributors to the carbon pools from construction and household waste, respectively, in China. In contrast, paper in household waste accounts for almost half of the total OC in landfills of the United States (figure 7(b)). The size of sewage sludge carbon storage is smallest for both countries, but its contribution to the total OC storage in China is relatively higher than that in the United States (figures 7 (a) and (b)).
Figure 7. Comparisons of OC stored in three pools (a), and the fractions of eight components (b) between China and the United States by the year 2000 (Churkina et al 2010). Foo: food, Pap: paper, Tex: textiles, Woo: wood, Yar: yard trimmings, Dem: demolition, Con: construction, Dec: decoration and Slu: sludge.
Download figure:
Standard image High-resolution image
The above-mentioned discrepancies between the two countries might be explained by the following considerations. First, there is a huge gap in the coverage of waste deposited in the landfills between the two countries, although the estimated pools and components were consistent. The OC storage estimated in the landfills of the United States focused on human settlements including the portion generated from the exurbs (Churkina et al 2010), which was not included in our study for China. The waste disposal in the exurban and rural areas in China are generally unregulated garbage dumps and burning (Dong et al 2001, Zhang et al 2010, Wang et al 2011), which represents a fundamental difference in waste management practices between developed and developing countries (Bartone 1995, Zurbrugg 2003, Troschinetz and Mihelcic 2009). Second, the OC storage in the landfills of the United States during the year 2000 is based on OC inputs that accumulated from 1950 whilst our estimate for China's landfills is based on OC inputs from 1965 for construction and household wastes and from 1978 for sewage sludge (when the earliest data were available). With approximately two more decades of waste deposition, it is not surprising that OC storage in landfills of the United States is higher than that in China. Third, waste recycling in China (1.06%–23.38%) might be more efficient than that in the United States, resulting in a higher inorganic and a lower OC content in the landfills of China (Wei et al 2000, 1997). Plastic bottles, cardboard, wrapping and packaging paper, cans, and pretty much everything worth recycling are collected everywhere in China for recycling instead of being dumped into the landfills. Fourth, the difference in representing organic matter decomposition between our study and Churkina et al (2010) might have contributed to the discrepancy. Biodegradation of organic matter is likely to occur in the landfills despite the advancement of capping technology that could reduce the fugitive carbon release into the atmosphere after closure (Venkatraman and Ashwath 2008, 2007, Lamb et al 2014). Accumulative deduction of degraded organic matter present in the landfills from our study would result in a lower OC storage relative to the estimate that does not consider decomposition, as in the case of the United States study (Churkina et al 2010). Fifth, the component of yard trimmings in household waste, accounting for approximately 10% of total OC storage in the landfills of the United States, is not included in our estimate due to limitations in data availability. This is related to the fact that most Chinese urbanites live in high-rise apartment buildings in comparison with independent houses like the United States, so that yard trimmings are usually not a component of household waste in China. Sixth, differences in living and eating habits might have contributed to the large discrepancies in landfill carbon storage between China and the United States (Hossain and Haque 2009). For example, the wood used in Chinese buildings is about 20 kg m−2, less than half of that in the United States. The resultant carbon content of construction waste in China is 36.6 g kg−1, compared with 90 g kg−1 in the United States (Hu et al 1992, Churkina et al 2010). It is also not a surprise that the carbon content of food in China (72.2 g kg−1) is lower than that in the United States (508 g kg−1) (Barlaz 1998, Ji et al 2005, Gao et al 2007, Wang and Barlaz 2016) due to the difference in diet structure between China and the United States. Meat is a considerable part of the diet in the United States, while the Chinese diet is dominated by rice with vegetables and a little meat as a non-staple food.
4.4. Implications for the global carbon cycle
To the best of our knowledge, China and the United States are the only two nations that have estimates of their urban ecosystem carbon pools to date (Zhao et al 2013, Churkina 2016). Chinese cities are densely built and crowded while the cities of the United States have been relatively sparsely built with lower population (UN 2014). We followed the method from Churkina (2016) to calculate the global OC storage in landfills using the average carbon density in a unit urban area of China and United States as the two extremes. Using the global urbanized area of 658 760 km2 (Schneider et al 2009), the global OC stored in the global landfills in 2015 is estimated to be between 17.2 and 30 Pg C, with a best estimate of 23.6 Pg C. This amount is approximately equivalent to 4.3% and 1.5% of carbon reservoirs in terrestrial vegetation (∼550 Pg) and soils to 1 m depth (∼1576 Pg) globally (Post et al 1990, Eswaran et al 1993), respectively. In addition, the dynamic trajectory of OC storage in China's landfills clearly shows that the annual growth of total landfill OC store has been increasing at an accelerating pace from 0.3 ± 0.1 Tg C yr−1 in the 1970s to 25.1 ± 4.3 Tg C yr−1 in the 2010s. The current carbon sequestration rate in China's urban landfills is equivalent to about 9% of the total carbon sequestration occurring in all terrestrial ecosystems in China (Tian et al 2011). With accelerating rates of urbanization and resource consumption, there is no indication that urban waste generation and the yield deposited to landfills in the world will dwindle (Karak et al 2012). Therefore, quantifying temporal and spatial dynamics of carbon stored in the landfills is critical for understanding the evolution of carbon cycle from local to global scales.
Despite its large quantity, the carbon stock in landfills has received very limited attention, especially across large regions. In this study, for the first time, we quantified the spatiotemporal patterns of organic carbon stored in China's urban landfills at the national and regional scales, making China the second country, behind the United States, across the globe with a broad knowledge of its organic carbon storage in landfills at the national scale. However, uncertainty remains in our estimates as the input data compiled from literature review and statistical yearbooks contain various uncertainties. Our sensitivity analysis results might provide insights for reducing the uncertainty in future estimation. For example, reducing the uncertainty of demolition waste and food related variables might be the most effective way to improve the accuracy of estimates. In addition, a consistent and continuous measurement and monitoring of delivering quantities and their fractions deposited to the landfills, and carbon contents for various wastes are urgently needed for reducing the overall uncertainty.
Acknowledgments
This study was supported by the National key R&D plan of China Grant (2017YFC0503901), and the National Natural Science Foundation of China Grants 41571079, 41590843 and 31321061.