

Abstract
Typically 20–40 extreme cyclone events (sometimes called 'weather bombs') occur in the Arctic North Atlantic per winter season, with an increasing trend of 6 events/decade over 1979–2015, according to 6 hourly station data from Ny-Ålesund. This increased frequency of extreme cyclones is consistent with observed significant winter warming, indicating that the meridional heat and moisture transport they bring is a factor in rising temperatures in the region. The winter trend in extreme cyclones is dominated by a positive monthly trend of about 3–4 events/decade in November–December, due mainly to an increasing persistence of extreme cyclone events. A negative trend in January opposes this, while there is no significant trend in February. We relate the regional patterns of the trend in extreme cyclones to anomalously low sea-ice conditions in recent years, together with associated large-scale atmospheric circulation changes such as 'blockinglike' circulation patterns (e.g. Scandinavian blocking in December and Ural blocking during January–February).
Export citation and abstract BibTeX RIS

Original content from this work may be used under the terms of the Creative Commons Attribution 3.0 licence.
Any further distribution of this work must maintain attribution to the author(s) and the title of the work, journal citation and DOI.
1. Introduction
Extreme cyclone events often occur during Arctic winters, and are of concern as they are associated with anomalous warming events. These cyclones transport heat and moisture into the Arctic, which is associated with mixed-phase clouds and increased longwave downward radiation, and can cause temperatures to rise above freezing resulting in wintertime sea-ice melting or retarded sea-ice growth [e.g. Boisvert et al 2016, Persson et al 2016, Kim et al 2017]. These storms may even initiate earlier melt-season onset [Mortin et al 2016]. Such types of intense and rapidly deepening cyclones have been called 'weather bombs' [Sanders and Gyakum 1980], and can be associated with anomalous local warmings of up to 30 K [Graham et al 2016]. Changes in the occurrence of these extreme cyclone events and any linkages to climate warming and Arctic amplification are relevant for ship traffic safety in the Arctic and for their impacts on coastal ecosystems and infrastructure.
Two recent well-observed 'bomb' storms may serve to illustrate their nature: during the Norwegian young sea-ICE (N-ICE2015) campaign north of Svalbard in January/February 2015 a cyclone event had a minimum central pressure of 967 hPa and produced pressure drops of 12 hPa in 6 h [Graham et al 2016]; and the North Atlantic storm 'Frank' in December 2015/January 2016 had a minimum central pressure of 928 hPa and pressure drop of more than 24 hPa in 24 h (www.weathercast.co.uk/nc/weather-news/news/article/a_storm_to_remember.html). Several recent studies have presented the characteristics of winter 2015/2016 extreme cyclone activity, warming and related atmospheric circulation [Boisvert et al 2016, Overland and Wang 2016, Cullather et al 2016, Moore 2016, Kim et al 2017]. But how extreme winter cyclones in the Arctic have changed in recent decades remains an open question.
An increased occurrence of extreme cyclone events in the Arctic is plausibly associated with global warming via the poleward shift of storm tracks and sea level pressure decrease at Northern Hemisphere (NH) high-latitudes [IPCC 2013]. Contributing physical mechanisms that have been discussed are reduced sea-ice cover, increased sensible and latent heat fluxes, anomalous low-level diabatic heating, changed baroclinicity, and feedbacks on large-scale atmospheric circulation patterns [see review of Vihma 2014]. In the Arctic, cyclone intensity and frequency are greatest in winter [e.g. Zhang et al 2004], and winter is also the season where changes are largest. Reanalyses and Coupled Model Intercomparison Project Phase 5 (CMIP5) historical simulations indicate increasing trends in cyclone numbers and their intensities for the Arctic [Zhang et al 2004, Sorteberg and Walsh 2008, Vavrus 2013]. Both the number of deep cyclones entering the Arctic and those formed within it have increased, most markedly in winter [Sepp and Jaagus 2011]. However, CMIP5 mid-21st century projections suggest a future decrease in the frequency of extreme cyclones and 'bombs' in the NH winter, due to a longitudinally non-systematic shift of NH cyclone tracks [Chang et al 2012].
Previous studies on extreme Arctic cyclones have focused almost exclusively on the annual or seasonal means [Sepp and Jaagus 2011, Chang et al 2012, Vavrus 2013]. This relatively coarse sampling smooths the spatiotemporal characteristics of extreme cyclones, and can obscure factors such as the regional and global impacts of sea-ice—atmosphere interaction [Vihma 2014].
In this study we quantify the regional trends of extreme cyclone events in the Arctic during winter for the last 37 years (1979–2015), and explore their relationship with Arctic sea-ice and atmospheric circulation changes. Specifically, we examine trends of extreme Arctic winter cyclones in relation to the sea-ice retreat in winter. A further important aspect of our study is the monthly scale of our analysis (November–February), as opposed to seasonal means. Since most extreme winter cyclones occur over the North Atlantic sector of the Arctic [Vavrus 2013, Simmonds and Rudeva, 2014], we particularly focus on the Atlantic side of the Arctic Ocean. Here, the long-term meteorological record from Ny-Ålesund in Svalbard provides observational evidence for the discussion of extreme cyclones.
2. Data and methods
2.1. Station and reanalysis data
We use 6 hourly mean sea level pressure (SLP) data from three different data sets for wintertime (November–February). For January–February 2015 (19th January–21st February), we have SLP data from the N-ICE2015 campaign [Hudson et al 2015]. N-ICE2015 took place from 15th January to 22nd June 2015 in a region of pack ice north of Svalbard [Granskog et al 2016]. The N-ICE position was within 81–83.5° N, 16–28° E during January–February 2015. Spanning the full analysis period 1979–2015, we use SLP data from the Ny-Ålesund station (78.9° N, 11.9° E) in Svalbard. Finally, we use the ECMWF-Interim Reanalysis (ERA-I) [Dee et al 2011] SLP data north of ca. 60° N for 1979–2015. To compare ERA-I to the Ny-Ålesund station and N-ICE2015 data, we calculate the means over two (different-sized) boxes covering the Ny-Ålesund station and the N-ICE2015 track, respectively, rather than a single grid point (figure 1(f)).
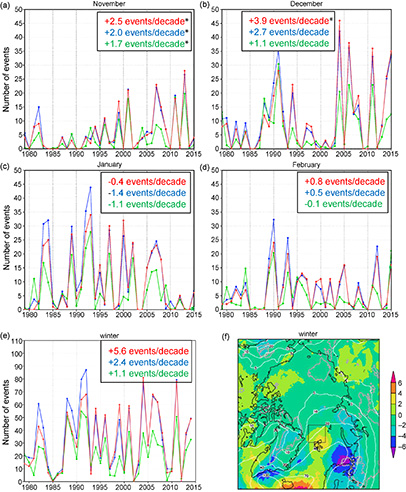
Figure 1. Time series of frequency of extreme cyclone events [events/year] over 1979–2015 for (a)–(d) winter months (November to February) and (e) overall winter, for Ny-Ålesund station data (red) and based on ERA-Interim (blue), and for N-ICE based on ERA-Interim (green). The N-ICE campaign-based numbers for January and February 2015 are given by a green cross. The calculated trends are marked by ⁎ if significant at the 90%-level. Panel (f) shows the spatial patterns of the frequency of extreme cyclone events based on ERA-Interim 1979–2015. The white isolines show the climatological mean number [events/winter], the colors show the trend [events/decade]. Trends significant at the 90%-level are marked by grey isolines. The land-sea mask is illustrated as thin black line. The small Ny-Ålesund and larger N-ICE boxes used for the ERA-I analysis are included.
Download figure:
Standard image High-resolution image2.2. Analysis method
Extreme cyclone events in this study are defined as extremely deep low-pressure events associated with the occurrences of instantaneous SLP below a threshold, which we choose as 985 hPa. This threshold corresponds to the 5th percentile calculated from the winter 1979–2015 time series of 6 hourly ERA-I SLP data for the N-ICE2015 grid box. Since we wish to identify instances of extremely deep low-pressure events, regardless of their origin or propagation, the approach we follow [e.g. Chang et al 2012, Vavrus 2013] does not require a cyclone tracking algorithm. Furthermore, this methodology is appropriate for studying anomalous SLP at a station or defined grid boxes. The frequency of deep low-pressure events is the count of such events (based on 6 hourly SLP data) for each winter month of each year. For ERA-Interim, we count the occurrence of SLP < 985 hPa for each grid point individually. Then we average the counts over the N-ICE and Ny-Ålesund grid boxes to get the numbers of extreme cyclone events for those. We also examined results using a lower threshold of 970 hPa, which is the 1st percentile of the time series, and arrive at the same key conclusions.
Our trend calculations are based on linear least-squares regression, with statistical significance assessed by a bootstrapping approach according to Kiktev et al [2003]. We also used Monte Carlo Singular Spectrum Analysis (MC-SSA) and wavelet coherence [Jevrejeva and Moore 2001, Grinsted et al 2004] to decompose the time series into (non-linear) trends and quasi-period signals, with significance testing against first-order autoregressive red noise matched to the observations to verify the existence of trends and oscillations.
Arctic sea-ice extent is taken from the National Snow and Ice Data Center (NSIDC; http://nsidc.org). We calculate cyclone composites based on the sea-ice extent in the four individual winter months November to February. We select the five years with the highest and lowest sea-ice extent in each of these months in the basis period 1979–2015 (SI table 1), following several previous studies [e.g. Screen et al 2011, Inoue et al 2012, Barnes et al 2014]. We repeated the sea-ice compositing based on a larger ensemble using the 10 years with highest and lowest sea-ice extent in each month (SI table 1) to check the robustness of the results with respect to the choice of the sea-ice years. Finally, we calculate for all composites the corresponding differences in the occurrence of extreme cyclone events 'Low minus high ice'.
3. Results
3.1. Occurrence and trends in the Svalbard region
From the Ny-Ålesund station data, we find that extreme cyclone events occur with highest frequency in mid-winter months (December: 10.3 events/year, January: 9.9 events/year), with lower numbers in November (5.7 events/year) and February (6.6 events/year) (figure 1). The Ny-Ålesund station data show an average of 32 extreme cyclone events per winter. The ERA-Interim data show a similar number for the Ny-Ålesund box and range of about 20–40 extreme cyclone events per winter in the N-ICE box. This corresponds to between 5–10 days of extreme cyclone conditions. All three time series clearly show a large interannual variability (figure 1(e)).
Significant positive trends in the number of extreme cyclone events over 1979–2015 are found for November and December only; the Ny-Ålesund station data show an increase of 2.5 events/decade and 3.9 events/decade, respectively (figure 1). Trends calculated for the eight 30 year moving windows (1979–2008, 1980–2009, etc.) range from 2.4 to 4.6 events/decade confirming the robustness of these positive trends for November and December (SI figure 1 available at stacks.iop.org/ERL/12/094006/mmedia). The MC-SSA also finds a non-linear trend significant at the 95% level for November. In contrast to the early winter (November–December) positive trends, no statistically significant change of extreme cyclone events was found for the later winter months (January–February) over the last 37 years. The linear trends in January and February show a small decrease and increase of events, respectively. Inspection of the moving 30 year trends hints at a regime change in January, revealed by a trend reversal after 2010 (SI figure 1). The possible presence of long-period oscillations mimicking trends precludes definitive conclusions about regime changes. The MC-SSA analysis detects a 95%-significant oscillation with a 3.3 year period in the February data, in contrast with other winter months where no oscillations were significant. The 3.3 year periodicity is likely related to the El Niño Southern Oscillation (ENSO) variability. There is strong evidence of dynamical linkages between ENSO and Northern Hemisphere winter air temperature and sea-ice conditions, probably not directly but rather through the ENSO interaction with the Arctic Oscillation (AO) [Lin et al 2002, Pozo-Vázquez et al 2001, Jevrejeva and Moore 2001].

Figure 2. Frequency of occurrence of consecutive extreme cyclone events based on Ny-Ålesund station data for winter months (November to February) for the first and recent 15-year periods (blue: 1979–1994, red: 2000–2015). The analysis is based on 6 hourly data, i.e. events which last for one day last for four consecutive synoptic time steps, etc.
Download figure:
Standard image High-resolution imageAnalysis of the individual monthly trends of extreme cyclone events reveals that the overall positive winter trend of 5.6 events/decade for 1979–2015 is dominated by the positive trend in early winter months (November–December), while the negative trend in later winter months (specifically Jan) competes against it (figure 1). We note that the winter trend over the recent period (2000–2015) is much smaller (4.0 events/decade) compared with that in the earlier period 1979–1999 (13.4 events/decade). However, it is important to emphasize the strong interannual variability in the Arctic North Atlantic region, though none of the variability was related to significant periods except for the 3.3 year periodicity in February. This implies that, while there is a lack of long-term memory in the system during the early winter, effects of long-term memory processes become evident later in the winter. This is consistent with large-scale processes dominating the mid-winter changes (section 3.3). Figure 1 reveals the co-variability of the occurrence of extreme cyclone events at Ny-Ålesund and the wider N-ICE2015 region, and hence the pack-ice region some hundred kilometers north of Svalbard. There is also agreement in trends for both regions, although the N-ICE2015 region has smaller magnitude trends. These results indicate that the Ny-Ålesund trends are representative for the broader Arctic North Atlantic sector. In addition, it confirms that most of the extreme cyclones which pass Ny-Ålesund continue their way further north/north-east into the Arctic Basin [Kayser et al 2017].
The increasing number of extreme cyclone events observed over the Arctic North Atlantic region can be due to either an increased number of distinct events of similar duration or an increased duration of individual events. Figure 2 shows the frequency distribution of extreme cyclone event counts as a function of consecutive synoptic time steps during both the first and last 15 year periods, based on the Ny-Ålesund station data. It is obvious that in November–December, events lasting two days and longer occur more often in the most recent period 2000–2015, than in the earlier period 1979–1994 Thus, it is not a higher frequency of relatively short events, but a shift towards longer duration of the extreme cyclone conditions, that is the key for the positive trend we have identified in early winter (November–December). In the later winter months (January–February) no obvious change in the distribution can be seen (figure 2).
To analyze the large-scale synoptic conditions and impact of the extreme cyclone events, we derive the anomalies from composites of all extreme cyclone events at Ny-Ålesund based on ERA-I climatological mean fields of several atmospheric parameters (figure 3). This shows that extreme cyclone events observed at Ny-Ålesund are associated with strong advection of warm and moist air into the Barents/Kara Seas, revealed by northward meridional wind and a warming of up to 7 K over a region extending from Scandinavia over the Barents/Kara Seas to Svalbard (figure 3). Over this region there is a positive longwave downward radiation anomaly of about 60 W m−2, which is likely associated with the presence of low-level mixed-phase clouds that contributes to the surface warming [e.g. Stramler et al 2011, Park et al 2015, Graham et al 2016]. The increased number of extreme cyclone events during winter is thus consistent with the observed significant winter warming in Svalbard [Maturilli et al 2015, Isaksen et al 2016], and studies suggesting that increased atmospheric heat and moisture transport from extreme cyclones strongly contributes to the positive temperature trend in this region [Maturilli and Kayser 2016, Woods and Caballero 2016, Graham et al 2016].
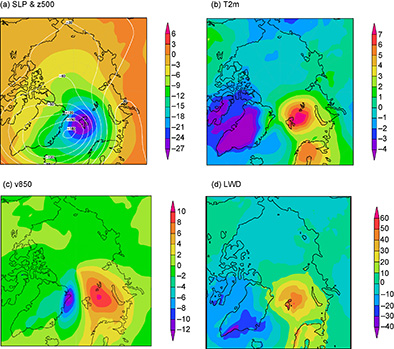
Figure 3. Mean anomaly patterns of atmospheric conditions during occurrence of extreme cyclone events at Ny-Ålesund (difference between the composite of all events and the climatology), averaged over winter (November–February) based on ERA-Interim 1979–2015. Shown are the anomalies of (a) mean sealevel pressure (SLP; hPa; color) and 500 hPa geopotential height (z500; gpm; white isolines), (b) 2 m air temperature (T2m; K), (c) 850 hPa meridional wind (v850; m s−1), (d) surface longwave downward radiation (LWD; W m−2).
Download figure:
Standard image High-resolution image
Figure 4. Spatial patterns of trend of frequency of extreme cyclone events [events/decade] for winter months (November to February), based on ERA-Interim data, 1979–2015. The colors show the trend. Trends significant at the 90%-level are indicated by white isolines. If the moving 30-year trends keep the same sign, it is indicated by grey isolines. The land-sea mask is illustrated as thin black line.
Download figure:
Standard image High-resolution image3.2. Spatial patterns of occurrence and trends
We extend our analyses from the Svalbard region to the circum-Arctic domain using ERA-I for the period 1979–2015. The highest frequency of extreme cyclone events in winter occurs in the regions known to be associated with the Icelandic low and North Atlantic storm tracks, such as southern Baffin Bay, south/south-east of Greenland, northern North Atlantic, Svalbard region, and Barents/Kara Seas (figure 1(f)); this is consistent with previous studies [e.g. Tsukernik et al 2007, Simmonds et al 2008, Vavrus 2013]. We calculate positive winter trends of extreme cyclone events (on the order of 2–6 events/decade) in most of these key regions, except for the Barents/Kara Seas region, which shows negative trends (figure 1(f)). Significant decreases of 4–6 events/decade over the Barents Sea and of 2–4 events/decade over the European Arctic are calculated. Extreme cyclones also show a significant negative trend of 2–4 events/decade over southern Alaska. There are few cyclones in the central Arctic and the region has no significant trend.
Monthly trend patterns of extreme cyclone events from ERA-I further indicate that the station-based results from Ny-Ålesund are representative for the Arctic North Atlantic sector (figure 4): This sector shows a widespread significant positive trend in November that is less widespread in December, a partly significant negative trend in January, and no significant trends in February. Trend analyses in moving 30 year windows indicate that both the positive trend over the Arctic North Atlantic in early winter months (November–December) and the negative trend over the Barents/Kara Seas and European Arctic in mid-winter months (Dec–Jan) are robust throughout the period. In contrast, changes in trend sign occur over the Arctic North Atlantic in late winter (January–February), which points to strong impacts from internal climate variability.
To summarize, we find a positive trend in the occurrence of extreme cyclone events over the Arctic North Atlantic region for the winter season, which is driven by an increasing persistence of extreme cyclones in the early winter months (November–December). In contrast, there is a negative wintertime trend in the region of the Barents/Kara Seas and European Arctic which can be attributed to respective decreases in the mid-winter months (Dec–Jan).

Figure 5. Spatial patterns of difference 'Low minus high ice' in frequency of extreme cyclone events for winter months (November to February). Each composite is based on the specific months with the five highest and lowest Arctic sea-ice extent in the associated specific month in the period 1979–2015 (table S1). The associated difference in sea-ice concentration is indicated by white isolines (of −0.2 and −0.6). The land-sea mask is illustrated as thin black line.
Download figure:
Standard image High-resolution image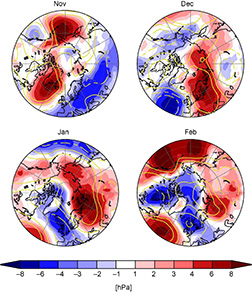
Figure 6. Spatial patterns of difference 'Low minus high ice' in mean sea level pressure (color shading; hPa) and 500 hPa geopotential height (yellow isolines; gpm; solid/dashed lines indicate positive/negative anomalies; in steps of −50, −20, +20, +50 gpm) for winter months (November to February). Each composite is based on the specific winter months with the five highest and lowest Arctic sea-ice extent in the period 1979–2015 (the same as for figure 5). The land-sea mask is illustrated as a black line.
Download figure:
Standard image High-resolution image
3.3. Impacts by sea ice and atmospheric circulation
On the interannual time scale over the Arctic North Atlantic region, the frequency of occurrence of cyclones is associated with the Arctic Oscillation/North Atlantic Oscillation (AO/NAO). The NAO can be considered to be the regional (North Atlantic) manifestation of the AO and the indices are highly correlated, thus we refer to the pattern here as AO/NAO [Thompson and Wallace 1998]. A positive phase of the AO/NAO is generally associated with more (extreme) cyclones and the negative phase with less [e.g. Simmonds et al 2008, Pinto et al 2009]. For the overall winter, the correlation between the occurrence of extreme cyclone events and AO/NAO indices (r=0.8 between AO index and Ny-Ålesund extreme cyclone numbers; SI table 2, SI figure 2) as well as the wavelet coherence between the time series of AO index and extreme cyclone numbers at Ny-Ålesund (significant at periods smaller than four years and larger than eight years; SI figure 3) reconfirm this relationship. But importantly, the correlation is not constant throughout the time series (SI table 2) and changes in extreme cyclone frequencies may occur unrelatedly to the AO/NAO variability [Sorteberg et al 2005]. Several recent warm winters with numerous extreme cyclones were characterized by average or negative AO/NAO phases [Nordli et al 2014].
During the winter months sea-ice retreat and related open waters are found over the Barents and Kara Seas, Greenland Sea, and Baffin Bay/Labrador Sea region (figure 5). The winter sea-ice retreat can affect the atmosphere via increased diabatic heating and various subsequent mechanisms which include the amplification of baroclinic cyclones and triggering planetary wave propagation [Vihma 2014 and references therein]. Figure 5 shows the 'Low minus high ice' composite differences in occurrence of extreme cyclone events, based on the sea-ice anomaly in the actual winter months, with positive differences indicating that anomalously low sea-ice conditions are associated with more cyclone events than high sea-ice conditions.
An increased number of extreme cyclones in response to low sea-ice conditions is evident around Svalbard and in the northern Barents Sea for early winter months (November–December). This suggests a direct 'local' forcing of extreme cyclone events by the regional sea-ice anomaly, and is consistent with processes such as increased heat fluxes over open water, boundary layer heating, strong low-level temperature gradients along the shifted sea-ice margin as well as additional moisture uptake in cyclone development and intensification [e.g. Magnusdottir et al 2004, Sato et al 2014]. These mechanisms lead to changes in baroclinicity in the marginal ice zone and can amplify baroclinic cyclones [Honda et al 2009, Inoue and Hori 2011], and thus contribute to the longer persistence of extreme cyclone events as observed at Ny-Ålesund (figure 2). The changes in extreme cyclone events include also pronounced large-scale features. For example, in December, there are less extreme cyclones under low ice conditions than in high ice years over the southern Barents Sea/Scandinavia and over the Greenland Sea where sea ice is reduced (figure 5). This response reflects the dominating influence of the large-scale atmospheric changes, which includes in December positive pressure anomalies centered over the Scandinavian region ('Scandinavian blocking') and negative anomalies over the North Atlantic (figure 6). This blocking can be described by the Scandinavia pattern (SCAND), which is determined by a rotated Principal Component Analysis of the 500 hPa geopotential height [Barnston and Livezey 1987] and belongs to the 10 leading NH teleconnection patterns in winter (www.cpc.ncep.noaa.gov/data/teledoc/telepatcalc.shtml). The pattern is characterized by a wave-train like structure with three centers of action. The primary center is situated over Scandinavia and is surrounded by weaker centers of opposite sign over western Europe and eastern Russia/western Mongolia. The positive phase of SCAND is characterized by a blocking anticyclone over Scandinavia and western Russia. Consistently, we find a negative correlation between the occurrence of extreme cyclone events and the SCAND index over the Arctic North Atlantic (SI figure 2; SI table 2). For the Ny-Ålesund extreme cyclones, we find that its correlation with SCAND becomes stronger for early winter (November–December) in the recent period 2000–2015, compared to the earlier period 1979–1999. The wavelet coherence confirms that the extreme cyclone numbers at Ny-Ålesund and the SCAND index are in anti-phase, significant at periods smaller than three years (SI figure 3).
In contrast to early winter (November–December), a 'local' sea-ice forced thermodynamic response in extreme cyclone events is not apparent in January and much less pronounced in February (figure 5). A strong reduction of extreme cyclones is obvious in the Barents Sea in January. During February, there are more extreme cyclones over the North Atlantic and most of the high Arctic, but these are not centered in the region of sea-ice anomaly. Other atmospheric dynamical mechanisms must play a dominant role here. Indeed, previous model experiments have shown that the sea-ice related anomalous heat fluxes can excite planetary waves and establish a mean wintertime large-scale response that resembles the negative AO/NAO phase [e.g. Alexander et al 2004, Deser et al 2010, Nakamura et al 2015]. This may account for the reduced occurrence of extreme cyclone events in the Arctic North Atlantic (specifically in the Barents/Kara Seas and the eastern Arctic) seen during January (figure 5). A negative AO/NAO phase corresponds to the presence of meandered or blocked flows [Woollings et al 2008]. Consistently, the related pressure patterns show that in later winter (January–February), a wave-train pattern, rather than a dipole pattern, emerges in relation to anomalously low sea ice (figure 6). This pattern includes a positive pressure anomaly (equivalent-barotropic structured from the surface to the upper troposphere) over western Russia. This is in agreement with previous studies which showed that such an atmospheric blocking (often called Ural blocking) is associated with the winter sea-ice loss over the Barents/Kara Seas [Luo et al 2016a, 2016b, Gong and Luo 2017]. This blocked flow leads to decreased Arctic North Atlantic cyclone activity, particularly over the Barents/Kara Sea region, as seen in January (figure 5).
In contrast to January, we find an increased occurrence of extreme cyclone events for February in response to lower sea ice (figure 5). This contrasts the recorded trend in ERA-I for February, which shows little to no change in the number of extreme cyclones (figure 4). Our result can be discussed in relation to the findings of the modeling study by Petoukhov and Semenov [2010]. They found a positive AO/NAO response for February to reduced winter sea-ice concentration in the Barents/Kara Seas from 100% to 80% or from 40% to 1%. Importantly, they propose a strong nonlinearity of the atmospheric circulation response to gradually reduced sea-ice concentration in the Barents/Kara Seas. We recognize in the associated circulation response the above mentioned wave-train-like pattern, with positive pressure anomalies over western Russia ('Ural blocking'), negative anomalies over the Arctic Ocean and positive anomalies over the North Atlantic (figure 6), which however shows some similarity with a positive NAO-like response. The result is also consistent with Inoue et al [2012] who showed that the cyclone tracks tend to be spread out into the Arctic North Atlantic, with some heading directly toward the North Pole during anomalously low sea ice in the Barents Sea in winter.
Importantly, the presented results are not an artefact of the compositing. The same monthly response in extreme cyclone occurrence to sea-ice retreat is calculated by applying a different compositing using 10 lowest and highest sea-ice years (SI figure 4); the spatial patterns look the same as for the original sea-ice compositing (figure 5). However, inspecting the results for different periods (e.g. for the first or last 15 years; not shown), beside similarities in the patterns we also detect specific regional differences in the sea-ice anomaly and the associated response of extreme cyclone events. Thus, pronounced nonlinearity is inherent in the extreme cyclone response and we support the suggestion by Semenov and Latif [2015] that the response seems to be sensitive to the background sea-ice cover and the location of sea-ice loss [Rinke et al 2013, Pedersen et al 2016, Screen 2017].
Wavelet coherence between Arctic sea-ice extent and extreme cyclones at Ny-Ålesund shows the strongest relationships in January (SI figure 3). Interestingly, we find two phase regimes, and the physical explanation for the coherence phases are the following. At periods shorter than 2 years from about 1985 to 2005 the phase relations (pointing downward, angle of 90°) show that sea-ice extent minima lead cyclone maxima. Differently, at periods from 4 to about 7 years the phases (pointing upward, angle of 45°) suggest cyclones maxima lead sea-ice minima by 6 months to 1 year. Thus, the short-term response supports the sea-ice induced baroclinicity-driven cyclone changes, while the longer period response may indicate a common response to large-scale atmospheric patterns such as AO/NAO.
4. Conclusions
Using a combination of station data from Ny-Ålesund and ERA-I, we find a positive trend in extreme cyclone events over the Arctic North Atlantic in winter. This trend is closely associated with the significant winter warming of the region. Composite analyses of extreme storm events at Ny-Ålesund reveal the importance of associated anomalous heat and moisture transports from mid-latitudes for Arctic amplification, in accordance with previous studies. From the observational point of view, we find that Svalbard is located in a key region of climate change, and long-term observations from the Ny-Ålesund station are representative for the broader Arctic North Atlantic region.
Importantly, we show that trends in the number of extreme cyclones for individual winter months are not uniform. Specifically, we find a widespread positive trend in earlier winter months (November–December). This is due mainly to an increase in the duration of individual cyclone events. In contrast, we calculate a negative trend in January, while there is no significant trend in extreme cyclone events for February.
Our analyses indicate that changes in the occurrence of extreme cyclone events are associated with sea-ice and atmospheric circulation changes. The final response over the Arctic North Atlantic region in each winter month is a result of complex, nonlinear mechanisms. In early winter (November–December), the positive trend in extreme cyclones can be associated with both the sea-ice-related 'local' diabatic atmospheric heating and change in baroclinicity, and remote changes in atmospheric circulation in response to the sea-ice retreat.
In late winter (January–February), large-scale atmospheric feedbacks play the dominant role. The decreased occurrence of extreme cyclones in January can be associated with an atmospheric blocking pattern, related with the Ural blocking. The lack of any significant trend in extreme cyclone events for February seems indicative of significant nonlinear feedbacks and a complex compensating interplay between different atmospheric dynamical mechanisms (e.g. the regional change in baroclinicity, planetary wave excitation, and potentially the AO signal via the stratosphere pathway initiated by autumn sea-ice loss and snow cover). Some studies have suggested future substantial shifts in the large-scale atmospheric circulation, such that the positive AO/NAO trend will weaken and that the magnitude of the Arctic dipole pattern will increase [e.g. Zhang et al 2008, Overland and Wang 2010]. If this were to happen, then the decrease of extreme cyclones caused by the atmospheric response to sea-ice loss (e.g. negative AO/NAO and blocking events in late winter January–February) might become more important for the overall winter change in extreme cyclones in future. In this respect, it is not a priori clear how they will change in the Arctic in future projections.
Acknowledgments
This study has been supported by the SFB/TR172 'Arctic Amplification: Climate Relevant Atmospheric and Surface Processes, and Feedback Mechanisms (AC)3' funded by the Deutsche Forschungsgemeinschaft (DFG). This work has been further supported by the German Academic Exchange Service (DAAD) PPP Norway and by the Helmholtz Climate Initiative REKLIM. R.M.G., L.C., S.R.H. acknowledge the support by the Norwegian Polar Institute's Centre for Ice, Climate and Ecosystems (ICE) through the N-ICE project, and L.C. is funded by the ID Arctic project. Time series of the Ny-Ålesund station pressure data were provided by the Alfred Wegener Institute (AWI) and the Norwegian Meteorological Institute (met.no). We acknowledge the provision of sea-ice extent data by the National Snow and Ice Data Center (NSIDC) and of ERA-I data by the ECMWF. The authors thank the two anonymous reviewers for their useful suggestions in improving this manuscript.