

Abstract
We have studied the influence of offshore marine constructions on the moon jellyfish population in the Adriatic sea, where the newly set up substrates enable the formation of a new population based in the formerly unpopulated open waters. Our five-year long computer simulation uses a high resolution coupled bio-physical individual-based model to track the dispersal of the offspring from subpopulations originating from offshore and shore-based sources. According to our study, the platforms enhance connectivity between subpopulations of jellyfish polyps, help sustain existing shore-based subpopulations, contribute to jellyfish blooms in some areas, and play an important role in establishing connection with the rest of the Mediterranean, in addition to representing substantial amounts of available substrate. This is an aspect that is usually overlooked when evaluating the ecological impact of existing and future wind farms, oil and gas platforms, etc. Our approach could serve as a role model in future studies of ecological impacts of planned offshore constructions.
Export citation and abstract BibTeX RIS

Original content from this work may be used under the terms of the Creative Commons Attribution 3.0 licence.
Any further distribution of this work must maintain attribution to the author(s) and the title of the work, journal citation and DOI.
1. Introduction
Recent decades have seen a sharp increase in the presence of man-made coastal and offshore constructions in the world's oceans. With the recent push towards renewable energy (e.g. wind farms), the numbers have skyrocketed, and that is just a fraction of what is to expect in the future. For example, the power capacity of European offshore wind installations has more than doubled in three years (4994 MW in 2012 to 11027 in 2015 (Ho et al 2016)). At the same time, more and more questions have been raised regarding an increased presence of jellyfish in our seas (Attrill et al 2007, Brotz et al 2012, Condon et al 2013), and there are substantiated concerns about a more gelatinous future (Richardson et al 2009).
Jellyfish (Cnidaria, Medusozoa) are a regular and probably important part of the ocean's ecosystem, but when they appear in large numbers, they are a nuisance to fishermen, tourists, and some species are known to shut down power plants and desalination facilities by clogging their water intakes (Richardson et al 2009, Purcell 2012, Gershwin 2013). They clog fishing nets, shut down beaches for swimmers, and as voracious zooplankton predators they deplete the fish larvae and food for plankton feeders (Graham et al 2014). When decomposing in large numbers, they cause significant shifts in the bacterial community (Tinta et al 2010, Tinta et al 2012) what may have implications for the nitrogen cycle in the water column (Tinta et al 2016). Although the moon jellyfish are often considered to be harmless as their sting is painless for humans, Gershwin (2013) cites several cases where they wiped out entire fish farms or clogged power plants water intakes.
The life cycle of moon jellyfish (Aurelia spp.) is complex, as in most scyphozoans (Arai 1997), and consists of different life stages (figure 1). The polyps produce free swimming juvenile medusae (ephyrae) through a process called strobilation (forming of strobilae at the oral end of the polyp). They are also capable of asexual reproduction by budding and forming of stolons. The ephyrae gradually grow into adult jellyfish, which reproduce sexually: male medusae release sperm cells in the water column which fertilize eggs inside female medusa and the female releases fertilized planulae. The polyps develop from the latter, but need a suitable substrate for attachment. They preferably attach to downward facing solid surfaces (Schiariti et al 2015), and since the availability of these is scarce in nature, they can be predominantly found on man-made structures (Di Camillo et al 2010, Malej et al 2012, Duarte et al 2012, Purcell 2012, Makabe et al 2014). These could act as an extension of their habitat into unpopulated areas, and in some cases even as stepping stones bridging natural gaps which prevent further dispersal.
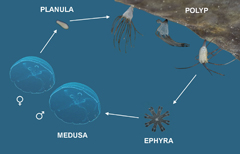
Figure 1 Life cycle of moon jellyfish (starting from the top in clockwise direction): polyp, budding polyp, strobilating polyp, ephyra, medusa, planula. Not to scale.
Download figure:
Standard image High-resolution imageAs an area rich in natural gas, the Adriatic sea (figure 2) is no exception to the recent boom in offshore construction. The first platforms were introduced in the 1960s, and at the end of the century there were roughly hundred present in the area (Manoukian et al 2010). In the last decade and a half, that number rose by about 50% and in 2015 the plans were revealed for an accelerated development of natural gas extracting facilities in the Croatian waters (CHA 2015). A long term analysis of jellyfish blooms has shown an increase in frequency in recent decades (Kogovšek et al 2010), and it is reasonable to suspect that there might be a connection between increased presence of jellyfish and the amount of introduced man-made substrate (Duarte et al 2012).
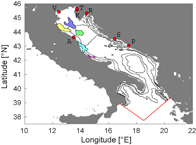
Figure 2 Adriatic Sea with locations of release zones used in the simulation. Ports are marked with red dots and following letters: A—Ancona, V—Venezia, T—Trieste, K—Koper, R—Rijeka, S—Split, P—Ploče. Zones that represent platforms are drawn in following colors (listed north to south): blue—P1a, yellow—P2, green—P1b, cyan—P4, magenta—P3. Isobaths are drawn at 50 m, 100 m, 500 m and 1000 m depths. The red lines show the SE and SW open boundaries of the ocean circulation model.
Download figure:
Standard image High-resolution imageThe elusive nature of moon jellyfish polyps (approx. 1 mm in size) has led to the dead end of numerous search efforts in the area. They have only been found attached to man-made structures in the port of Split (figure 2), the port of Ploče (Ante Žuljević, personal communication), the port of Koper (Malej et al 2012), on a wreck in the vicinity of Ancona (Di Camillo et al 2010), on a pier in front of the port of Ancona (Cristina Gioia Di Camillo, personal communication), and on a gas platform (Donat Petricioli, personal communication). More important is the fact that until now they have not been found on natural substrate in this area.
The observations of medusae presence are scarce, hard to perform, and lack a consistent methodology, so it is challenging to get a clear spatial and temporal picture using such data. In this case computer modeling can give us a deeper insight into the dynamics of the jellyfish population and connectivity between subpopulations in the area.
We used a combination of a high resolution circulation model, driven by realistic atmospheric and ocean boundary conditions, and an individual-based model which represents the moon jellyfish life cycle as accurately as possible, given the available knowledge about the species, available time and computing power. This way it is reasonable to expect that the model mimics the strobilation, transport, and subpopulation connectivity of this jellyfish with reasonable accuracy and that the results are very realistic. Jellyfish research through the use of coupled bio-physical models is scarce (Janßen et al 2013, Berline et al 2013, Prieto et al 2015), and to make our model as realistic as possible, we included diel vertical migrations, temporal variability of strobilation, lethal temperatures, and estimated probability of settlement of planulae using the distance between the group of jellyfish and the substrate.
Our aim was to evaluate the impact of offshore platforms on the dynamics of the moon jellyfish population. We were interested in which coastal regions are most affected by jellyfish originating from the new substrates, and to what extent they influence the connectivity between shore-based polyp subpopulations. The Results and discussion (section 3) and Conclusions (section 4) are based on model results, while the model setup described in Methods (section 2) is based on observations and available literature.
2. Methods
We have used the knowledge about polyp strobilation and behavior of individual ephyrae and medusae that we have obtained in our laboratory and field experiments (Malej et al 2007, Malej et al 2012, Hočevar et al 2017) and combined it with information from available literature to form an individual-based model (IBM). It represents the strobila, ephyra and medusa stage in the life-cycle of moon jellyfish as accurately as possible. In order to get a proper spatial representation, we have combined our IBM with ocean circulation and temperature distribution. For this purpose we have set up a high resolution ocean model, driven by realistic ocean and atmospheric boundary conditions.
2.1. Individual-based model
We used the Lagrangian particle tracking tool ichthyop (Lett et al 2008) and some of its extra features (spawning areas, multiple release events, growth, temperature sensitivity, vertical migrations) as our individual-based model (IBM). We additionally modified the code to realistically mimic vertical migrations of moon jellyfish (see section 2.1.3). The time-step of the ichthyop was set to 450 s, and propagation calculated using a Runge-Kutta 4th order scheme. Additional stochastic velocity perturbation was added as in Peliz et al (2007) to account for subgridscale processes. The position of all particles was written to an output file at each time-step in order to be used for later post-processing.
2.1.1. Strobilation
In 2009 numerous polyps were found in the port of Koper (Malej et al 2012). The piers in the port are supported by 575 pillars which host many oyster shells, and the polyps attach to the undersides of these shells. Our rough estimate is that there is about 5·109 moon jellyfish polyps in the port, which should account for about 50·109 ephyrae annually (Malej et al 2012). We have closely monitored this population for three years—from March 2010 to February 2013 (Hočevar et al 2017), and our strobilation pattern was based on these observations. As seen from the plot of monthly strobilation intensity (figure 3), the ephyrae release starts with a sharp peak in November followed by a rapid decrease in December and low values in January, February, and March. Strobilation in other months was negligible. To simulate this process we modulated the frequency of release events each month; at each event, 40 particles were released from all polyp locations. With 50 release events per year this means 2000 particles per year per each release zone. Since twelve release zones were considered in this simulation and as it ran for five seasons, there were altogether 120 000 particles used in the simulation. The number of particles is several orders lower from expected number of medusae and was limited by available computing power.
The particles were released from pre-defined release zones. Seven of these are major shipping ports (Ploče, Split, Rijeka, Koper, Trieste, Venezia, Ancona), and each release zone covers an area with a 3 nautical mile (NM) radius around the port location. The remaining five zones represent locations of offshore platforms. These have been clustered together into five groups, where the area covered by each group acts as a separate release zone (see figure 2).
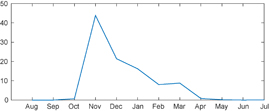
Figure 3 Strobilation intensity as derived from observations in the port of Koper (Malej et al 2012, Hočevar et al 2017). The vertical axis shows the fraction (percentage) of ephyrae released in each month relative to the number of ephyrae released in one year.
Download figure:
Standard image High-resolution image2.1.2. Growth and connectivity
Ephyrae need 60 days to reach adulthood in our model, since we observed mature specimen only from January onwards (Kogovšek et al 2015). After this period the particles in the simulation are capable of recruitment—release and settlement of planulae—connecting the location of their origin with the target location. At the same age they begin with diel vertical migrations. The connectivity estimate in our model is a function of distance between the particle and possible substrate location. Seven ports (same that also act as release zones—see section 2.1.1) and 137 offshore constructions have been considered as possible recruitment locations in this simulation.
We reason that ephyrae and medusae slowly disperse around the center of gravity of the group represented by a particle in our simulation, and the recruitment probability should diminish with distance between the particle and recruitment location. According to results obtained with dye experiments, the density of released passive tracers roughly follows a Gaussian curve as a function of distance from the source, and its variance expressed as a function of time follows the equation (Okubo 1971)
where σ marks the standard deviation in cm and t the time after release, or age of the particle in our case, in seconds. Since the ephyrae and medusae from each source location are represented by more than one particle in the simulation, each particle represents a smaller group of jellyfish and the variance of position around the center of the group, represented by the location of the particle, should be accordingly smaller. To conserve the cumulative area inside the radius that equals σ, the new variance is divided by the number of particles:
where Np represents the number of particles originating from a given source in each simulation. This gives a standard deviation of 1.7 km at 60 days of age (when they reach maturity) and 3.8 km at 120 days of age. We state that the probability of planulae settlement P at zero distance from a particle that represents a group of jellyfish, should equal P(r = 0) = 1, and consequently the recruitment probability curve for each particle takes the form:

We estimated the probability of settlement using the minimum distance r at which the particle (group of jellyfish) passes the substrate location (platform or port). The minimum distance for each particle and all recruitment locations was calculated in post-processing of ichthyop output files.
Recruitment, defined as just stated, represents a proxy for the likelihood that at least some of the planulae from the group of jellyfish represented by the passing particle, would be able to settle on the target substrate. We present the estimated recruitment rates (R- figure 6), averaged over all five seasons, in percentage, where 100% recruitment would mean that all the particles from the given source hit the target (recruitment location) directly. The presented recruitment by zones that represent platform areas (P1–P4) is an average over all platforms included in that release/recruitment zone and should serve as an indicator of connectivity between substrate locations.
2.1.3. Vertical migration
Current speeds and directions can vary greatly with depth, so in order to properly model the dispersal of moon jellyfish, it is essential to mimic the vertical migrations as accurately as possible. The diel vertical migration pattern in our model has been based on observations of moon jellyfish in Mljet lake (Adriatic sea) (Malej et al 2007) and those observed in Elefsis Bay (Saronikos Gulf, Greece) (Papathanassiou et al 1987). We modified the ichthyop code to allow for four different pre-defined depths daily (table 1). A random depth variance was added to each particle to create a Gaussian vertical distribution around the predefined average depth. The standard deviation was set to 1 m, and the deepest point was limited to 1 m above the sea floor, as was observed in nature. Vertical migrations were performed an hour before and an hour after sunrise and sunset. The time of actual rising and setting of the sun was obtained for each day of the year from the US Naval observatory website (USNO 2016).
Table 1. Average depth at different time of day as defined in the model.
| Time of day | Depth [m] |
|---|---|
| Night | 30 |
| Sunrise | 5 |
| Day | 15 |
| Sunset | 5 |
2.2. Particle density analysis
To analyze which parts of the Adriatic are most affected by different subpopulations of moon jellyfish polyps, we split our domain into coastal regions. They are 12 nautical miles wide, and on the western shore they roughly follow Italian administrative regions. On the eastern shore we decided to use more geographical partitioning. The Ionian sea is marked by the letter 'i' and the regions are listed clockwise in the following order (figure 4): Apulia E (1), Apulia W (2), Molise-Abruzzo (3), Marche (4), Emilia-Romagna (5), Veneto (6), Gulf of Trieste (7), Istra (8), Kvarner (9), Mid Croatia (10), South Croatia (11), Montenegro (12), and Albania (13). We counted the number of particles, representing groups of adult jellyfish from the sources considered, that turn up in each of the coastal regions and then divided the number by the surface area of the region to obtain the particle density (figure 5).

Figure 4 Coastal regions (12 NM wide) rendered with white borders. Letter i marks the Ionian Sea, other regions follow clockwise (see section 2.2 in the text).
Download figure:
Standard image High-resolution image2.3. Circulation model
For the purpose of modeling ocean currents, temperature, and salinity, we set up a high resolution circulation model, using ROMS_AGRIF code (Penven et al 2006, Debreu et al 2012), and used ROMSTOOLS (Penven et al 2008) for pre- and post-processing.
ROMS_AGRIF is a 3D sigma coordinate free surface circulation model, which we applied to a 1.9 km rotated rectangular grid with 228 × 554 cells and 33 sigma levels. The ocean boundary conditions at SE and SW open boundaries (figure 2) were provided from MFS (Mediterranean Forecasting System—(Pinardi et al 2003)) results obtained through the CMEMS service (EU Copernicus Marine Service 2016). Historic operational weather forecasts from The European Centre for Medium-Range Weather Forecasts (ECMWF—00 h and 12 h runs) with 3-hour intervals and interpolated to 0.125 deg. grid were used for atmospheric forcing. We modified the ECMWF land-sea mask to ensure only atmospheric values over wet points were used in simulation runs. Thirty-seven fresh-water sources were included in the model, which were distributed over 45 locations. We used monthly averaged runoff for the Po River (Arpae 2016), Soča River (ARSO 2016), and the Rižana River (ARSO 2016). For other rivers we used climatological monthly runoff (Raicich 1994, Janeković et al 2014).
Monthly averaged runoffs and ocean boundary conditions were modified according to Killworth (1996) in order to preserve averages after interpolation in time. Atmospheric forcing was derived using a bulk formula (COAMPS version). Boundary values for temperature and salinity were obtained by time-averaging results from MFS over each month. Boundary currents were calculated using geostrophic approximation and Ekman transport based on monthly averaged winds.
The program code was configured to use sponge areas for currents, salinity, and temperature at open boundaries with a combination of an Orlanski type boundary condition and the characteristic method for boundary barotropic velocities. Every three hours, averaged currents, temperature, and free surface were written to the output file, which was later used for particle tracking simulations.
The model ran from January 2010 to January 2016 after a four-year spinup with climatological forcing. This period overlaps with the three years when we monitored the polyp population in the port of Koper (see section 2.1.1), we consider it long enough to allow for more generalized conclusions, but still managable given the available computing power. The initial state for the spinup run was provided using MEDATLAS/2002 climatology (MEDAR Group 2002).
3. Results and discussion
The simulation ran for six model years to cover five full cycles from strobilation to the end of the adult medusa stage. The model results presented in this section were averaged over all five cycles and represent something akin to climatology.
3.1. Contribution to coastal areas
The coastal regions most affected by different offshore sources of jellyfish (according to the model results) are shown in figure 5 and the numeric values are listed in the table S1. Note that particles from different sources represent different number of individuals since the number of polyps at each location is unknown. Therefore, looking at figure 5, we can estimate which areas are targeted from a certain source, but we cannot know which of the sources is the major contributor.

Figure 5 Contribution of platform-based polyp populations to local regions. We plotted the yearly particle density [yr−1 km−2]: number of particles that cross each coastal region per year, divided by the surface area of the region. The numeric values are listed in supplementary data S1 available at stacks.iop.org/ERL/12/084003/mmedia.
Download figure:
Standard image High-resolution imageOur results range from 0.001 to 0.25 particles per km2 (figure 5). Considering the general cyclonic circulation in the Adriatic Sea (Cushman-Roisin et al 2001), it is expected that each of the sources contributes adult medusae to downstream regions and the results roughly confirm this. It can be seen that the platforms contribute mostly to the coastal regions on the western side of the Adriatic, but note that some regions on the eastern side still receive a considerable fraction of released particles. Zone P1b contributes a significant portion of its particles to Istra (8) and zones P2, P3, and P4 noticeably target the mid-Croatian (10) and Montenegran regions (12). Regions are shown in figure 4 and listed in section 2.2; the regions mentioned here are those regions on the eastern side of the basin, that reach yearly particle density above 0.05 yr−1 km−2 (figure 5 and table S1). These contributions to eastern shores are probably due to south (frequent) and middle (occasional) Adriatic gyres (Cushman-Roisin et al 2001) and short term currents which are a consequence of occasional specific atmospheric situations. This shows that it is not enough to use general circulation patterns in such evaluations, but that also short-term, realistic situations have to be accounted for. It also shows that platforms can have an important impact on the areas that seem distant and out of range considering the predominant circulation in the area.
Much to our surprise, a substantial number of particles in our simulation ends up in the Ionian Sea. We expected the polyp offspring to stay closer to their location of origin, but it turned out that they get caught by the Western Adriatic Current (WAC) (Cushman-Roisin et al 2001) rather quickly. The current velocities in the WAC are in the order of tenths of centimeters per second (Orlić et al 1992) and many of the platforms are positioned close to its core. Table 2 shows the percentage of particles from each of the sources that accumulate in the Ionian. As we can see, roughly half of the particles originating from the platforms, Ancona and Venezia migrate to the Ioninan Sea (i). Strong connection with the Mediterranean Sea as indicated by these results, is further supported by the fact that the same species of moon jellyfish can also be found in Tunisian waters (Ramšak et al 2012, Scorrano et al 2016).
Table 2. Fraction of released particles that reach the Ionian Sea.
| Release zone | Reach Ionian Sea |
|---|---|
| Ancona | 55% |
| Venezia | 48% |
| Trieste | 27% |
| Koper | 22% |
| Rijeka | 18% |
| Split | 27% |
| Ploče | 19% |
| P1a | 43% |
| P1b | 40% |
| P2 | 54% |
| P3 | 48% |
| P4 | 51% |
3.2. Impact of platforms on connectivity
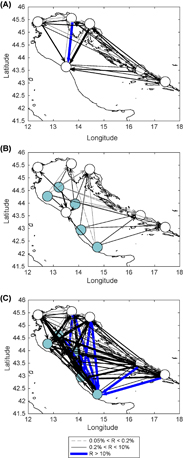
The connectivity between the polyp subpopulations modeled in our study is shown in figure 6. The black solid arrows represent average recruitment (as defined in the section 2.1.2) from 0.2%–10%, their width indicates the magnitude of recruitment. The blue wide arrows indicate average recruitment rate above 10% and the gray dashed arrows are used for an average recruitment rate between 0.2% and 0.05% which means four or fewer particles per year. We consider these kind of connections as very weak or occasional. The whole connectivity matrix, including standard deviations, can be found in the supplementary data (S2).
Figure 6 (a) Connectivity (estimate of recruitment—R) between shore-based polyp subpopulations. (b) Connectivity of platform originating jellyfish with shore-based locations. (c) Connectivity between all locations considered (including platforms). Trieste and Koper have been merged together in order to make the image easier to read.
Download figure:
Standard image High-resolution image
Although the shore-based polyp subpopulations seem to be relatively well connected through the whole Adriatic (figure 6(a)) due to rather rapid dispersal of particles in the simulation, it is obvious that there is a substantial enhancement in connectivity when the offshore platforms are taken into the account (figures 6(b) and (c)). It is reasonable to expect that the contribution of platform-originating planulae could help sustain populations in areas of the Adriatic that are weakly connected with shore-based sources. Ploče has a permanent connection only with Ancona, and Split has a permanent connection with Ploče and Ancona. But we barely consider the latter as permanent (0.2% ± 0.1%), so we hypothesize that these two subpopulations and other hypothetical polyp locations in the south-east Adriatic have had an important increase in connectivity and planulae inflow due to offshore platforms.
As shown in figure 6(c), the recruitment by platforms is exceptionally high, much higher than on coastal locations, which indicates that new or recently scraped platforms should get populated by moon jellyfish polyps very quickly.
Auto-recruitment rates, or the percentage of particles that connect with their location of origin, is shown in table 3 for all of the ports included in the simulation. The values are low (under 1%) for Split, Venezia, and Ancona and extremely low for Rijeka. For the latter, with the auto-recruitment rate of 0.05% ± 0.06%, zero auto-recruitment is a viable possibility, which means that the population might not be able to sustain itself without other sources of planulae. The same goes for the port of Split (auto-recruitment 0.3% ± 0.3%). Although the rate of auto-recruitment that would enable a subpopulation to sustain itself is not known, it is very likely that a subpopulation needs at least some inflow of planulae to maintain its existence. Therefore the connectivity with other locations is of high importance for Rijeka, Split, and other hypothetically unknown locations with zero (or close to zero) auto-recruitment. As offshore platforms drastically increase connectivity in the area, they could be of vital importance for sustaining such subpopulations.
Table 3. Auto-recruitment (in %) for all the ports.
| Location | auto-recruitment [%] |
|---|---|
| Ancona | 0.3 ± 0.2 |
| Venezia | 0.22 ± 0.06 |
| Trieste | 1.1 ± 0.5 |
| Koper | 1.7 ± 0.6 |
| Rijeka | 0.05 ± 0.06 |
| Split | 0.3 ± 0.3 |
| Ploče | 2 ± 1 |
We anticipated a low auto-recruitment rate in Ancona, due to the strength of the WAC, but the possibility of zero auto-recruitment in Split and Rijeka was harder to foresee (table 3). Somewhat unexpected is also the high recruitment rate at platform locations demonstrated by the model, but it seems plausible considering the fact that many of them are positioned in the area of the WAC.
Given that the amount of available natural substrate in the predominantly sandy western Adriatic shore is scarce and that the polyp population, even on the only confirmed location on this side of the basin (Ancona), is small (Cristina Gioia DiCamillo—personal communication), the polyps on the offshore platforms probably represent the largest population of moon jellyfish polyps in this area. Even though there was an intensive effort to find polyps on the eastern coastline, they were found only in the ports of Split and Ploče (Ante Žuljević—personal communication). The ports of Rijeka (east shore) and Venice (west shore) were added to our model purely by speculation, since they are located between confirmed settlements, while Šibenik, for example, is confirmingly devoid of polyps (Ante Žuljević—personal communication). Considering the stated above, our study took into the account most of the possible major locations.
3.3. Comparison of model results with the observations
Due to the lack of systematic observations of medusae in the area and a lack of consistent methodology, it is impossible to properly verify the results of our model. Nevertheless, we can do a qualitative comparison with results of the Italian jellyfish citizen science campaign. There is only a small number of scientists working with jellyfish and the volume of the oceans is almost incomprehensible, that is why citizen science campaigns are a valuable source of data although they carry a certain amount of unreliability. Still there is a relatively good match of our model results with the data from Boero et al (2016) for the Gulf of Trieste and Veneto regions. More details are available in the supplementary data (S3).
4. Conclusions
The large number of offshore marine constructions introduced into the world's oceans is likely to have an impact on the jellyfish population. Our model results show a sharp increase in connectivity in the Adriatic sea due to offshore platforms (figure 6). This should be important in sustaining the subpopulations in areas that are weakly connected to other locations (e.g. Ploče), in areas with low auto-recruitment (e.g. Rijeka), and especially in those which fit both criteria (e.g. Split). Our model studies the impact of offshore artificial substrate, but this is just one of the anthropogenic changes that favor the jellyfish. Overfishing, pollution, eutrophication and climate change (Gershwin 2013) are all likely to influence jellyfish population dynamics and were not included in our model.
Due to a large amount of additional substrate, the offshore platforms represent an extension into a weakly populated western part of the area and may importantly contribute to jellyfish blooms in downstream coastal regions (mid and southern Italy) and probably to some areas in the other part of the modeling area as well (Istria (8), mid-Croatian coast (10), Montenegro (12)—figures 4 and 5). Given the fact that the observed density of polyps is about 30 individuals per square centimeter (Malej et al 2012), each particle in our simulation should represent a huge amount of jellyfish, so the contributions in order of a few tenths of a particle per square kilometer (figure 5) could be a cause of massive blooms in the affected coastal regions. We should emphasize that some regions received a substantial amount of particles even though, looking at general circulation, the expected impact at these locations should be low. This confirms that models with high spatial resolution and realistic atmospheric forcing should be used in such studies.
The Adriatic is a relatively closed basin (see figure 2), so one would think that the retention rate for particles originating from its northern half would be high, but the intensity of the WAC defies this. The model results show that the platforms should be important contributors also to areas outside of the modeling domain which we, in the beginning of our research, considered to be large enough. Roughly half of the particles released from platforms reach the Ionian Sea (table 2), meaning that Adriatic platforms should also contribute to blooms and planulae settlement in other areas of the Mediterranean Sea. The fate of this particles was not investigated further, but they indicate that the platforms could be an important key in connectivity with the rest of the Mediterranean.
Our conclusions stem from model results and there is very little observational data to evaluate the accuracy of the model. This shows the need for coordinated international effort to systematically monitor jellyfish presence. But even if there is a certain degree of unreliability in model results, great care has been taken to reproduce the processes as realistically as possible and the main conclusions should be solid.
A large amount of available substrate for polyp attachment and high recruitment rates make offshore constructions a very likely propagator of jellyfish presence in most areas of the world and therefore these effects should be evaluated when planning new projects.
Acknowledgments
The work has been supported by the FP7 PERSEUS project, FCT SHARE programme (RECI/GEO-MET/0380/2012), Slovenian Research Agency (ARRS, P1-0237 and 'mladi raziskovalci'), and Slovene Human Resources Development and Scholarship Fund. The authors would like to thank Slovenian Environment Agency (ARSO) for the use of their computer cluster, and especially Jure Jerman for his help in obtaining and applying ECMWF products. We thank Tihomir Makovec and Tjaša Kogovšek for photos used in figure 1 and Sara Hočevar for her data about strobilation in the Port of Koper. We would also like to show our gratitude to Sašo Petan (ARSO), Boris Petelin (NIB), and Silvano Pecora (Arpae) for help regarding hydrological data and Vlado Malačič (NIB), Matjaž Ličer (NIB, ARSO), Tinkara Tinta (NIB), Jure Cedilnik (ARSO), Cristina Gioia Di Camillo (UNIVPM), Ante Žuljevic (IZOR), Donat Petricioli (DIIV), Andrej Jaklin (IRB), Sandra Plecha (ULisboa), and Ana Teles-Machado (ULisboa) for useful ideas and discussions.