

Abstract
More than half of the world's current population resides in urban areas, and cities account for roughly three-quarters of the total greenhouse gas emissions. Current and future trends in urbanization will have significant impacts on global climate. However, our collective understanding of the climate of urban areas remains deficient, which is mainly related to significant knowledge gaps in observations. The New York City Summer Heat Campaign was initiated to address some of these critical knowledge gaps. As part of the campaign the urban boundary layer over New York City was continuously monitored during July 2016, a period that witnessed three heatwave events. Surface weather stations and indoor sensors were also used to characterize the urban heat island intensity. Our results reveal that during the month, the urban heat island intensity was nearly twice compared to the decadal average. During the heatwave episodes, urban heat island intensities as high as 10 °C were observed. The thermal profiles indicate elevated temperatures in much of the boundary layer between 800–2500 m during the heatwave episodes. The profiles indicate a complex thermal structure and high intra-city variability. Thermal internal boundary layer was observed in neighborhoods populated by tall buildings. Overall the high-pressure system during the heatwave episodes acted as a thermal block and much of the heat generated in the urban surface layer remained within the boundary layer, thereby amplifying the near surface air temperature.
Export citation and abstract BibTeX RIS

Original content from this work may be used under the terms of the Creative Commons Attribution 3.0 licence.
Any further distribution of this work must maintain attribution to the author(s) and the title of the work, journal citation and DOI.
Introduction
July 2016 was the hottest month ever observed since the inception of climate records. The combined surface temperature (both land and ocean) was 0.87 °C warmer than the globally averaged 20th century average (NOAA 2016). In the US, the near surface air temperature was warmer compared to the 30 year climatological average (Copernicus 2016). A weakening El Niño is largely cited for this intensification (NOAA 2016). The North Eastern United States was no exception and the conditions were severely amplified by the frequent occurrence of heatwaves, a deleterious consequence of global warming (Peterson et al 2013). In line with the Intergovernmental Panel on Climate Change's fifth assessment report (IPCC 2014) which predicted the heatwaves in the future would occur more frequently, last longer and with heightened intensity, in July 2016, New York City (NYC) witnessed three heatwave episodes that lasted a total of 16 d. Heatwaves are synoptic-scale anti cyclonic patterns that result in trapping of warm air (Xoplaki et al 2003, Nairn and Fawcett 2013, Black et al 2004). They are characterized by high pressure conditions and low wind speeds. Urban areas, particularly dense cities, are more susceptible to the impacts of heatwaves (McCarthy et al 2010, Papanastasiou et al 2009). The heatwaves result in higher mortality rates and adversely impacts urban infrastructure; power plants, energy distribution and transportation systems are highly vulnerable (Rosenzweig and Solecki 2015, Solecki et al 2015). Urban areas, particularly during the nighttime commonly experience elevated air temperatures relative to the surrounding rural areas in what is commonly referred to as the urban heat island effect (UHI) (Bornstein and Lin 2000, Oke 1995). The increase in temperature is mainly due to the replacement of natural landcover with built materials like concrete and asphalt that lack moisture retention capacity but have high thermal storage capacity (Ramamurthy et al 2014). The materials overwhelmingly redistribute the incoming solar energy in to sensible heat, thereby increasing the Bowen Ratio and amplifying the near surface air temperature. Recent modeling work has shown that the UHI effect synergistically interacts with heatwaves and disproportionately increases urban temperatures (Li and Bou-Zeid 2013). Ramamurthy et al (2015) used high resolution numerical simulation to study the impact of heatwaves in NYC and observed that apart from increased thermal storage, the blocking of sea breezes reduced the impact of advective cooling, resulting in elevated temperatures during the heatwave episode. The sea breeze blocking effect was also observed by Meir et al (2013) and Gutierrez et al (2015). Li and Bou-Zeid (2013) and Miralles et al (2014) observed lack of soil moisture played a significant role during the extreme heat periods. Their numerical analysis over the Washington–Baltimore metropolitan area concluded that the intensity of heatwaves was highly sensitive to surface soil moisture.
Most urban studies, as highlighted above are numerical experiments; very few detailed observations of the urban boundary layer (UBL) exists (Barlow 2014) and even fewer during extreme heat events. The studies have largely focused on surface driven impacts and there are significant knowledge gaps on the coupled boundary layer processes. In particular, the thermal structure of the UBL has rarely been analyzed. In fact for most urban studies basic details such as the height of the mixing layer have not been recorded (Barlow et al 2011). As a result, the current models perform poorly in describing the characteristics of the UBL and operational models struggle in simulating the urban climate accurately (Hidalgo et al 2008). Herein we comprehensively analyze both the surface conditions and the boundary layer dynamics during heatwave episodes over NYC. The study utilized boundary layer profilers to continuously scan the lower atmosphere for entire July 2016. In addition, data from ground-based weather stations were used to characterize the surface conditions. The primary scope of the article is to holistically assess the state of a dense urban environment during a heatwave period with particular focus on the boundary layer dynamics.
Methods
The investigation utilized a variety of ground-based sensors that included data from multiple surface weather stations andboundary layer profilers.Two multi-channel radiometers were used (Radiometric MP-3000A) to observe the thermal state of the UBL. It consists of 35 frequency bands, each associated with a particular height with each channel measuring the brightness temperature of the atmosphere. The instruments were located on the campuses of City College of New York (CCNY) in Upper Manhattan (40.8216°N, 73.9479°W) and at New York University (NYU) in Downtown NYC (40.7295° N, 73.9965° W). The instruments were operated continuously during July 2016. Ground-based weather stations were additionally used to characterize the surface conditions. The analysis included data from the National Weather Service's automated surface observation stations (ASOS) and automated position reporting system (APRSWXNET). The weather stations were distributed all over NYC as shown in figure 1. The groundstations were predominantly used to characterize the near surface air temperature with one station located in the Borough of Queens also monitoring soil moisture. Figure 1 shows the locations of the all the instruments; for the rural reference, four stations around the NYC area were used; KFRG (40.73443,−73.41639, elevation-22 m), KISP (40.79389,−73.10167, elevation-30 m), KMMU (40.8,−74.41667, elevation-57 m) and KMGJ (41.50917,−74.265, elevation: 110 m). In addition, temperature profiles observed by aircrafts while landing and take-off, through the aircraft meteorological data and reporting (AMDAR) program, at the JFK and LGA airports (refer figure 1 for location) were also included for the analysis.
Results
Amplification of UHI
NYC experienced hot conditions throughout July 2016; the maximum air temperature exceeded 32.22 °C (90 °F) on nearly 16 d of the month and three heatwave warnings were issued by the regional meteorological office. In NYC, any three consecutive days with daily maximum temperatures above 32.22 °C is considered to be a heatwave event (Robinson 2001). Figure 2(a) compares the near-surface air temperature observed in NYC to the rural average. To compute the mean urban temperature, all the surface weather stations shown in figure 1 were used.
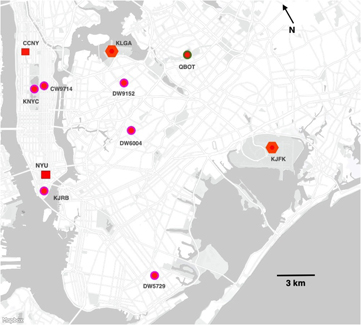
Figure 1 Map detailing the location of all the instruments. NYU and CCNY (red squares) housed the microwave radiometers and QBOT is the soil moisture station. The rest were all operated by the NWS and their respective names indicate their call numbers. KJFK and KLGA are the two airport stations. The Manhattan sites can be classified as LCZ 1 and the airports belong to LCZ 8, all other sites can be classified as LCZ 2 according to Stewart and Oke 2012.
Download figure:
Standard image High-resolution image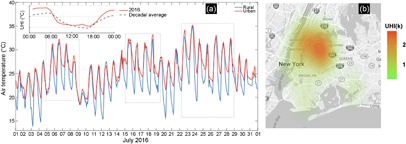
Figure 2 Plot (a) shows time series of near surface air temperature for July 2016. The red and blue lines indicate average urban and rural temperatures. The panel plot compares the mean diurnal UHI to decadal average. Plot (b) shows the intra-city variability in UHI; neighborhoods close to coast experience relatively lower UHI.
Download figure:
Standard image High-resolution imageThe time series shows significant differences in the observed temperature during the nocturnal hours despite both the urban and rural temperaturesreaching parity during the midday convective period. The urban and rural temperatures only differ by 1 °C−1.5 °C during the mid-afternoon peak hours. However, the temperature in the rural site drops rapidly past sunset; the urban stations exhibit a relatively weaker decline. The rural site experiences temperatures as low as 12 °C while the lowest urban temperature recorded is around 17 °C. Both urban and rural stations experience a high of 35 °C on July 23. The comparison illustrates that the highest UHI (difference between urban and rural temperature) occurs during the nighttime and early morning (prior to sunrise) hours. UHI as high as 8 °C is observed during the heatwave episode (July 24). The higher UHI during the nighttime is commonly attributed to increased thermal storage (Gedzelman et al 2003). The built surfaces that dominate the urban environment have high thermal inertia and hence have high heat storage capacity. The stored heat is released back as sensible heat past sunsetthereby amplifying the urban–rural thermal gradient. The next two sections discuss two other factors: boundary layer dynamics and accelerated depletion of surface soil moisture, both of which complement the impact of high heat storage capacity in disproportionately amplifying the nighttime UHI.
The panel plot inside figure 2 compares the UHI observed in July 2016 to the decadal mean UHI (2005−2014). The comparison shows that the nighttime UHI in 2016 is around 1.5 °C−2 °C warmer; the frequent occurrence of heatwaves is primarily responsible for this magnification. On average the maximum UHI during the heatwave days is 2 °C–3 °C higher compared to the regular days.
The intra-city variability in UHI values is shown in figure 2(b). The density map shows that the neighborhoods close to the coast experience smaller UHI values than inner city areas. The UHI values range between 0.8 K for sites located near the coast to 2.7 K for the inland neighborhoods. The inland neighborhoods located in the northern part of NYC that are dominated by low rise buildings and have sparse vegetative cover experience relatively high temperatures. The spatial pattern of UHI also illustrates the potential role played by sea breeze in moderating the city's temperature as the neighborhoods close to the coast experience weaker UHI. Ramamurthy et al (2015) observed that during the summer periods, the south easterly coastal winds during the afternoon hours reduced the overall UHI of the city. This influence was however inhibited during heatwave episodes when the city was largely influenced by westerly winds over land. Overall the analysis has highlighted the amplification in UHI intensity during July 2016 due to the frequent occurrence of heatwaves and has linked the spatial pattern to local dynamics and landcover characteristics.
Thermal structure of the UBL
Temperature and humidity profileswere continuously monitored throughout the month of July using a microwave radiometer at two sites; one located in the Upper Manhattan area (marked as CCNY in figure 1) and another in Downtown NYC (marked as NYU). Figure 3 also shows potential temperature profiles recorded by aircraft landing and taking off at JFK and LGA airports. Potential temperature is used here as it accounts for difference in altitude and is commonly used as a diagnostic variable to compare boundary layer profiles. All four locations are situated within the city limits; CCNY and LGA are 10 km apart and JFK is located close to the coast, 16 km east of LGA. NYU is around 10 km south of CCNY.
All four sites are surrounded by distinct urban landcover and experience dissimilar microclimates. CCNY and NYU are situated in Manhattan and while both the sites are surrounded by tall buildings, the ones around NYU are mostly commercial, whereas CCNY is surrounded by medium to high rise residential buildings. LGA, located in the Borough of Queens is surrounded by low-rise residential buildings and JFK located in the Borough of Brooklyn is close to the coast. The influence of local forcings is evident in the surface layer profiles (sub-500 m levels in figure 3). NYU, CCNY and LGA located inland have a super-adiabatic layer that extends between 0–200 m during the daytime, (figure 3(b)) irrespective of heatwave conditions. In the case of NYU, which is located in a high density commercial zone the lapse rate in the lower 200 m ranges from 0.035 Km−1 in the convective period during heatwaves to 0.0125 Km−1 in the nighttime during regular days. In stark contrast the JFK site remains stable during nighttime (figure 3(c)) and neutral during the convective period (figure 3(b)). Even during the convective period during heatwave events, JFK is influenced by strong sea breeze which is clear from the near surface neutral layer in figure (3(b)).
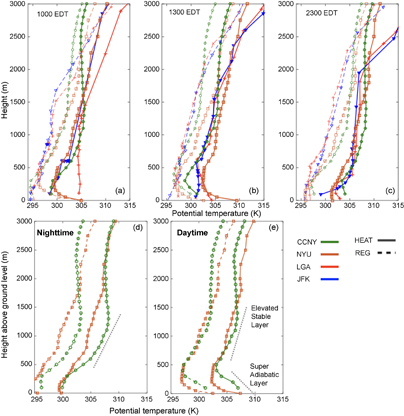
Figure 3 Profiles of potential temperature recorded by different boundary layer profilers. CCNY and NYU were monitored by a microwave radiometer while LGA and JFK are aircraft measurements through the NOAA AMDAR program. Figures 3(d) and (e) are potential temperature averages over multiple days for daytime and nighttime respectively. Here nighttime refers to 0100–0500 EDT and daytime represents 1300–1700 EDT. The dotted and solid lines indicate regular and heatwave days.
Download figure:
Standard image High-resolution imageThe discrepancy observed in the surface layer profiles does not extend in to the mixed layer, particularly during the heatwave episodes (for both the timeperiods), the profiles at all the sites are comparable in value; the θ values range between 303–307 K. In the case of CCNY and NYU (figure 3(e)), both the profiles converge between 500−2000 m. The uniformity is a consequence of the synoptic forcing imposed by the high-pressure system.
Figures 3(d) and (e) compare the averaged θ profiles during the convective and nighttime hours for heatwave and non-heatwave days at CCNY and NYU. Potential temperature profiles between 0100−0400 and 1300−1700 local time were averaged to obtain the plot. There exists an overwhelming difference in θ values between the two profiles; in the surface-layer, sub 500 m, the profile during heatwave is 4−7 K warmer. Between 500−1500 m the difference is on average 5 K and this difference extends to above 1500 m at both the sites. This difference in θ between regular and heatwave days is mainly related to the highly energized UBL as a result of thermal blocking and warm air subsidence. One of the striking features in the profiles is the weak stable layer between 500–1000 m. The stable layer is visible on most days irrespective of heatwave episodes and is due to thermal internal boundary layers (IBL). The difference in surface roughness and surface forcings and its uneven distribution leads to the creation of multiple thermal IBLs. The θ in the lower 500 m is mainly affected by the local characteristics, however above 500 m it is influenced by the larger UBL. The θ in this layer is well above the IBL θ at 500 m which establishes an elevated stable layer. As opposed to a conventional convective boundary layer, the boundary layer over the highly urbanized area populated by tall buildings has three distinct regimes; a super-adiabatic layer for the first 500 m with a lapse rate (Γ) of 0.025 K m−1, a weakstable layer between 500–1200 m with a Γ of 0.0046 K m−1 and finally a traditional mixed layer over 1200 m with a Γ of 0.0098 K m−1.
Figure 4 describes the energized UBL during the heatwave episodes; it shows contours of potential temperature θ for the CCNY site between July 3rd to 21st. The temporal variability shows the difference in UBL between heatwave and regular days. The entire UBL is highly mixed during the heatwave episodeswith no discernible difference between daytime and nighttime periods (above 500 m). The near-surface temperatures are also high during the heatwave episodes, marked by a surface heat dome.The contours indicate that much of the heat generated in the convective daytime hours stays within the UBL during the nocturnal period. The high-pressure system creates a thermal block and inhibits the heat transfer between the UBL and the upper atmosphere. This gives rise to a highly energized UBL even during the nocturnal period. The heat released in the successive heatwave days stays close to the surface there by amplifying the near surface air temperature. The blocking effect described above has previously been observed by Miralles et al (2014) over a non-urban surface and soil moisture deficit related to seasonal precipitation anomaly was found to be the major factor.

Figure 4 Contours of virtual potential temperature monitored by CCNY radiometer.
Download figure:
Standard image High-resolution imageUrban canopy conditions
Figure 5 shows time series of averaged indoor temperatures and surface soil moisture. Indoor temperatures were monitored in non-air conditioned houses as part of the Harlem Heat project (WNYC 2016). All the houses were in the Upper Manhattan area close to CCNY and the households that recorded the highest indoor temperatures are used here. The indoor temperatures are primarily used to characterize the thermal state of the urban canopy layer as direct observation of wall temperature were not made. Despite the high diurnal variability in the ambient conditions, the indoor temperatures show little diurnal variability, indicating they are moderated by storage heat flux. During observation period, differences as high as 7 °C can be seen between the ambient and indoor conditions, particularly during the nighttime hours. The difference in temperature between the various urban facets (walls, roads and rooftops) and the ambient air would be much higher. The indoor temperatures also decline at slower rate following heatwave episodes. The results indicate the highly-energized state of the urban canopy layer and significant surface driven thermal energy added in to the UBL throughout the day.

Figure 5 Top plot compares indoor temperature (colored circles) from different households to the ambient air temperature (grey line). Bottom plot shows time series of surface soil moisture.
Download figure:
Standard image High-resolution image
Figure 5 also shows the variability in soil moisture (indicated as volumetric water content (VWC)) at 10 cm below ground level for the observation period along with accumulated precipitation. The majority of the landcover in NYC is populated by built materials but nearly 35% is still covered by pervious surfaces (Rosenzweig et al 2009) that play a crucial role in moderating the local micro-climate through evapotranspiration and surface soil moisture is a critical factor that controls evapotranspiration. During July 2016, NYC received 106 mm of rainfall, which is close to the 30 year average for the month. A maximum VWC of 0.38 is observed on July 5th and 10th following precipitation events. Lengthy dry periods are observed between the rain events. These dry down periods also coincide with the heatwave episodes. The longest heatwave episode between 22nd–29th was also the driest with an average VWC value of 0.18. While the nature of urban soils is poorly researched and their characteristics are mostly unknown the value is close to the wilting point for undisturbed sandy loam, the common soil type for this geographic location. The time series also shows that VWC decreases rapidly following forcing events, particularly during heatwave episodes, which could be related to the highly energized UBL that enhances evaporation. The drier and deeper UBL enables rapid dessication of surface soil moisture.
The urban canopy conditions indicate that the surface layer remains a source of heat throughout the day and expose the constraints imposed on evapotranspiration in moderating the urban micro-climate.
Conclusion
One of the implications of global warming is the frequent occurrence of heatwaves, which will disproportionately impact urban areas. However very few observations of UBL exist and even fewer during heatwave episodes. To fill this knowledge gap, boundary layer profilers and weather stations were used to comprehensively observe the thermal state of NYC. Nearly 16 d of the month experienced maximum temperatures above 32.2 °C; a vital criterion in the North Eastern United States to issue heat advisory. As expected a sharp increase in UHI was observed during the heatwave episodes wherein the average nighttime UHI was nearly twice as high as the decadal average. Overall the analysis has highlighted the crucial linkages between the surface processes and the UBL dynamics. The average θ was heightened throughout the boundary layer; at any given height, the θ values were on average 5 K higher during the heatwaves as the excess heat emitted from the surface stays within the UBL due to the thermal block imposed by high pressure. The UBL profiles indicated a high degree of variability close to the surface and over dense urban areas a shallow stable layer above the super-adiabatic surface layer was visible, a result of the interaction between thermal internal boundary layer and the larger UBL. Throughout the heatwave episodes the soil moisture remained low, in fact for the 6 d heatwave episode the volumetric water content was below the wilting point. The low values and high desiccation rate could be attributed to the drier and deeper UBL.
The results have revealed multiple mechanisms that impact dense urban environments during heatwave episodes. Increased storage flux and lack of evapotranspiration is commonly cited for high UHI during heatwaves. Ramamurthy et al (2015) and Meir et al (2013) have previously shown the influence of sea breeze in moderating the UHI in NYC. During the summer months in the afternoon hours, the south to south easterly coastal winds have a cooling effect on the city. However, during the heatwave episodes winds are predominantly from the west over land thereby limiting their impact. Here we have shown that the coupled feedback loop between the highly energized UBL and the surface processes is central to exacerbation of UHI in dense urban areas. The feedback mechanism aids in keeping the excess heat released from the surface within the UBL and it is also responsible for high soil desiccation, which limits the moderating impact of evapotranspiration. The θ profiles from the microwave radiometer located in CCNY and NYU show the presence of thermal IBLs. The weak stable layer between 500–1000 m is related to the interaction between the local scale processes and the larger UBL. The stable layer will induce negative heat transfer; from the upper part of the UBL in to the surface layer. The addition will increase the near surface air temperature in dense urban areas.
Climate intervention methods in urban areas overwhelmingly focus on surface modification strategies such as greening and cool roofs. Researchers have shown on the positive influence of cool roofs on the urban microclimate. Li and Bou-Zeid 2013 found linear relationship between cool roof fraction and near surface temperature in their modeling study over the Baltimore–Washington metropolitan area. Positive correlation between greening strategies and near-surface temperature were also found at global scale to building scales. While theoretically these modifications will have a cooling influence on the local microclimate, one should be cautious as the UBL dynamics has shown that during the heatwave episodes heat is advected in to the urban surface layer non-locally. The thermal block that results from the high-pressure system and the formation of thermal IBL act as a heat trap and disproportionately amplify the UHI. Hence the scale of surface modifications should be adapted accordingly. Majority of the urban studies, including the ones referenced above used numerical models to study the surface-atmosphere interactions. While the complexity of these models is rapidly evolving, their ability to understand the urban boundary layer dynamics is still primitive; a dearth of continuous and consistent observations of the UBL has belittled the modeling effort. The existing planetary boundary layer schemes have never been adequately tested or validated over urban surfaces. Hence to address the critical and unique challenges imposed by the urban environment, the next generation planetary boundary layer schemes must reflect the complex UBL dynamics and additional datasets are needed to adequately represent heat and mass transport over dense urban areas.
Acknowledgments
The research presented here was partly funded by the NOAA CREST center at The City College of New York and Department of Defense Army Research Office, W911NF-15-1-0443. The Authors would like to thank Yoribaldis Olivo and Harold Gammaro for participating in the observational study and Prof. David M Holland for the NYU microwave radiometer data.