

Abstract
Despite a continuous increase in well-mixed greenhouse gases, the global-mean surface temperature has shown a quasi-stabilization since 1998. This muted warming has been linked to the combined effects of internal climate variability and external forcing. The latter includes the impact of recent increase in the volcanic activity and of solar irradiance changes. Here we used a high-resolution coupled ocean–atmosphere climate model to assess the impact of the recent volcanic eruptions on the Earth's temperature, compared with the low volcanic activity of the early 2000s. Two sets of simulations are performed, one with realistic aerosol optical depth values, and the other with a fixed value of aerosol optical depth corresponding to a period of weak volcanic activity (1998–2002). We conclude that the observed recent increase in the volcanic activity led to a reduced warming trend (from 2003 to 2012) of 0.08 °C in ten years. The induced cooling is stronger during the last five-year period (2008–2012), with an annual global mean cooling of 0.04 °C (+/− 0.04 °C). The cooling is similar in summer (0.05 °C +/− 0.04 °C cooling) than in winter (0.03 °C +/− 0.04 °C cooling), but stronger in the Northern Hemisphere than in the Southern Hemisphere. Although equatorial and Arctic precipitation decreases in summer, the change in precipitation does not indicate robust changes at a local scale. Global heat content variations are found not to be impacted by the recent increase in volcanic activity.
Export citation and abstract BibTeX RIS

Original content from this work may be used under the terms of the Creative Commons Attribution 3.0 licence.
Any further distribution of this work must maintain attribution to the author(s) and the title of the work, journal citation and DOI.
1. Introduction and motivation
Despite a continuous increase in the concentration of well-mixed greenhouse gases (GHGs), the observed global mean air-surface temperature (GMST) trend has remained more or less steady from 2001 to 2013 (England et al 2014). This rate of temperature change does however not result in a significant slowdown of global warming rate with regard to the 1950–2013 time series (Rajaratnam et al 2015) and the pause was partly attributed to observational errors (Karl et al 2015). The recent observed GMST trend over the period of interest here (2003–2012) is at the lower end of the range of simulations performed in phase 5 of the Coupled Model Intercomparison Project Phase 5 (CMIP5; Taylor et al 2012) (Watanabe et al 2013). The CMIP5 climate models simulate a continuous increase in the rate of the temperature change (Kosaka and Xie 2013, Watanabe et al 2013, Meehl et al 2014). This has raised the question of the role of decadal climate variability in reducing or exacerbating the impact of the global warming.
The surface temperature fluctuation can be mainly associated with the internal climate variability through a negative phase of the Pacific Decadal Oscillation (PDO) (Meehl et al 2011, 2014, Kosaka and Xie 2013, Watanabe et al 2013, 2014, Trenberth and Fasullo 2013, Guemas et al 2013, England et al 2014 and Douville et al 2015). During the last decade, the warming rate has been reduced, along with an increase in heat uptake, mainly in the Pacific and the Atlantic Ocean (Meehl et al 2011, Guemas et al 2013).
External forcing can also cause decadal-timescale changes in GMST. Some studies argue that the solar minimum around 2009 (Kopp and Lean 2011), the recent decrease in stratospheric water vapor concentration (Solomon et al 2010), the increase in emissions of anthropogenic sulfate aerosols (Kaufmann et al 2011, Schmidt et al 2014) and the increase in stratospheric volcanic aerosol emissions (Solomon et al 2011, Fyfe et al 2013, Santer et al 2014, 2015, Haywood et al 2014, Ridley et al 2014, Schmidt et al 2014, Brühl et al 2015, Mills et al 2016) partly explain the reduction of the warming trend.
Systematic errors in certain external forcings in CMIP5 simulations of historical climate change explain the difference between simulated and observed warming rates during the 'slowdown' period. CMIP5 climate models are generally forced by unrealistically low stratospheric aerosols optical depth after 2000 (Fyfe et al 2013, among others). The cooling effect of the solar activity was also neglected (Schmidt et al 2014). Biases in simulating El Niño Southern Oscillation phases also lead to GMST overestimation (Schmidt et al 2014). Observational errors (Karl et al 2015) and model-observation comparison biases (Cowtan et al 2015) can also be partly responsible for the apparent gap between models and observations. Richardson et al (2016) have therefore shown that the gap between model simulations and observations are greatly reduced when model outputs are processed the same way as the HadCRUT4 observations over the oceans, and in taking into account the lack of values over the Arctic in the observations. HadCRUT4 is a dataset of observed near-surface air temperature (Morice et al 2012).
Here we study the recent surface temperature fluctuation by analyzing the impact of the volcanic eruptions that have occurred between 2003 and 2012. In order to simulate the impact of the recent volcanic activity on climate we performed two sets of sensitivity experiments, with two different data sets of stratospheric aerosol optical depth (SAOD).
Our approach is similar to that followed by Solomon et al (2011), Fyfe et al (2013), Ridley et al (2014) and Haywood et al (2014), who analyzed the impact of the recent volcanic eruptions on the GMST. These authors have concluded that the recent volcanic eruptions may have cooled GMST by 0.02 °C (Haywood et al 2014) to 0.05 °C–0.12 °C (Ridley et al 2014). Solomon et al (2011) and Fyfe et al (2013) found an intermediate values of 0.05 °C–0.07 °C.
The main objective of Fyfe et al 2013 was to explore the consequences of systematic errors in model representation of early 21st century volcanic aerosol forcing (using a near-zero radiative forcing as a baseline). Here we prefer using an alternative approach with an SAOD baseline set at a fixed value, deduced from a weak volcanic activity period (1998–2002). We address the impact of the recent increase in the volcanic activity, in comparison to a period of a low-volcanic activity as a baseline. We mainly assess the impact of the moderate strengthening in the volcanic activity on a recent decade (2003–2012) rather than documenting the impact of using biased low forcing. To analyze the impact of natural volcanic activity variability in (the absence of strong volcanic events) we have to deal with weaker differences in SAOD, than in previous studies (Fyfe et al 2013, among others). The impact of such a low change in radiative forcing is thus still an open question. The question of the misrepresentation of the volcanic external forcing in global climate models is therefore indirectly addressed.
Our scientific question: What is the impact, on the GMST, of the recent of moderate volcanic activity (2003–2012) compared to a period of low volcanic activity, such as from 1998–2002?
2. Data, model and simulations
2.1. The CERFACS-HR climate model and simulations
We used the CERFACS-HR climate model, a high resolution coupled climate model developed at CERFACS (Centre Européen de Recherche et de Formation Avancée en Calcul Scientifique). The ocean component is the Nucleus for European Models of the Ocean (NEMO) v3.4 (Madec 2008) model on an ORCA025L75 grid (horizontal resolution of 0.25° and 75 vertical levels). The atmospheric model is ARPEGE-climate v5.3 developed at Meteo-France/CNRM (Centre National de Recherches Météorologiques) with a horizontal resolution of about 50 kilometers and 31 vertical levels (T359L31). More information on CERFACS-HR is given in Monerie et al (2017, hereafter noted MO17).
The coupled model is initialized with the GLORYS2V1 ocean reanalysis (Ferry et al 2012) and the atmosphere initial state is given by a sea-surface temperature (SST)-forced ARPEGE simulation. The simulations are full-field initialized in 2002 (in November). We performed six realizations, which differ by their atmospheric initial state, corresponding to different days in November. All simulations are forced by the estimated historical values in GHGs, solar irradiance, black carbon, particulate organic matter, dust, sea salt and sulfate aerosols. The optical depths of tropospheric aerosols are given by Szopa et al (2013).
The ability of CERFACS-HR to simulate climate is provided in MO17. Before the drift correction, simulations exhibit large positive biases of SST over the Austral Ocean and over the equatorial Pacific and Atlantic Ocean (up to 4 °C), the Arctic experiences a cold bias of 5 °C. These biases are commonly obtained with climate model simulations. After drift correction CERFACS-HR is able to simulate and to predict the global mean surface temperature for the upcoming five years and exhibits high skill in predicting SST over the North Atlantic, equatorial Atlantic and the Indian Oceans (MO17). CERFACS-HR has also high skill in predicting decadal trends in Arctic sea-ice extent and volume. Moreover CERFACS-HR has been used in a previous study to perform a suite of decadal hindcasts (10 year hindcasts starting each year from November 1993 to November 2012) that reproduce a reduced surface warming rate during the recent decades (MO17). In these hindcast simulations, the 2003–2012 trend in GMST is associated with a negative phase of the PDO, and is therefore mainly explained by internal climate variability. This result is likely to be linked to the model initial state, since the PDO and the Interdecadal Pacific Oscillation (IPO) shifted from a positive to a negative phase in the early 2000s (Trenberth and Fasullo 2013, England et al 2014). This issue is discussed later, in section 3.4. However, MO17 carried an important limitation, i.e. an unrealistic evolution of the volcanic eruptions due to the use of a background condition in SAOD instead of realistic SAOD data. Here we analyze the added value of a realistic representation of the volcanic activity.
To meet this objective, two sets of simulations are performed:
- The first set, hereafter referred as VER, includes six members using the SAOD data of Vernier et al (2011), therefore taking into account the recent evolution of the volcanic activity (figure 1(a), red line).
- The second set, hereafter referred as BAK, is realized by performing also an ensemble of six members using a background value of SAOD, based on the 1998–2002 lower values of Vernier et al (2011) (figure 1(a), blue line). This baseline allows quantifying the impact of the recent volcanic activity in comparison with a period of minimal volcanic activity. Here we do not document the consequences on the climate simulations of using a biased low volcanic forcing (with a near-zero value in SAOD), as done in many studies (Solomon et al 2011, Fyfe et al 2013, Ridley et al 2014). The background in SAOD is however never equal to zero (as highlighted in Solomon et al 2011) and our choice of the baseline value of SAOD is more adapted to our objective.
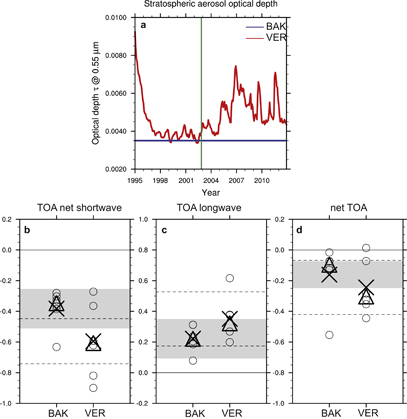
Figure 1 (a) Global-mean stratospheric aerosol optical depth used in the BAK (blue line) and VER (red line; dataset of Vernier et al 2011) simulations. The green vertical line represents the start date of the simulation (November 2002). Simulations end in December 2012. Global-mean 10 year trend (2003–2012) of (b) the top-of-the atmosphere net shortwave fluxes, (c) longwave fluxes and (d) net fluxes (shortwave + longwave) (W m−2 by decade). The circles represent each BAK and VER simulations (six members), the cross represents the ensemble-mean and the triangle the ensemble-median. The gray shading and the discontinuous lines are used to delimit the spread (+/− one standard deviation around the ensemble mean) with respectively the BAK and VER ensemble. By convention negative values are used for upward fluxes, positive values are used for downward fluxes. A negative trend is thus associated with a cooling of the troposphere while a positive trend is associated with a warming of the troposphere.
Download figure:
Standard image High-resolution imageThe impact of the recent volcanic eruptions is quantified by computing the VER-BAK differences.
Climate models do not perfectly simulate the observed climate. When initialized with observations models drift toward their preferred imperfect climatology (Meehl et al 2009). This drift leads to biases in hindcasts and has to be removed. We used an additional set of ten 10 year hindcasts, initialized every year from 1993 to 2002 (5 members × 10 start dates), described in MO17, to estimate a drift correction, following the World Climate Research Program recommendations (ICPO 2011). The drift was then removed from VER and BAK at each lead-time (time step after the model initialization) (see supplementary materials available at stacks.iop.org/ERL/12/054010/mmedia for further details on the bias adjustment method). Assuming that the drift is equal in the two sets of simulations, we did not remove the drift prior to computing the VER-BAK differences (in what follows, we only remove the drift when showing separately VER and BAK results). The VER-BAK differences are thus computed at the CERFACS-HR horizontal resolution. We checked that the result is not dependent on the removal of the drift prior to compute the anomalies (not shown).
2.2. Data
We compare the simulated GMST to several data sets of near-surface air temperature:
- ERA-Interim reanalysis (hereafter noted ERAI; Dee et al 2011), available from 1979 to present on a 1.5° × 1.5° horizontal resolution;
- The NASA's Goddard Institute for Space Studies Surface Temperature Analysis (GISTEMP) smoothed at 250 km (Hansen et al 2010), available from 1880 to present at a 2° × 2° horizontal resolution;
- The NOAA Merged Land–Ocean Surface Temperature (MLOST) version 3b of the National Climatic Data Center (NCDC), available from 1880 to present at a 5° × 5° horizontal resolution (Vose et al 2012);
- The Berkeley Earth Surface Temperature dataset (BEST), which is an interpolated dataset of surface air temperature anomalies (with respect to the 1951–1980 period) over land and ocean built from temperature records by using statistical techniques (Rohde et al 2013); BEST is available from 1850 to present at a 1° × 1° horizontal resolution.
3. Results
3.1. Radiative forcing
The 10 year trends of the top of the atmosphere (TOA) net shortwave, longwave and net radiative fluxes are shown in figures 1(b)–(d). The inter-member spread is large in both BAK and VER simulations. We found a large interannual variability in TOA for both BAK, VER, we assume that this can lead to large inter-member spread over short-periods (ten years). As the six-simulation ensemble average is strongly influenced by outliers, we also show the ensemble median. Both BAK and VER exhibit negative 10 year trends in TOA net shortwave (figure 1(b)). The VER trend is stronger than the BAK trend, indicating a stronger decrease in the net shortwave radiation. Moreover the VER-BAK difference is greater than 1 BAK standard deviation (the standard deviation obtained from the six realizations of BAK, figure 1(b)). We split the net shortwave flux into its incoming and outgoing parts (not shown). As the former is the same in both simulations, this indicates that recent eruptions increased the outgoing shortwave radiation, due to the volcanic cloud albedo effect. Santer et al (2014) noted a similar observed change in TOA net shortwave, with a decreased radiative forcing of 0.25 W m−2 per decade over January 2001–December 2012 (the median of the VER-BAK difference is of 0.25 W m−2 per decade between 2003 and 2012).
The TOA longwave flux trends are positive (i.e. downward) and stronger in VER than in BAK (figure 1(c)). This denotes a stronger absorption of upward longwave fluxes in VER, which lead to a warming of the troposphere. It is not strong since the differences in the mean and the median are weaker than 1 BAK standard deviation. The VER minus BAK difference in TOA longwave is due to volcanic eruptions that inject sulphur dioxide (and to a lesser extent, hydrogen sulfide) into the stratosphere, which are converted into sulfate aerosols that act to both scatter solar radiation and absorb longwave and near-infra-red radiation, as shown in Robock (2000) and Timmreck (2012).
Finally the VER simulations exhibit a more negative (i.e. upward) trend in net TOA heat fluxes than BAK and the difference between VER-BAK is even more robust when considering the medians (figure 1(d); online supplementary table S1). This difference indicates a stronger increase in outgoing heat fluxes in VER compared to BAK. The difference, of 0.21 W m−2 in ten years (median) is consistent with the modelled studies of Brühl et al (2015) who obtained a decrease in the radiative forcing by up to 0.2 W m−2 due to the volcanic eruptions between 2005 and 2011.
It is therefore expected that VER simulates a colder mean climate than BAK, which is consistent with the known impact of volcanic eruptions on radiative fluxes at the top of Earth's atmosphere.
3.2. Global mean surface temperature
The 2003–2012 GMST trend ranges from a weak warming in BEST and in Cowtan and Way to a weak cooling in ERAI, in MLOST and in GISTEMP (table 1). Observed 10 year trends have large uncertainties for all data sets (third column of the table 1). The observed trends are close to the 1998–2012 trend (0.03 °C per decade), a result found by Kosaka and Xie (2015) with the HadCRUT 4 dataset.
Table 1. 10 year GMST trend for the different observations, ERAI and the modeled 10 year GMST trend. The 2003–2012 GMST trend error is given by half the 2.5%–97.5% regression coefficient confidence interval. For VER and BAK, the inter-member spread in GMST trend is added.
| Data | 2003–2012 GMST trend | 2003–2012 GMST trend error |
|---|---|---|
| ERAI | −0.005 °C/decade | +/− 0.205 °C/decade |
| Cowtan and Way | +0.028 °C/decade | +/− 0.166 °C/decade |
| MLOST | −0.044 °C/decade | +/− 0.115 °C/decade |
| GISTEMP | −0.038 °C/decade | +/− 0.130 °C/decade |
| BEST | +0.016 °C/decade | +/− 0.172 °C/decade |
| VER | +0.037 °C/decade +/− 0.074 °C/decade | +/− 0.064 °C/decade |
| BAK | +0.118 °C/decade +/− 0.053 °C/decade | +/− 0.077 °C/decade |
The observed data sets have different horizontal resolutions and use various infilling and coverage over the polar regions. Hansen et al (2010) and Cowtan and Way (2014) have shown that discrepancies across the datasets in GMST are mainly due to the estimated temperature in polar regions, where observations are sparse.
The BAK 2003–2012 trend is warmer than the corresponding ERAI trend, with a warming of +0.12 °C (+/− 0.05 °C) in ten years (close to the observed GMST 1951–2012 trend, of +0.11 °C by decade, according to Kosaka and Xie 2015) (table 1 and figure 2(a)). In VER, the 2003–2012 trend is also positive (+0.04 °C +/− 0.07 °C per decade). This trend is close to BEST and 'Cowtan and Way', which are the most reliable observations for the analysis of the GMST, due to a better representation of the surface temperature at high latitudes (Dodd et al 2015). The difference between VER and BAK trend is determined from the time series of paired differences between VER and BAK. It reduces noise levels by subtracting variability components common to VER and BAK. The BAK-VER trend is statistically significant at the 95% confidence level according to a Spearman's rank correlation test. This suggests that the recent volcanism activity has a significant impact on the GMST, reducing the warming trend by about 0.08 °C in ten years, compared to a period of weak volcanic activity.
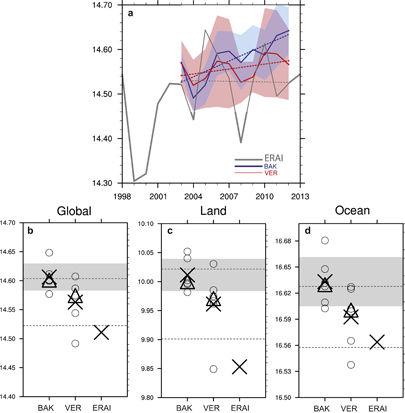
Figure 2 (a) Global-mean surface temperature evolution for ERAI (gray line), BAK (blue line) and VER (red line); the corresponding 2003–2012 linear trend is displayed with discontinuous lines. The blue (red) shading represents the spread (+/− one standard deviation) of the BAK (VER) ensemble-members. Five year (2008–2012) mean in (b) global-mean surface temperature, (c) mean temperature over land and (d) ocean for VER, BAK and ERAI. Circles represent each BAK and VER simulations, crosses represent the ensemble-mean and triangles the ensemble-median. The gray shading (discontinuous lines) is used to delimit the spread (+/− one standard deviation around the ensemble mean) of the BAK (VER) ensemble.
Download figure:
Standard image High-resolution imageBAK and VER GMST differences get stronger with time (figure 2(a)). This can be due to the increase in SAOD after 2007 with stronger peaks mainly due to the Tavurvur (in 2007), Sarychev (in 2009) and Nabro (in 2011) eruptions. From 2003 to 2005, the SAOD values in VER are close to the background (figure 1).
In figure 2 we chose ERAI as our observation data set since it provides information for a large set of variables (see the additional analyses in the supplementary materials) with a complete Earth coverage (avoiding model-observation differences due to different spatial coverages, such as missing values over the Arctic as reported in Hansen et al 2010 and Cowtan and Way 2014). Note that ERAI can be considered as a reference, since estimates of Arctic temperatures and temperature trends are realistic (Simmons et al 2014, Simmons and Poli 2015). In figures 2 (b)–(d), we show the VER-BAK GMST differences for the 5 last years of the simulations (2008–2012), when the difference between the VER and BAK AOD files is the strongest and when the observed impact of the volcanic activity is the strongest since 2003 (Santer et al 2015). The global impact is of −0.04 °C (+/− 0.04 °C). The difference is similar over land (−0.05 °C +/− 0.06 °C) than over the oceans (−0.04 °C +/− 0.03 °C) (figures 2(c),(d)). All these differences are statistically significant at a 95% confidence level following a Monte Carlo approach (more details are available in the supplementary materials; table S1 and table S2). VER simulates a colder mean climate than BAK for the global Earth (figure 2(b)), the land (figure 2(c)) and the ocean (figure 2(d)).
The ERAI-VER difference is however stronger than the VER-BAK difference (and stronger than 1 VER standard deviation on global average). There are clearly other phenomena to take into account to reproduce the observed slightly negative trend, such as, for instance, the cooling over Eurasia in winter, which arises essentially from atmospheric internal variability (Li et al 2015).
3.3. Regional response in temperature, precipitation and heat content
Haywood et al (2014) have shown that the impact of the recent volcanic eruptions is not spatially homogeneous, for example stronger in the Northern Hemisphere than in the Southern Hemisphere. In this section, we focus on the regional responses in temperature and precipitation. Moreover we explore the seasonality of the response.
From November to April (NDJFMA, which includes the boreal winter) the difference in GMST is of −0.03 °C (+/− 0.04 °C). The impact is significant only over several restricted areas (figure 3(a)). Precipitation change only exhibits sparse significant anomalies (figure 3(c)).

Figure 3 NDJFMA (left column) and MJJASO (right column) VER-BAK 5 year mean differences (2008–2012) in (first row) temperature (in °C) and (second row) precipitation (mm.day−1). Dots indicate that anomalies of precipitation (air surface temperature) are significant at the 90% (95%) confidence level according to a Student's t-test. The side plot represents the zonally-averaged VER-BAK differences in temperature and precipitation. Blue filled-circles represent the anomalies of precipitation (air surface temperature) considered significant at the 90% (95%) confidence level according to a Student's t-test.
Download figure:
Standard image High-resolution image
Impacts are of comparable magnitude from May to October (MJJASO, which encompasses the boreal summer) with a decrease in GMST of 0.05 °C (+/− 0.04 °C). The zonally-averaged temperature decreases over the northern hemisphere, due to a cooling of the Arctic. The subpolar gyre warms and the tropical Atlantic and eastern Pacific ocean cool down (figure 3(b)). A stronger impact over the Arctic is consistent with Fyfe et al (2013) and Haywood et al (2014). Moreover the cooling over the Arctic is stronger in MJJASO than in NDJFMA, since it receives more solar flux in summer than in winter, allowing a more efficient direct effect of the volcanic forcing. Precipitation decreases over the equator and south of it, as also suggested in Fyfe et al (2013). This result however disagrees with Haywood et al (2014), who have found a southward shift of the tropical precipitation due to a cooling of the subtropical Atlantic Ocean. The precipitation pattern consists in an increase in precipitation over the western Pacific Ocean and a decrease over the western coast of South America, along the equator, which is consistent with a La Niña pattern.
It has been shown that major volcanic eruptions can affect the ENSO variability, leading to an El Niño (Ohba et al 2013) or a La Niña (Maher et al 2015) event several months after the eruption. Here there is no robust change in ENSO variability (not shown).
The volcanic eruptions can also impact the North Atlantic Oscillation (NAO) variability (Shindell et al 2004). We obtain a tripole in sea-level pressure (SLP) anomaly: a positive pressure anomaly north of Europe and negative ones west of Spain and over north-eastern Canada, i.e. that project on a negative phase of NAO (online supplementary figure S1). The negative NAO pattern is consistent with a decrease in surface zonal wind speed over the North Atlantic (figure S1), and the warming of the north Atlantic SST. However, a NAO index, derived from our simulations, does not indicate a robust change in the NAO variability (not shown).
Gleckler et al (2016) argued that the recent volcanic eruptions led to a decrease in ocean heat-uptake. We however found no strong differences between BAK and VER when considering the global mean heat-content surface to 700 m, 700 m to 2000 m and the deep ocean (>2000 m) (online supplementary figure S2). Here the heat uptake increase is weak and only located to the eastern equatorial Pacific Ocean (online supplementary figure S3).
3.4. Impact of the initial condition and mean state
Pohlmann et al (2004) found that the North Atlantic SSTs, Nordic Seas and Southern Ocean exhibit predictability on multidecadal time scales, owing to the model initialization and the oceanic inertia. Numerous predictability studies have highlighted the importance of the initialization to predict the GMST (Bellucci et al 2013, García-Serrano et al 2015, Karspeck et al 2015). Here we analyze the 10 year trend in GMST for both BAK and VER. In both simulations, temperature increases over the subtropical Pacific Ocean and decreases over the eastern Pacific Ocean, exhibiting a negative phase of the PDO (online supplementary figure S4). CERFACS-HR systematically reproduces a negative phase of the PDO over the 2003–2012 period, as also shown in MO17 due to the ocean initialization (these simulations have common ocean initial conditions).
On the one hand the predictability of the SSTs is mainly given by the model initialization. On the other hand the mean state of the climate system may modulate the impact of the volcanic eruptions (Zanchettin et al 2013). We can thus hypothesize that the impact of the volcanic eruptions could be different without the simulated negative phase of the PDO, and the associated abnormally low GMST.
4. Discussion/conclusion
During the years 2003 to 2012, moderate volcanic eruptions led to an increase in stratospheric AOD (Vernier et al 2011, Santer et al 2013) that impacted the GMST. This phenomenon explains a part of the recent temperature fluctuation. We used the Vernier et al (2011) AOD, which takes into account the presence of the recent volcanic eruptions. Our results suggest, in agreement with Solomon et al (2011), Fyfe et al (2013), Haywood et al (2014), Schmidt et al (2014), Ridley et al (2014), Santer et al (2014, 2015), Brühl et al (2015) and Mills et al (2016) that the recent volcanic activity has reduced the GMST and is therefore one of the causes of the recent reduced warming trend.
A cooling of 0.04 °C (+/− 0.04 °C) over the 2008–2012 period was found in this study. Such result is consistent with Haywood et al (2014), in which the decrease of temperature is of 0.02 °C–0.03 °C. A stronger response found in the Northern Hemisphere than the Southern Hemisphere is also consistent with this author.
Both BAK and VER simulations exhibit a negative phase of the PDO, which is therefore not the only mechanism responsible for a global warming rate slowdown. For instance, even limited increase in volcanism activity, as it occurred in the last decade, has also exacerbated the eastern Pacific cooling.
The induced cooling (0.04 °C) is weaker than in Solomon et al (2011) and Fyfe et al (2013), who obtained a cooling of 0.07 °C. In addition to the sensitivity to volcanic eruptions, several factors can explain this difference. (i) We did not use the same SAOD baseline as in Haywood et al (2014), Solomon et al (2011) and Fyfe et al (2013). (ii) The result can be model-dependent. (iii) Ocean initial conditions can play an important role in the model response and (iv) the relatively small sample size may also lead to large uncertainties.
Fyfe et al (2013), Haywood et al (2014), Santer et al (2014), Ridley et al (2014) and Schmidt et al (2014) used a near-zero value in volcanic forcing do document the importance of volcanic forcing biases. Here we used a baseline based on a weak volcanic activity (a more realistic value since the volcanic activity is not expected to stop) and are dealing with weaker anomalies in radiative forcing. The obtained cooling is thus weaker than in the aforementioned studies. We however assume that this experimental protocol is noteworthy since we can document the impact of natural volcanic activity variability, in absence of intense volcanic events, rather than documenting the impact of using biased low forcing.
Vernier et al (2011) SAOD neglects substantial amounts of volcanic aerosols below 15 km and therefore underestimates total radiative forcing due to the recent eruptions (Ridley et al 2014 and Mills et al 2016). The impact of including the recent volcanic eruptions in climate models could thus have been stronger than previously highlighted and obtained here. Ridley et al (2014) estimated a global cooling of 0.05 to 0.12 °C since 2000 with a better estimation of the global volcanic aerosol forcing.
Results obtained in this study show that moderate volcanic eruptions cause a small cooling of the Earth and highlight the importance of taking into account a realistic volcanic forcing in the climate models. However, this volcano-related cooling is not sufficient to fully explain the recent surface temperature stagnation. The cooling generated by volcanic eruptions is thus not the unique cause for the recent decrease in the overall trend of temperature increase.
The impact of the recent volcanic eruptions is a promising topic for understanding the GMST evolution and its better understanding can help to improve climate model simulations since the stratospheric AOD are not well represented by the CMIP5 climate models in the recent decades (Fyfe et al 2013). Such a study should however be extended to a multi-model analysis, in order to assess the robustness of the results with regard to model sensitivity, and/or with different ocean initial conditions.
Acknowledgments
We thank the three anonymous reviewers for their helpful and constructive suggestions and comments. The authors gratefully acknowledge the support from the Seventh Framework Programme (FP7) of the European Commission (grant agreement 308378) SPECS Project, the PRECLIDE project funded by the BNP-PARIBAS foundation. Simulations were run thanks to PRACE HiResClim I and II projects.