

Abstract
The Chinese economy has been recovering slowly from the global financial crisis, but it cannot achieve the same rapid development of the pre-recession period. Instead, the country has entered a new phase of economic development—a 'new normal'. We use a structural decomposition analysis and environmental input–output analysis to estimate the determinants of China's carbon emission changes during 2005–2012. China's imports are linked to a global multi-regional input–output model based on the Global Trade and Analysis Project database to calculate the embodied CO2 emissions in imports. We find that the global financial crisis has affected the drivers of China's carbon emission growth. From 2007 to 2010, the CO2 emissions induced by China's exports dropped, whereas emissions induced by capital formation grew rapidly. In the 'new normal', the strongest factors that offset CO2 emissions have shifted from efficiency gains to structural upgrading. Efficiency was the strongest factor offsetting China's CO2 emissions before 2010 but drove a 1.4% increase in emissions in the period 2010–2012. By contrast, production structure and consumption patterns caused a 2.6% and 1.3% decrease, respectively, in China's carbon emissions from 2010 to 2012. In addition, China tends to shift gradually from an investment to a consumption-driven economy. The proportion of CO2 emissions induced by consumption had a declining trend before 2010 but grew from 28.6%–29.1% during 2010–2012.
Export citation and abstract BibTeX RIS

Original content from this work may be used under the terms of the Creative Commons Attribution 3.0 licence.
Any further distribution of this work must maintain attribution to the author(s) and the title of the work, journal citation and DOI.
1. Introduction
China's rapid economic growth has simultaneously brought wealth to its people and generated significant greenhouse gas (GHG) emissions (Davis and Socolow 2014, Mi et al 2015, Zhang et al 2016). China's average annual gross domestic product (GDP) growth rate was approximately 10% over the period 1978–2007 (National Bureau of Statistics 2015b). Meanwhile, China's CO2 emissions also rose sharply over the same period, with China surpassing the United States in 2006 as the largest CO2 emitter in the world (Davis et al 2013, Wei et al 2015, Zhang et al 2017). However, China's high-speed economic growth was severely damaged by the global financial crisis of 2008. China's GDP growth rate dropped to 6.9% in 2015, and this downward trend will likely continue. China's exports and imports were both seriously affected with net exports declining by 38% from 2008 to 2009 (Davis and Diffenbaugh 2016, National Bureau of Statistics 2015b).
As a means of minimizing the impact of the global financial crisis, the Chinese government created a Chinese economic stimulus plan, which included a four trillion yuan (approximately 586 billion USD) stimulus package. The plan mainly focused on fixed assets and construction, such as high-speed rail network, rural infrastructure, urban electrical grid and post-quake reconstruction. The four trillion Yuan stimulus package has helped reduce the impact of the crisis. Although the Chinese economy has been recovering slowly, it cannot continue the rapid development before the recession. The country has entered a new phase of economic development—a 'new normal'. China is striving to promote economic growth while driving down CO2 emissions by changing economic structures, improving efficiency levels, and cleaning up energy mix (Green and Stern 2015). In this study, we use the most recent official Chinese energy data and economic input–output (IO) tables to estimate the determinants of CO2 emission changes in China during 2005–2012, with a particular focus on the effects of global financial crisis and pattern changes in the 'new normal'.
A structural decomposition analysis (SDA) (Leontief and Ford 1972, Rose and Casler 1996) is used to extend the Impact = Population × Affluence × Technology (IPAT) model (Ehrlich and Holdren 1971, Wan et al 2016) to estimate the key drivers of China's CO2 emission changes from 2005 to 2012. The SDA approach has been widely used to assess the driving forces of CO2 emission growth at a global level (Arto and Dietzenbacher 2014, Malik et al 2016, Xu and Dietzenbacher 2014) and provide national analyses to the United States (Feng et al 2015, Kotchen and Mansur 2016), the United Kingdom (Baiocchi and Minx 2010), Norway (Yamakawa and Peters 2011) and Australia (Wood 2009). A few studies focused on China. For example, Xiao et al (2016) and Chang and Lahr (2016) used the SDA approach to identify the key factors that affected CO2 emissions in China for the time periods 1997–2010 and 2005–2010, respectively. The key findings of these two studies were that efficiency helped to reduce emissions, while capital investment explained the majority of the increases in CO2 emissions brought about by final demand. Some studies that focused on the time periods prior to the global financial crisis showed the great contribution of export to China's CO2 emission growth. For example, Minx et al (2011) found that export final demands have grown most rapidly compared to all other final demands for 1992–2007 (225% increase). CO2 emissions embodied in export increased from 408 Mt in 1992 to 1732 Mt in 2007. Guan et al (2009) indicated that Chinese export production was responsible for one-half of the emission increases from 2002 to 2005.
The paper contributes a more recent dataset, the latest published energy and emission data and input–output table, which allows us to explore new drivers of emission changes during recessions and recent changes in the development pattern in China. The SDA method is a well-developed and robust approach extensively used in earlier studies.
2. Method and data
2.1. Environmental input–output analysis and structural decomposition analysis
The environmental input–output analysis (IOA) method is an established life cycle assessment (LCA) and carbon emissions analysis approach (Meng et al 2015, Mi et al 2017a, Mi et al 2017b). It can be mathematically expressed as follows:
where (I− A)−1 is the Leontief inverse matrix, C are the total CO2 emissions, F is a row vector of carbon emissions intensities (CO2 emissions per unit of economic output) for each economic sector, I is the identity matrix, A is a matrix denoting the monetary relationship between different sectors of the economy, and y is a column vector of final demand for each economic sector (Zhang et al 2015).
A country's CO2 emissions change over time for various reasons. Five factors (population, efficiency, production structure, consumption patterns and consumption volume) are considered to assess changes in China's CO2 emissions via an SDA, which is represented as follows:
where
∆: the change in a factor;
p: a scalar that represents the population;
F: a row vector that represents carbon emissions intensities;
L: the Leontief inverse matrix, L = (I− A)−1;
ys: a column vector that represents per capita consumption patterns; and
yv: a scalar that represents the per capita consumption volume.
Each of five terms in equation (2) denotes the contributions to CO2 emissions changes that are triggered by one driving force if the rest of the variables are kept constant. When conducting an SDA, evaluating different terms for the start or end point of the investigated time period is possible. There are several methods for dealing with this issue. For example, Su and Ang (2012) summarized four SDA methods and pointed out their pros and cons. In this study, we take the average of all possible first-order decompositions to address this issue. Five factors are considered in this paper, so there are 5! = 120 forms. For a detailed discussion, see Dietzenbacher and Los (1998) and Hoekstra and Van Den Bergh (2002).
2.2. CO2 emission inventory construction
Based on our previous studies (Mi et al 2017b, Mi et al 2016, Shan et al 2016a, Shan et al 2016b), we adopted the Intergovernmental Panel on Climate Change (IPCC) administrative territorial CO2 emissions inventories for China's emission accounting in this study. The inventories compiled in this study include two parts: emissions from fossil fuel combustion and from cement production. For CO2 emissions from fossil fuel, we calculate the emissions by (IPCC 2006, Liang et al 2016):

where Cfossil are the CO2 emissions from fossil fuel, Dfossil is the fossil fuel consumption (in physical units), N is the net calorific value that represents heat released when the unit fossil fuel is combusting, H is the carbon content that represents CO2 emitted when unit heat is released, and O is the oxygenation that represents the oxidization rate of fossil fuel combustion. N × H × O is defined as emission factors. See table S1 available at stacks.iop.org/ERL/12/074003/mmedia in the supplementary information for all emission factors for fuel combustion.
To avoid missing or double accounting, we calculate the fossil fuel consumption by (Peters et al 2006):
The CO2 emissions from cement production are calculated by (IPCC 2006):

where Ccement are the CO2 emissions from cement production, Dcement is the cement production amount, E is the emission factor of cement production that represents CO2 emit when producing unit cement. The emission factor for the cement process is 0.2906 tonne CO2 per tonne cement produced (Liu et al 2015).
2.3. Linking China's imports to global multi-regional input–output model
Due to the differences in technology, the carbon intensity of China's imports is different from that of its domestic products. Many previous studies assumed that the imports to China were produced with Chinese technology (Guan et al 2008). This approach may cause large errors in estimating the emissions embodied in imports (Meng et al 2016). In this paper, we link China's imports to a global multi-regional input–output (MRIO) model which are based on the Global Trade and Analysis Project (GTAP) database. China's imports in each sector are divided into all other regions of the world according to the GTAP database. The CO2 emissions embodied in imports are calculated using the global MRIO model:
where Dimport are the embodied CO2 emissions in imports,  is a row vector of carbon emissions intensities for all sectors in all regions,
  is the direct requirement matrix for the global MRIO model, yimport is a column vector of China's imports from all sectors in all regions.
Several recent studies analyzed supply chain relationships in the export processing sectors which can substantially affect the emissions attributed to exports. The processing exports, which generate relatively little value added but also relatively little emissions, account for a large proportion of China's total exports. Therefore, the CO2 emissions embodied in China's exports are likely to be overestimated if export processing is not taken into consideration (Dietzenbacher et al 2012).
2.4. Data sources
Two main datasets were examined in this study: time-series IO tables and corresponding CO2 emissions data. China IO tables for 2005, 2007, 2010, and 2012 were published by the National Bureau of Statistics (NBS) of China and can be freely downloaded from the NBS website (National Bureau of Statistics 2016). NBS regularly publishes China's national input–output tables based on national surveys every five years. In this study, 2007 and 2012 IO tables are the surveyed ones. In between the five-year period, NBS updates extend-tables to reflect new changes in economic production and consumption based on economic upscaling and balancing methods. The adopted 2005 and 2010 IO tables by this study are the extended version. The production structure changes in extended IO tables cannot be fully represented, but these tables capture essential interdependences among different economic sectors.
We deflated all the tables to 2012 prices using the double deflation method (UNSD 1999). The pricing data for China's IO tables were gotten from the China Statistics Yearbook (National Bureau of Statistics 2007, 2011, 2015b), while the pricing data for China's imports and global MRIO tables were obtained from the National Account Main Aggregates Database (UNSD 2016). In addition, the import value of China was deflated by the weighted average price deflators of all regions (excluding China). The weight for one region was in proportion to China's imports from the region. It needs to be noted that there are several drawbacks related to the double deflation method, although this method is widely accepted. Firstly, by adopting this method, most sectors are assumed to produce one homogeneous product, each sector's gross output and intermediate and final demand are deflated by this sector's price index (Dietzenbacher and Hoen 1998). However, most sectors consist of more than one good; therefore to use the price index of certain goods to represent the entire sector is not always appropriate (Sevaldson 1976). Secondly, value-added is obtained as the difference between the total input and intermediate input in each sector. Consequently, it is not accurate to use value-added to balance the IO table after the deflation (Wolff 1994).
Fossil fuel consumption, cement production and emission factors were necessary to compile CO2 emissions inventories. We used the most recent Chinese energy data published in China Energy Statistical Yearbooks 2014 and 2015 (National Bureau of Statistics 2014, 2015a). In these recent datasets, there are unusually large adjustments on Chinese energy data (EIA 2015). The cement production amount was collected from the China Statistical Yearbook 2015 (National Bureau of Statistics 2015b). We used emission coefficients from our previous studies (Liu et al 2015). The coefficients are measured based on 602 coal samples from the 100 largest coal-mining areas in China and are assumed to be more accurate than the IPCC default value. All the inventories used in this study can be freely downloaded from the website of China Emission Accounts and Datasets (CEADs) (www.ceads.net/) (Mi et al 2017b, Mi et al 2016, Shan et al 2016a). China's CO2 emission inventory for 47 sectors for 2000–2015 is shown in the online supplementary information. The inventory includes CO2 emissions from fossil fuel combustion and cement production.
Global MRIO tables were obtained based on version 9 of the GTAP database, which describes bilateral trade patterns, production, consumption and intermediate use of commodities and services among 140 regions for 57 sectors for the years 2004, 2007 and 2011 (Dimaranan 2006, Narayanan et al 2015). See table S2 in the supplementary material for the concordance of sectors for Chinese IO tables, carbon emission inventories and GTAP MRIO tables.
3. Results and discussions
3.1. Determinants of emissions changes during the global financial crisis
From 2005 to 2010, Chinese production-based CO2 emissions increased by 47% from 5159 million tonnes (Mt) to 7604 Mt (figure 1, black curve). Clearly, efficiency was a strong factor in offsetting emissions during 2005–2010 (figure 1, blue curve). The efficiency gains offset 39% of emissions by keeping other driving forces constant. In fact, Chinese carbon intensity decreased by 10% over this period (figure 2(a), black curve). From a sectorial perspective, carbon intensity in agriculture and industry decreased by 24% and 30%, respectively, from 2005 to 2010. See figure S1 for changes in the carbon intensity levels of all 20 sectors.

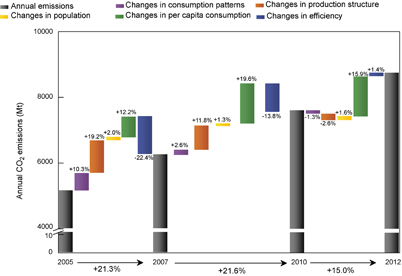
Figure 1 Contributions of different factors to changes in Chinese CO2 emissions between 2005 and 2012. Using 2005 as a base year, the black line shows the percentage change in total emissions. The other lines show contributors to emission changes for population (yellow), efficiency (blue), production structure (orange), consumption patterns (purple) and per capita consumption (green).
Download figure:
Standard image High-resolution image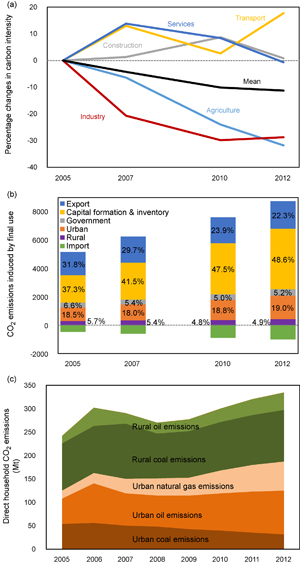
Figure 2 Trends underlying the decomposed factors from 2005 to 2012. (a) Percentage changes in the carbon intensity levels of key sectors in the Chinese economy. (b) Chinese CO2 emissions induced by different final uses (rural consumption, urban consumption, government consumption, capital formation, inventory changes and exports). (c) Direct household CO2 emissions in China.
Download figure:
Standard image High-resolution imageHowever, the other four factors drove emissions growth from 2005 to 2010. Per capita consumption alone drove 36% of emission increases with other factors held constant, and production structural changes increased emissions by 34% compared with 2005 levels (figure 1, green). Changing consumption patterns and population growth were relatively weak factors, causing approximately 14% and 4% of emissions increases, respectively.
The global financial crisis had impacts on the determinants of Chinese carbon emissions changes. First, the CO2 emissions embodied in Chinese exports from 2007 to 2010 dropped (figure 3(b)). Investments, consumption and exports form the triumvirate that supports Chinese economy. China has become a 'factory to the world'; thus, exports play a critical role in promoting its economic development. Export-induced CO2 emissions increased by 214 Mt from 2005 to 2007, which accounted for about 20% of total emissions growth for that period (figure 3(a), blue section). However, China's exports sharply declined after the global financial crisis. As a result, CO2 emissions induced by exports from 2007 to 2010 declined (figure 3(b), blue section). Several sectors were affected greatly. For instance, CO2 emissions induced by metal product exports fell by 26% from 361 Mt in 2007 to 267 Mt in 2010. CO2 emissions induced by textiles exports also declined by 15% over the same period (figure S2). Chinese export-induced emissions represented 24% of Chinese CO2 emissions in 2010, decreasing from levels in 2005 (32%) and 2007 (30%) (figure 2(b), blue bar).

Figure 3 Contributions of different sectors and final uses to Chinese CO2 emissions growth from 2005 to 2012. (a), (b) and (c) show the results for 2005–2007, 2007–2010 and 2010–2012, respectively. The figures in parentheses refer to total contributions of different final uses to CO2 emissions growth (Mt CO2).
Download figure:
Standard image High-resolution imageOn the contrary, Chinese CO2 emissions induced by capital formation from 2007 to 2010 grew rapidly mainly due to the government's response to the financial crisis. Chinese exports were severely affected by the financial crisis; as such, the government increased its investments on capital formation to promote its economic growth. The four trillion yuan stimulus package is mainly focused on fixed assets and construction, such as the high-speed rail network, rural infrastructure, urban electrical grid and post-quake reconstruction. As a result, approximately 71% of the CO2 emissions growth from 2007 to 2010 was due to capital formation (figure 3(b), yellow section), which was much higher than those during 2005–2007 (61%) and 2007–2012 (56%). From a sectorial perspective, the CO2 emissions induced by the capital formation in terms of construction rose by 27% from 1762 Mt in 2007 to 2246 Mt in 2010. The CO2emissions induced by the capital formation with respect to transport equipment also increased by 86% (156 Mt) during the same period, which was much higher than those for 2005–2007 (40 Mt) and 2010–2012 (17 Mt) (figure 3). One of the reasons for the emission increase in transport equipment is the rapid development of the high-speed railway. The length in operation of the high-speed railway increased by 664% from 672 km in 2008 to 5133 km in 2010, and its passenger traffic also grew from 7 million in 2008 to 133 million in 2010 (National Bureau of Statistics 2015b). The proportion of capital formation-induced emissions of the total CO2 emissions grew from 41% in 2007 to 48% in 2012. It can be seen from the figure 2(b) that the switch from exports to capital formation can be observed through the entire period (2005–2012), but the financial crisis made it faster.
In addition, Chinese direct household CO2 emissions declined from 2006 to 2008. With improvements in Chinese living standards, direct household emissions increased before 2006. However, direct household emissions declined by 11% from 302 Mt in 2006 to 270 Mt in 2008 (figure 2(c)). It was mainly caused by the decreases of household oil consumption. Moreover, the direct CO2 emissions per capita of urban residents were greater than those of rural residents in China, but the gap was diminishing. The direct CO2 emissions per capita of urban residents were 42% higher than those of rural residents in 2005 and 15% higher in 2012.
3.2. Changes in development patterns in the 'new normal'
China has struggled to achieve a 'new normal' since the global financial crisis. According to China's traditional development model, production structure and consumption patterns drive Chinese CO2 emissions growth, whereas efficiency gains constitute the main factor that offsets emissions (Guan et al 2009, Peters et al 2007). We found that production structure and consumption patterns caused 34% and 14% increases, respectively, in China's CO2 emissions from 2005 to 2010, whereas efficiency levels induced a 39% decrease in Chinese CO2 emissions over the same period (figure 1).
However, the effects of these factors on Chinese CO2 emissions have changed considerably under the 'new normal'. First of all, as the strongest factor offsetting emissions from 2005 to 2010, efficiency drove a 1.4% increase in emissions from 2010 to 2012 (figure 4, blue bar). Almost all studies that focused on China's emission changes during the time periods prior to 2010 have shown the great contributions of efficiency to offset CO2 emissions (Chang and Lahr 2016, Guan et al 2009). Peters et al (2007) summarized China's CO2 emission changes as a race between increasing consumption and efficiency gains. However, China's lost its advantages of efficiency improvement during 2010–2012. This effect mainly resulted from efficiency losses in the transport and industrial sectors. Although the mean carbon intensity of the Chinese economy declined slightly from 2010 to 2012, the carbon intensity of the transport and industrial sectors increased by 15% and 2%, respectively.
Figure 4 Contributions of different factors to changes in Chinese CO2 emissions for 2005–2007, 2007–2010 and 2010–2012. As the strongest factor offsetting emissions from 2005 to 2010, efficiency drove emissions growth during the period 2010–2012. By contrast, in driving emissions growth from 2005 to 2010, production structure and consumption patterns decreased emissions during the period 2010–2012.
Download figure:
Standard image High-resolution image
By contrast, changes in production structure (figure 4, orange bar) and consumption patterns (figure 4, purple bar) caused 2.6% and 1.3% decreases in Chinese CO2 emissions, respectively, from 2010 to 2012. The two factors both drove increases in CO2 emissions during 2005–2010. From the production perspective, the effects of production structure were mainly driven by the reduction of proportions of carbon-intensive sectors in total inputs, i.e. inputs from transport, electricity, gas, and nonmetallic mineral products sectors to other production sector. The sector of electricity had the highest carbon intensity among all economic sectors, and its proportion as inputs to other sectors declined from 5.1% in 2010 to 4.6% in 2012 (figure S3). Further, the proportion of electricity sector as inputs to mining sector declined from 13.0% to 11.4% during 2010–2012. The proportion of transport in total inputs also declined from 5.6% to 4.6% over the same period. Further, the proportion of transport as inputs to the sector of wholesale, retail and catering declined from 12.7% to 8.1% during 2010–2012.
From the consumption perspective, the effects of consumption patterns were mainly due to the reduction of proportions of electrical equipment and chemicals in final use, because the embodied carbon emission intensity (i.e. direct and indirect CO2 emissions induced by per unit of final use) in these sectors was relatively higher (figure S4). For example, the proportion of electrical equipment in total consumption-based CO2 emissions declined from 5.9% in 2010 to 4.7% in 2012, and the proportion of chemicals in total consumption-based emissions also decreased from 3.4% to 3.2% over the same period (table S3).
Another change in the 'new normal' is that the proportion of CO2 emissions induced by consumption (including household and government consumption) has begun to increase. Prior to 2010, the proportion of consumption induced CO2 emissions had a declining trend. However, it grew from 28.6% in 2010 to 29.1% in 2012. Although it is a very slight increase, it reflects Chinese efforts of expanding domestic demand and stimulating consumption. This shift was mainly because of changes in China's investment and consumption structure (figure S5). China's consumption rate (i.e. the proportion of final consumption in GDP) had declined since 2000 until reaching the lowest point with 48.5% in 2010. Meanwhile, its investment rate (i.e. the proportion of capital formation in GDP) peaked. After that, its consumption rate increased to 51.6%, while the investment rate declined to 44.9% in 2015. According to the report of the State Information Center, China will shift gradually from an investment to a consumption-driven economy, and its consumption rate will continue to increase until peaking about 60%–70% (State Information Center 2016). This shift will result in increases in the proportion of CO2 emissions induced by consumption.
4. Conclusions
The global financial crisis has affected the determinants of Chinese carbon emissions changes. The CO2 emissions induced by Chinese exports from 2007 to 2010 declined, whereas the emissions induced by capital formation grew rapidly over the same period. Chinese export production always contributed to a large part of its CO2 emission growth before 2007. However, the demand for Chinese exports waned due to the global financial crisis, which resulted in the decreases of the CO2 emissions induced by exports from 2007 to 2010. To minimize the impact of the financial crisis, the Chinese government created a four trillion yuan stimulus package that mainly focused on fixed assets and construction. Consequently, more than 70% of the CO2 emissions growth from 2007 to 2010 resulted from capital formation. Therefore, government policies have big influences on CO2 emissions. China's CO2 emissions would be much less during 2007–2010 if the stimulus package was not created.
In the 'new normal', the strongest factors that offset CO2 emissions have shifted from efficiency gains to structural upgrading. Efficiency was the strongest factor offsetting emissions before 2010 but drove an increase in emissions in the period 2010–2012. As a developing country, China has the late-developing advantages, and its carbon intensity usually declined more rapidly than that in developed countries. However, China has lost its advantages of efficiency improvement since 2010, which means that the country needs to find new ways to mitigate its CO2 emissions. Production structure and consumption patterns are likely to be main driving forces to reduce emissions in China in the future. These two factors caused decreases in CO2 emissions in China from 2010 to 2012, although they were the main factors to drive emissions growth before 2010. The effects of these two factors were mainly caused by the structural upgrading from production and consumption perspectives, respectively. From the production perspective, the effects of production structure were mainly due to the reduction of proportions of transport, electricity, gas and nonmetallic mineral products in total inputs. From the consumption perspective, the effects of consumption patterns were mainly due to the reduction of proportions of electrical equipment and chemicals in final use.
In addition, China has a tendency to shift gradually from an investment to a consumption-driven economy. The proportion of CO2 emissions induced by consumption had a declining trend before 2010 but grew during 2010–2012. China's new development model emphasizes the structural upgrading: shifting the balance of growth away from heavy-industrial investment and towards domestic consumption, particularly for services. This shift has been observed in the determents of Chinese CO2 emission changes during 2010–2012 and is likely to continue, which gives China opportunities to reduce CO2 emissions while its GDP still grows. According to the latest datasets, China's CO2 emissions have declined from 2013 to 2014.
However, this paper has limitations. First, only five factors are considered to estimate changes in China's CO2 emission changes. Some other determinants, such as energy structure and urbanization, are not analysed in this paper. In the future work, we will make more detailed decomposition analysis on China's emission changes. Second, all data of China's IO tables and carbon emissions inventories are aggregated into 20 economic sectors. Sector aggregation has impacts on model results. Su et al (2010), for example, estimated the effects of sector aggregation on CO2 emissions embodied in trade in input–output analysis and indicated that levels around 40 sectors are sufficient to capture the overall share of emissions embodied in a region's exports. Third, China is a very large country by area, and different provinces vary greatly in population, production structure, consumption patterns and GDP. Regional differences cannot be analysed based on China's national input–output tables. We have constructed a 2012 MRIO table for 30 Chinese provinces and linked it to the GTAP global MRIO model. Based on the MRIO tables, we will analyse the drivers of regional CO2 emission changes for China.
Acknowledgments
This work was supported by National Key R & D Program of China [No. 2016YFA0602604], National Natural Science Foundation of China [No. 71603248, 71521002, 71020107026, 71573013 and 41328008], the UK Economic and Social Research Council [No. ES/L016028/1], Natural Environment Research Council [No. NE/N00714X/1], British Academy Grant [No. AF150310] and the joint Leverhulme Trust and Social Sciences Faculty Postgraduate Studentships at the University of East Anglia.