


Abstract
China is the world's top carbon emitter and suffers from severe air pollution. It has recently made commitments to improve air quality and to peak its CO2 emissions by 2030. We examine one strategy that can potentially address both issues—utilizing long-distance electricity transmission to bring renewable power to the polluted eastern provinces. Based on an integrated assessment using state-of-the-science atmospheric modeling and recent epidemiological evidence, we find that transmitting a hybrid of renewable (60%) and coal power (40%) (Hybrid-by-wire) reduces 16% more national air-pollution-associated deaths and decreases three times more carbon emissions than transmitting only coal-based electricity. Moreover, although we find that transmitting coal power (Coal-by-Wire, CbW) is slightly more effective at reducing air pollution impacts than replacing old coal power plants with newer cleaner ones in the east (Coal-by-Rail, CbR) (CbW achieves a 6% greater reduction in national total air-pollution-related mortalities than CbR), both coal scenarios have approximately the same carbon emissions. We thus demonstrate that coordinating transmission planning with renewable energy deployment is critical to maximize both local air quality benefits and global climate benefits.
Export citation and abstract BibTeX RIS

Original content from this work may be used under the terms of the Creative Commons Attribution 3.0 licence.
Any further distribution of this work must maintain attribution to the author(s) and the title of the work, journal citation and DOI.
1. Introduction
Most countries now recognize that climate change is a serious problem, and are experimenting with ways to cut greenhouse gas (GHG) emissions that align with their national interests. For most developing countries that means finding ways in which reducing GHG emissions facilitates the achievement of local goals such as reduced air pollution with associated improvements in public health [1]. Given the short time horizon of politicians and the fact that global benefits from reductions in climate change are diffused over all countries, tangible national co-benefits have proved to be more effective in motivating immediate carbon mitigation actions than the long-term threat from climate change [2].
One central finding from the latest report of the Intergovernmental Panel on Climate Change (IPCC) is that electrification will likely play a central role in decarbonizing energy systems [3]. Decarbonization by electrification is possible in many ways, and many governments are looking at much larger roles for renewables—an option that requires careful long-distance transmission planning since renewable resources are often remote from centers of power demand and often variable and intermittent in supply (especially wind and solar power) [4, 5]. They hence often require transmission systems sized much larger than the useful power they consistently deliver, and require local suppliers of electricity to manage reliability—often by using fossil-based power plants that contribute to local air pollution. However, most transmission lines are powered entirely by fossil-based energy at present. Although electricity transmission could help relocate fossil-based generation and associated air pollution to remote areas, fossil fuel powered 'energy by wire' approaches still result in large carbon emissions and global climate impacts. Thus 'energy by wire' strategies may involve tradeoffs between local and global benefits. Our paper develops methods to quantify these tradeoffs.
We focus on China, where national policy has emphasized the need to achieve global carbon mitigation goals in ways that maximize national air pollution benefits [6, 7]. China thus serves as a valuable test case for other emerging economies—such as India, South Africa and Indonesia—that also have large potentials for curbing their growing CO2 emissions but are wary of adopting expensive policies unless they yield large, tangible local benefits. Moreover, China is a pivotal country in global cooperation on energy and climate. The country is the world's top carbon emitter and largest investor in renewable energy. It has recently made commitments to peak its CO2 emissions by 2030 [8]. Most importantly, as a country facing severe air pollution, concerns about air pollution have already inspired the government to move coal power plants out of polluted urban areas in the east and to expand investment in long-distance transmission capacity. Twelve 'Electricity Transmission Corridors for Air Pollution Control' are under construction to replace eastern coal power generation with imported electricity in order to reduce local air pollution [9] (figure 1(a) and supplementary table 1, available at stacks.iop.org/ERL/12/064012/mmedia), making it the first time in the world that transmission planning is used for air pollution control. The experience with these transmission systems is likely to guide subsequent investment in China and other countries.
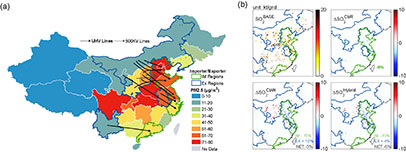
Figure 1 (a) Electricity Transmission Corridors for Air Pollution Control in China. Simulated annual mean provincial-averaged PM2.5 concentrations in BASE (four month average of January, April, July, October 2010) are indicated in color for each province. The arrows indicate the general origins, directions and destinations of the transmission lines. Electricity importing and exporting provinces are highlighted with green and blue boundaries, respectively. Nine lines will rely on ultra-high-voltage (UHV) transmission technology (direct current transmission lines at voltage of ±800 KV and alternating current lines at 1000 KV). (b) Air pollutant emissions. Annual total SO2 emissions from electricity generation in BASE, and changes in the energy transfer scenarios (emission changes shown in 0.25 × 0.25 degree grid size). For CbR, the percentage shows the percent reduction in local emissions in the eastern provinces due to upgraded coal power generation. For energy-by-wire scenarios, the percentages show the changes in emissions as a percentage of total local emissions in importing (IM) and exporting (EX) regions in BASE, as well as the net changes as a percentage of total emissions in the importing and exporting regions (NET = ΔSO2(IM + EX)/SO2,BASE(IM + EX)).
Download figure:
Standard image High-resolution imageMost previous studies on electricity transmission either focus entirely on the carbon emissions [10, 11] or simply tabulate the reduction of local air pollutant emissions without evaluating the impact of those emissions on air quality and human health [12]. Here we not only account for the carbon emissions, but also conduct a sophisticated evaluation of the air quality impacts on health. We use a regional state-of-the-science air pollution model [13] to fully consider the effect of meteorological factors and atmospheric chemistry, and recent epidemiological evidence that finds decreasing health impacts from a unit increase in PM2.5 (fine particulate matter of 2.5 μm diameter or smaller) at the elevated PM2.5 concentrations found in highly polluted parts of China (i.e. concave shape of mortality risk functions) [14, 15]. Furthermore, most prior literature has looked at highly stylized scenarios—such as fully coal-by-wire [16] (which reduces local air pollution but has little global benefit) or almost fully renewables such as wind-by-wire [17] (which can be quite expensive given the variability of wind resources). In contrast, our approach examines scenarios that align with current government plans for the near future of the Chinese power system. Based on current plans, nine of the twelve proposed lines will transmit only coal power. Two are planned to transmit wind power along with coal power (though the exact power mix is not specified in the plan), and a third in southern China will be powered entirely by hydroelectricity. We therefore look at a fully coal by wire scenario, and compare it to a hybrid of renewables and coal by wire scenario considering the renewable resource potentials in the power exporting regions. The current government plan is in between these two 'by-wire' scenarios, and likely closer to the fully coal by wire scenario. Due to the geographic mismatch between resource-abundant western provinces and the demand centers in the east, long-distance transmission is critical in both scenarios in order for the eastern provinces to access coal or renewable resources in inland regions. We also compare these two 'by-wire' strategies to 'coal by rail', the most commonly used energy transfer option at present in which coal (abundant in the west of the country) is transported as primary fuel to wealthier, populous centers in the east where it is burned to generate power [18].
2. Methods and materials
2.1. Energy and emission scenarios
We design a base case (BASE) plus three additional scenarios that are rooted in real-world options for Chinese policy makers (table 1 and online supplementary tables 2–3). The BASE uses the actual electricity generation [19] and emission data (Multi-resolution Emission Inventory, MEIC [20]) for 2010. Two scenarios represent the two main options for coal-fired power: coal-by-rail (CbR) and coal-by-wire (CbW). We replace small, inefficient coal units in the eastern provinces with larger, more efficient coal power plants added locally in CbR, or with imported coal-fired electricity in CbW that is transmitted through long-distance transmission lines in the dozen corridors shown in figure 1(a). Different geographic location of coal power generation in CbW and CbR can affect population exposure and the health impacts [21]. Third we design a hybrid by wire scenario (Hybrid) in which both renewable (wind and hydro, 60%) and coal-fired electricity (40%) is transmitted to replace eastern coal power generation. This 60/40 split is based on a high estimate of provincial renewable resource potential in the exporting regions [22] and the extent to which these regions would allow excess renewable power exports. In other words, our Hybrid scenario assumes the largest possible amount of renewable transmission through the proposed lines, whereas the CbW scenario assumes no renewable transmission at all. We thus provide a high and low estimate for the potential share of renewables in the fuel mix to power the proposed lines.
Table 1. Scenario Summary.
| Scenario Name | Percent change in electricity production | |||
|---|---|---|---|---|
| Base Case (BASE) | No change, actual 2010 electricity generation | |||
| IM regions | EX regions | |||
| Coal-by-rail (CbR) | No change in total generation, but use larger, cleaner coal units | No change | ||
| Energy-by-wire | Coal-by-wire (CbW) | −31%: Reduce coal power generation from small, dirty units | +48%: Add power generation for transmission | All from coal |
| Hybrid-by-wire (Hybrid) | 60% from wind and hydro |
|||
aHydro for Yunnan, wind for the rest of exporting regions. The upper limit of wind power production in each exporting province is from the high estimate of provincial-scale wind resource potential in He and Kammen 2014 [26]. (Note: IM and EX regions indicate importing and exporting regions)
We assume the transmission lines operate at an annual average utilization rate of 80% with no transmission losses. These assumptions allow for the largest transmission volume and associated benefits that can be achieved from the proposed lines. Realizing that the actual utilization rate may be lower and the transmission losses can be significant, we conduct sensitivity analyses on a lower utilization rate of 50% (online supplementary figure 12) and 0%–10% transmission losses (online supplementary figure 9). If a transmission line involves more than one recipient province, we assume the imported electricity is distributed among the recipients according to their electricity demand in 2010. If one line involves two exporting provinces, we assume each of them produces half of the coal-fired electricity transmitted through the line. As for the scale, the transmitted electricity could replace one-third of BASE power generation in the importing regions, while requiring production in exporting regions to increase by ∼50%. In Hybrid, the total penetration of wind generation is 6% for the importing and exporting regions together (online supplementary table 3).
We calculate the changes in annual total emissions of CO2 and air pollutants by multiplying the changes in electric power output resulting from the displaced and added generation with the emission factors of the respective generation technology (online supplementary tables 2 and 4). We only consider combustion-related CO2 emissions from the coal units [23], and air pollutant emissions from the electricity production process. The air pollutant emission factors for the displaced coal units are estimated from a database [24], while those for added coal capacity are based on Zhao et al 2014 [25]. We assume no air pollutants or CO2 emissions from renewable generation. The emissions from non-power sectors and in non-importing/exporting provinces remain unchanged.
2.2. Regional atmospheric chemistry simulation and evaluation
For BASE and the three energy transfer scenarios, we simulate air quality in East Asia for January, April, July and October 2010 using WRF-Chem v3.6 [13] at 27 × 27 km2 horizontal resolution with 31 vertical layers from the surface to 100 hPa. The model uses RADM2 gas-phase chemistry and the MADE-SORGAM aerosol scheme, with the meteorological fields nudged towards the NCEP FNL data [27] every 6 h. The chemistry initial and boundary conditions are provided by a global chemistry transport model, MOZART-4 [28]. For BASE, we use anthropogenic emissions from the MEIC database for China (0.25 × 0.25 degree) [20] and the 2006 INTEX-B inventory for regions outside China [29]. For energy transfer scenarios, we allocate annual total emissions to gridded hourly emissions following the spatial and temporal pattern in the BASE inventory. All anthropogenic emissions are emitted to the model surface layer. The BASE simulations are evaluated using observational data from U.S. State Department China Air Quality Monitoring Program [30] and the Acid Deposition Monitoring Network in East Asia (EANET) [31] (online supplementary table 10 and supplementary figures 1–4). More details are described in online supplementary table 5.
2.3. Evaluating health impacts from air pollution exposure
We focus on ambient fine particulate matter (PM2.5), the air pollutant with the largest impact on human health [32] (see online supplementary figures 4 and 8 for results on ozone). For four diseases associated with long-term exposure to PM2.5 (ischemic heart disease, stroke, chronic obstructive pulmonary disease and lung cancer), we use the following equation to calculate the mortality changes relative to the BASE scenario in each province:
Pop is the total adult population aged 25 and above in each province, based on county-level China census data [33]. Id,BASE is the disease-specific (d) annual average national BASE mortality rate in the total adult population. RRd(Cs) and RRd(CBASE) are the relative risks (RR) of disease d for adult population at the PM2.5 levels of Cs in scenario s and CBASE in BASE, respectively. Id,BASE and RR are based on the Global Burden of Disease (GBD) database [15]. We use the four-month average of the simulated population-weighted, provincial-averaged PM2.5 concentrations to estimate annual mean exposures for each province. Sensitivity analyses on linear RR functions and spatial resolution for exposure assessment are presented in online supplementary figure 11.
3. Results
3.1. Health-related air quality benefits
3.1.1. Air pollutant emissions
Power plants emit little PM2.5 directly. We hence present results on precursor pollutants of SO2 and NOx, that form secondary PM2.5 in the atmosphere. In CbR, air pollutant emissions only decline in the eastern importing provinces (6% and 11% reduction in SO2 and NOx emissions). In the energy-by-wire scenarios, eastern emissions decline more (15% and 16% reduction in SO2 and NOx emissions), while emissions increase in the exporting regions due to added coal power generation (figure 1(b) (SO2) and online supplementary figure 5 (NOx)). As renewable electricity generation has no emissions, Hybrid yields smaller increases in power exporting regions (4% and 3% increase in SO2 and NOx emissions) than CbW (10% and 8% increase in SO2 and NOx emissions). Total emission changes across all importing and exporting regions for Hybrid are a decrease of 6% and 9% for SO2 and NOx, respectively, as compared to a decrease of 3% and 7% in CbW.
3.1.2. Simulated PM2.5 levels
We compare our BASE simulation results with observations, and find that our simulations capture the day-to-day PM2.5 variation for four representative months in 2010 in Beijing (figure 2(b)) and other regions in East Asia (online supplementary figures 1–3). The BASE PM2.5 concentrations are generally higher in eastern and southwest China, and during autumn and winter (figure 2(a)), which are largely affected by seasonally varying meteorological conditions.
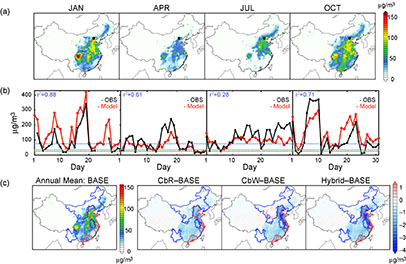
Figure 2 Distribution of BASE PM2.5 concentrations and reductions achieved in the energy transfer scenarios. (a) Simulated monthly mean surface PM2.5 in BASE for January, April, July, and October in year 2010. (b) A comparison of modeled (red) and observed (black) daily mean PM2.5 concentration in Beijing (black dots in figure 2(a)). The dashed lines show the 24 h averaged ambient PM2.5 standard in China (75 μg m−3, blue) and in the U.S. (35 μg m−3, green), as well as the WHO guideline (25 μg m−3, magenta). (c) Annual mean surface PM2.5 in BASE, and the reduction achieved in the energy transfer scenarios. The boundaries of electricity importing (red) and exporting (blue) provinces are highlighted.
Download figure:
Standard image High-resolution imageIn the eastern provinces—the ones targeted for pollution reduction—electricity transmission irrespective of fuel source results in a 2–3 μg m−3 (or 2%–7%) reduction in the annual mean PM2.5 concentrations, roughly 1 μg m−3 greater than the reduction achieved in CbR (figure 2(c)). Although switching from coal to hybrid power transmission does not further improve eastern air quality, adding zero-emission renewable capacity would avoid the PM2.5 increase in some northern exporting regions observed in CbW. Since downwind regions of the eastern importing provinces can also benefit from the air quality improvement there, even in CbW we find the PM2.5 levels in the exporting regions located in the northeast or surrounded by the importing regions are slightly lower than their BASE levels. We also find small PM2.5 reductions in southern and central China in all three scenarios, because these regions are downwind of the eastern provinces for the most time throughout the year (see online supplementary figures 6 and 7 for monthly PM2.5 results and wind fields). Such results are robust under meteorological conditions favorable for pollution formation and accumulation (see online supplementary figure 10). Since our BASE simulation does not show systematic biases, the general pattern of the PM2.5 reduction in each scenario and the ranking of the three scenarios should be robust.
3.1.3. Air-pollution-related deaths
We estimate the national total annual premature deaths associated with the exposure to outdoor PM2.5 to be 0.85 million in BASE (comparable to 0.86 million in GBD study [34]). Compared with BASE, Hybrid avoids 16% more premature mortalities nationally than CbW (∼16 000 and 14 000 cases, respectively). Most of the additional avoided deaths occur in the exporting regions, due to slightly lower PM2.5 concentrations there when more renewable generation is utilized for transmission. In comparison, the two coal-based scenarios yield similar scale of avoided deaths (only 6% higher for CbW than CbR) (figure 3(b)). Therefore, at the national level, CbW has modest additional health-related air quality benefits compared with CbR despite the fact that Chinese planners have focused on wiring coal precisely for its air pollution advantages. Instead, CbW shifts the geographical pattern of mortality impacts by avoiding more deaths in polluted eastern cities but fewer deaths in the rest of the country compared to CbR. Such results are largely driven by the concavity of the relative risk functions. While a small PM2.5 decrease in less polluted, southern regions results in nontrivial reduction in mortality risk and hence premature mortality, the flattening of RR functions is relevant at the BASE PM2.5 levels in many eastern provinces, leading to smaller mortality risk reductions there (figure 3(a)). Applying linear RR functions would increase the magnitudes of avoided deaths in the energy transfer scenarios and the differences across them (online supplementary figure 11).

Figure 3 Relative risk functions and reduction in air-pollution-related deaths. (a) Relative risk functions for four causes of air-pollution-related deaths at annual PM2.5 exposure levels of 0–80 μg m−3 (95% CI: the grey area; Data source: the GBD study [37]): ischemic heart disease (IHD), stroke, chronic obstructive pulmonary disease (COPD) and lung cancer (LC). The blue and green solid lines represent the average population-weighted BASE PM2.5 concentrations in the importing and exporting provinces, respectively. The brown and orange dashed lines indicate the annual mean PM2.5 standard in China (35 μg m−3) and the US (12 μg m−3). (b) Reduction in total air pollution-related deaths in the three energy transfer scenarios relative to BASE. The blue bars indicate the change in importing/eastern regions. For CbR, the light orange bar indicates the change in the rest of the country. For the Coal-by-wire (CbW) and Hybrid scenarios, we separate the change in the exporting provinces (green) and other non-importing and non-exporting regions (dark orange). The net decreases in CbR and CbW are largely because the newer coal power plants are cleaner than the ones being replaced. The small reduction in the exporting regions in CbW is because we present the net health impacts across all the exporting provinces that have increased or decreased PM2.5 levels relative to BASE. Error bars reflect the confidence intervals of the relative risk functions.
Download figure:
Standard image High-resolution imageBesides PM2.5, ground-level ozone is also associated with negative health impacts, but with a smaller mortality risk compared with exposure to PM2.5 [35, 36]. We find a small increase in eastern ozone concentrations in the three scenarios because lowered NOx emissions increase ozone concentrations due to non-linear chemistry. However, the mortality impacts associated with such a small change in ozone exposure is unlikely to be substantial (More details in online supplementary figures 4 and 8).
3.2. Carbon emissions
With zero-emitting renewable energy displacing coal power generation, a net annual reduction of roughly 340 million tons of CO2 emissions is obtained in Hybrid, equivalent to a 4% decrease in national total all-sector carbon emissions. By contrast, CbW and CbR have little effect on carbon emissions, as reductions only result from efficiency improvements in the new coal units relative to the displaced ones. The scale of the net reduction in CbR and CbW is nearly identical, as the same new coal power generation replaces old coal generation in both scenarios though in different locations (figure 4). Hybrid reduces carbon emissions three times more than either coal-based scenario, suggesting large global climate benefits of utilizing transmission lines to deliver a hybrid of renewable and coal power instead of coal power alone. The importance of the power mix in determining the carbon implications of electricity transmission has also been found in prior studies on carbon emissions embodied in inter-regional transmission in China [11]. Although our results do not consider transmission losses, the effect of transmission losses on carbon emissions are generally small as shown in our sensitivity analyses (online supplementary figure 9).

Figure 4 Change in annual total carbon emissions from electricity generation relative to BASE.
Download figure:
Standard image High-resolution image4. Discussion
Our evaluation of the air quality and climate benefits of the three energy transfer scenarios is subject to four main sources of uncertainty: transmission losses, meteorological variation, shape of the concentration-response relationships, and potentially a lower utilization rate of the transmission lines than we assumed in our Hybrid scenario. By conducting sensitivity analyses (section 5 in the online supplementary Materials), we find our main conclusion that Hybrid-by-wire results in greater air quality and climate benefits than coal-based options is still robust.
Here we discuss the cost-effectiveness of various energy-by-wire strategies by combining available cost data with the national total air quality and climate benefits evaluated in the previous section. We report the economic values in inflation-adjusted 2010US$.
a) CbW vs. CbR
When coal is the fuel choice, our analysis suggests similar climate benefits and only slightly larger health-related air quality benefits from CbW as compared to CbR at the national scale (6% greater reduction in national total premature deaths in CbW than CbR). On the cost side, CbR incurs coal transport costs, which lead to higher delivered coal prices for coal power generation in the eastern importing provinces than inland exporting provinces. As such, based on province-specific levelized cost of coal-fired electricity (online supplementary table 7), we find that the annualized coal power generation costs are US$4bn higher in CbR than CbW due to coal transport costs. The transmission cost to enable CbW, however, is difficult to estimate, due to limited existing cost data for transmission lines that use advanced ultra-high-voltage (UHV) technologies. Davidson et al estimated the UHV transmission cost to be 0.095 (low: 0.076, high: 0.126) RMB kWh−1 and 0.111 (low: 0.088, high: 0.147) RMB kWh−1 from Northeast or Northwest China to the Sanhua regions (the combination of Central, East and North China), respectively. Such estimates are also comparable with the current price for inter-regional transmission in China determined by the central government (roughly 0.12 RMB kWh−1) [38]. Therefore, we estimate the annual total transmission costs to be roughly US $6.7bn (low: $5.3bn, high, $8.9bn; more details in online supplementary table 8 and 9). This indicates that at present it may cost more to transmit coal power than to transport coal by rail followed by electricity generation. Our evaluation hence provides no evidence that the CbW strategy would be more cost-effective than CbR in curbing national total air pollution impacts or global climate impacts, although in the targeted eastern provinces, CbW indeed reduces air pollution and health impacts more than CbR. Since UHV transmission is a new and advanced technology, future UHV costs are likely to decrease as learning progresses, which will increase the competitiveness of the CbW strategy. Our results are consistent with previous findings that cost-effectivness is determined by a combination of the investment costs for new infrastructure and the quantity of energy transported [16].
b) Hybrid vs. CbW
To evaluate the relative cost-effectiveness of transmitting a hybrid of renewable plus coal power as compared to coal power alone, we estimate that in 2010 the total power generation cost in Hybrid to be US$11bn higher than CbW, due to higher generation costs for wind than coal (average levelized cost of electricity for wind and coal in exporting regions in 2010: US$72 MWh−1 and US$36 MWh−1, see online supplementary table 7). Here we neglect the potential costs to manage the transmission of variable wind power supply as compared to reliable coal power supply. It is likely that these costs have decreased since 2010, however.
On the benefit side, we find that Hybrid reduces 16% more air-pollution-related deaths (∼2000 cases) and three times more carbon emissions (∼260 million ton) than CbW. However, monetizing these air quality and climate benefits is controversial and is often based on the value of a statistical life (VSL, a measure of people's willingness to pay to reduce their mortality risk) and social cost of carbon (SCC, the marginal global societal cost of emitting an additional ton of carbon emissions), respectively. The VSL estimates vary substantially across countries, income groups, age groups [39], and implicitly involve some value judgment [40]. The SCC estimates range from $20 to higher than $200 ton−1 in the literature [41–45], and may still be underestimated due to the high social discount rate being applied [41] and the omission of other damages [42, 46]. Therefore, instead of choosing specific VSL or SCC values, we calculate the breakeven VSL to favor Hybrid over CbW, above which the monetized value of the additional air quality benefits in Hybrid can justify the more expensive costs for renewable generation. We also estimate the breakeven carbon price under a range of VSLs above which the monetized air quality and climate benefits would justify the higher renewable costs in Hybrid.
Considering only the air quality benefits, a VSL higher than US$5.0 m (confidence intervals due to RR functions: 3.5 m, 10.2 m) would favor Hybrid over CbW. Such breakeven VSL is more than twenty times higher than China's present-day VSL estimated from survey studies (low and high estmates $90 000 [47] and $250 000 [48]), or three times as high as the estimate obtained by adjusting the U.S. 2005 VSL with income elasticity (high estimate of $1.6 m for 2005 VSL in West et al 2013 [49]). Considering the climate benefits alone, we find a breakeven carbon price of $43 ton−1 to favor Hybrid (figure 5). Considering combined air quality and climate benefits, the breakeven carbon price would only be slightly lowered under VSL estimates based on surveys ($40–42 ton−1).

Figure 5 The breakeven carbon price that favors Hybrid over CbW on the basis of climate benefits alone (i.e. No VSL), or on the basis of the combined climate and air quality benefits with various present-day VSL estimates. The orange and blue markers are based on 2010 and 2014 wind power production costs, respectively. Error bars reflect 95% confidence intervals of the relative risk functions. The grey dashed lines show reference values of carbon emission, including the global SCC estimates for 2010 from the US government (2.5% and 5% discount rates) [43], the Chinese portion of global SCC based on Anthoff et al 2011 (0.1% and 1% discount rate) [45], as well as the average carbon price in China's seven cap-and-trade pilot programs [52]. Economic values are reported in 2010US$.
Download figure:
Standard image High-resolution image
To what degree do these benefits from using renewables accrue nationally? A full analysis should look not just at national air pollution benefits but also the benefits from lessening climate impacts that may occur domestically. That requires decomposing SCC into national and global impacts—a task not done much in the literature. However, Anthoff et al 2011 [45] found that 48% (or 31%) of total global climate damages will occur in China under a 0.1% (or 1%) discount rate. That suggests a global SCC of around $80 ton−1 (or $120 ton−1) would yield a Chinese portion of costs in the $40 ton−1 level that we find favor Hybrid. This range of global SCC is consistent with the values found in the extensive western literature on the global impacts of carbon emissions [41–45].
Therefore, based entirely on plausible national benefits—mainly improvements in public health and to a lesser degree lower impacts from climate change—the strategy of transmitting a hybrid mix of renewables and coal already appears to be the favorable fuel choice. The Hybrid strategy will likely become more attractive in the future with a decline in renewable technology costs and a growing economic valuation of the benefits. The drop in wind technology costs in China from 2010 to 2014 [50, 51] could already lower the wind LCOE in exporting regions by 6%, hence narrowing the cost difference between Hybrid and CbW and lowering the breakeven carbon price (figure 5). People's willingness-to-pay to reduce mortality risk (i.e. the VSL) may also increase with growing income level in the future, which consequently favors Hybrid.
5. Conclusion
We highlight three policy implications. First, coordinating transmission planning with renewable energy deployment is critical to maximize combined air quality and climate benefits from energy by wire strategies. In China for example, wind and solar resources are abundant in northern and western regions, while air pollution is severe in eastern population centers. Using electricity transmission to connect renewable production areas with highly populated and polluted regions can better exploit renewable resources in remote areas, integrate variable with dispatchable resources [55], reduce carbon emissions, and maximize air quality and health benefits [53]. As many countries also need to expand transmission to support a scale-up of renewable energy [5, 17], we suggest that grid planners, acting in the national interest, consider the air quality implications of transmission capacity investment in order to increase both potential health co-benefits and carbon mitigation efforts.
Second, we highlight that work of this type—which aims to quantify the national benefits of policies that could have global consequences—requires future improvements in calculating national and global benefits in economic terms. The integrated assessment method in this analysis provides a rigorous evaluation of the health-related air quality impacts and carbon emissions. However, monetizing the impacts currently rely on VSL estimates, which in emerging economies are particularly hard to pin down, as well as concepts such as the SCC, which co-mingles national and global benefits. More robust economic evaluations are needed for reliable cost benefit analyses [54].
Third, while we focus on air quality and climate impacts in this analysis, long-distance transmission may pose other local environmental impacts especially in the electricity exporting regions. For instance, relocating coal power generaion to arid western regions may exacerbate water scarcity and extensive development of hydropower may have major impacts on local ecosystem. We thus suggest that grid planners consider the overall impact of long-distance electricity transmission on the environment at regional, national and global scales.
Acknowledgments
We thank Eric Larson, Guangjian Liu, Michael Oppenheimer, Mark O'Malley, Fabian Wagner, Robert Williams and Tong Zhu for valuable discussions and the GIS support of Tsering W Shawa.