

Abstract
Climate change is occurring across the world, with effects varying by ecosystem and region but already occurring quickly in high-latitude and high-altitude regions. Biotic interactions are important in determining ecosystem response to such changes, but few studies have been long-term in nature, especially in the High Arctic. Mesic tundra plots on Svalbard, Norway, were subjected to grazing at two different intensities by captive Barnacle geese from 2003–2005, in a factorial design with warming by Open Top Chambers. Warming manipulations were continued through 2014, when we measured vegetation structure and composition as well as growth and reproduction of three dominant species in the mesic meadow. Significantly more dead vascular plant material was found in warmed compared to ambient plots, regardless of grazing history, but in contrast to many short-term experiments no difference in the amount of living material was found. This has strong implications for nutrient and carbon cycling and could feed back into community productivity. Dominant species showed increased flowering in warmed plots, especially in those plots where grazing had been applied. However, this added sexual reproduction did not translate to substantial shifts in vegetative cover. Forbs and rushes increased slightly in warmed plots regardless of grazing, while the dominant shrub, Salix polaris, generally declined with effects dependent on grazing, and the evergreen shrub Dryas octopetala declined with previous intensive grazing. There were no treatment effects on community diversity or evenness. Thus despite no changes in total live abundance, a typical short-term response to environmental conditions, we found pronounced changes in dead biomass indicating that tundra ecosystem processes respond to medium- to long-term changes in conditions caused by 12 seasons of summer warming. We suggest that while high arctic tundra plant communities are fairly resistant to current levels of climate warming, underlying ecosystem processes are beginning to change. In addition, even short bouts of intense herbivory can have long-term consequences for some species in these communities.
Export citation and abstract BibTeX RIS

Original content from this work may be used under the terms of the Creative Commons Attribution 3.0 licence. Any further distribution of this work must maintain attribution to the author(s) and the title of the work, journal citation and DOI.
Changes were made to this article on 31 January 2017. 'Elisabeth Cooper' was updated to 'Elisabeth J Cooper'.
Introduction
Climate change is undeniably occurring across the globe, with warmer temperatures and climate and weather disruptions in diverse ecosystems (IPCC 2013, 2014). In the Arctic and Subarctic, climate change has proceeded at a particularly breakneck pace (ACIA 2005). Changes in tundra vegetation patterns from North America to Europe and Russia have already been attributed to observed climate change (Chapin et al 1995, Molau 2010, Myers-Smith et al 2011, Elmendorf et al 2012b). However, climate warming is forecast to be even more extreme in the future. In order to predict the impacts of further global change, experiments have simulated these future conditions by warming the air and/or soil, increasing CO2 levels, altering nutrient fertilization, modifying precipitation, or manipulating snow cover and snowmelt timing (Elmendorf et al 2015, Wu et al 2011, Bobbink et al 2010, Cooper 2014). Changes in biodiversity at high latitudes are expected to have profound impacts on ecosystem functioning, processes, and services (Post et al 2009).
Early meta-analyses of climate change experiments in tundra ecosystems identified strong and immediate vegetative growth responses by vascular plants to warming, often at the expense of mosses and lichens (Walker et al 2006, Arft et al 1999). However, these patterns have not necessarily been sustained in longer-term studies. Meta-analyses have found that the initial increase in vascular plant biomass after 2–3 years of warming is not typically sustained over longer time scales (Elmendorf et al 2012a), and individual studies have even shown differences in short- and long-term responses to Open Top Chamber (OTC) warming by communities and species (Hollister et al 2005, Alatalo and Little 2014). These mismatches in short- and longer-term patterns may indicate that fundamental ecosystem processes themselves change as warming continues.
The High Arctic is less frequently studied than low arctic and subarctic tundra. Some short- and medium-term temperature manipulations in the High Arctic have resulted in significant changes to community structure and community and species biomass (Robinson et al 1998, Buizer et al 2012), but other medium- and long-term studies have found that high arctic communities are actually fairly stable in response to warming (Post and Pedersen 2008, Hudson and Henry 2010). Of the few longer-term study sites in the High Arctic (at Alexandra Fiord in Canada, Zackenberg in northeast Greenland, and the Pituffik Peninsula in northwest Greenland), some have found resistance to change in aboveground (Hudson and Henry 2010) and belowground (Lamb et al 2011) communities. Others have found either varying responses by site (CO2 exchange: Welker et al 2004) or species (growth rate: Campioli et al 2013). While community composition as estimated by functional group abundance has not always changed with long-term warming, other measures such as leaf size and plant height (Hudson et al 2011), sexual reproduction (Klady et al 2011), and diversity and stability (Post 2013) have shifted in response to a decade or more of warming.
Furthermore, biotic interactions are key in determining how communities and ecosystems respond to climate change. Grazing impacts arctic plants at the individual level through mechanisms such as compensatory growth (McIntire and Hik 2002, Cooper et al 2006), and can influence arctic ecosystem functioning by reducing litter input and shifting carbon and nutrient cycles (Sjögersten et al 2012). Effects of grazing on community dynamics and diversity may also be long-lasting through a reduction in the seed bank (Kuijper et al 2006, Cooper 2006). Furthermore, studies in the Low Arctic have shown that while increasing grazing pressure can have strong immediate effects on vegetation communities, cessation of grazing does not return communities to their pre-grazing state (for example, Olofsson 2006). This is of particular concern as climate change and land-use change are leading to greater populations of large herbivorous birds using the High Arctic as summer breeding grounds (Van Eerden et al 2005) and grazing on aboveground and belowground plant parts (Kuijper et al 2006, Pedersen et al 2013, van der Wal et al 2007). Overgrazing has led to catastrophic shifts in community composition in both the Low Arctic (Jefferies et al 2006) and High Arctic (Henry and Gunn 1991).
While many summer climate-manipulation studies have been performed on Spitsbergen, Svalbard, located at 78°N, to date the longest site-specific data sets published have been after five to seven years of warming (Bjerke et al 2003, Weijers et al 2012, Robinson et al 1998). Here, we analyzed the effects of nine seasons of experimental warming applied after an initial three-year factorial grazing and warming experiment, for a total of 12 growing seasons of warming on replicated plots within a mesic meadow community in the valley of Adventdalen, Spitsbergen. We hypothesized finding
- A greater amount of plant material, as estimated by point-frame abundance, in Open Top Chamberss than in ambient plots, as has often been found in short-term temperature manipulations in the tundra, with no remaining legacy of the original grazing manipulations;
- shifts in the patterns of functional group composition and a decrease in community diversity as a response to both warming and to previous grazing;
- increases in sexual reproduction and plant size of the community's dominant species in response to OTC warming, with no lasting effects of the previous grazing manipulations.
Methods
Study site and treatments
The study site is located in the Advent Valley of Spitsbergen (Adventdalen, 78.19°N, 15.93°E), about 15 km from the town of Longyearbyen. Plots were located in a mesic tundra vegetation community in a wide valley below the Foxfønna glacier, dominated by Salix polaris, Bistorta vivipara, and Alopecurus magellanicus, and with a thick moss and lichen layer. Thirty 2 m × 2 m plots were laid out in five blocks early summer 2003, and randomly assigned to treatments. Half of the plots in each block were passively warmed by plexiglass Open-Top Chambers (OTCs) which allowed sunlight to pass into the plots unhindered (for details of OTC methods, see appendix I). OTCs accomplished a 1.2°C of mean warming of surface temperatures in July in the first summer (Cooper et al 2004). OTCs have been maintained on the site continuously every summer since their initial implementation in 2003, and removed each autumn. Within each block, plots were also randomly distributed between three levels of a grazing treatment by captive Barnacle Geese in 2003–2005: no grazing (UG), intermediate (low) grazing (LG), and high grazing, (HG). Specific treatments and their relationship to grazing pressure are described in Cooper et al (2006). Grazing manipulations were discontinued after 2005.
Measurements
In the summer of 2014, community composition was recorded at each plot using a 0.75 m × 0.75 m point-frame with 100 evenly-spaced grid points. Each piece of living material at a gridpoint was tallied to the species level (as described in Shaver et al 2001), according to the Pan Arctic Flora for vascular plants (Elven et al 2011), Krypto-S (Swedish Museum of Natural History 2013) for mosses, and the Pan Arctic Checklist (Kristinsson et al 2010) for lichens. In some cases, lichens could only be identified to the genus level. Dead material, black crust, or bare substrate (i.e. rock) were also possible 'hits'. At each gridpoint, the height of the vascular plant canopy layer was measured. The measurements from all points where vascular plants were present were averaged to produce a per-plot vascular plant canopy height. Further description of the point-framing method can be found in appendix I.
Additional measurements were taken on the dominant vascular plants at each site. Plants were sampled in a systematic fashion starting from a specific gridpoint and proceeding to the right. The dominant grass species was Alopecurus magellanicus, and for each of five plants we measured the length of the longest leaf and the height of the flowering stalk. We also counted the total number of flowering stalks in the plot. For the dominant shrub Salix polaris and the dominant forb Bistorta vivipara, we measured leaf size (length and width, and calculated the resulting rectangular area) for five leaves per plot, as well as counting the total number of flowers budding, open or senescing in the plot.
Data analyses
All analyses were performed using R statistical software version 3.1.13 (R Core Team 2015). Point-frame data were used to calculate Shannon diversity index (diversity within each plot), Pielou's evenness index, and beta diversity (diversity between plots) using the R package 'vegan' (Oksanen et al 2012). Beta diversity was calculated using multivariate dispersion to calculate distance between samples within each treatment, and identify a centroid (spatial median) for each treatment. The response variable per plot was the distance from the plot to its centroid.
Data were analyzed using mixed-effects models in the 'lme4' package version 1.1-7 (Bates et al 2012), with experimental block as a random factor and grazing and warming as a fixed factors. Model selection was performed in a backwards stepwise manner using second-order AIC (Akaike Information Criterion) scores or 'AICc' (Mazerolle 2013), which slightly modify the AIC to adjust for small sample sizes and prevent overfitting of the model, and marginal r2 (Barton 2013). When the interaction between fixed factors were included in the model, differences between treatments were compared using pairwise tests in the 'multcomp' package (Hothorn et al 2008). All response variables were assessed for normality and homogeneity of variance of the residuals using standard diagnostic procedures. Count data were analyzed using generalized linear mixed-effects models with a Poisson distribution. A few other variables were analyzed using binomial distributions of either total abundance or total grid points. Diversity, density, and size measurements were analyzed using linear models; when no interactions were included but one or both fixed factors were, the significance of individual parameters were assessed using the Satterthwaite approximation in the package 'lmerTest' (Kuznetsova et al 2015). Possible effects of sampling date on floral density were assessed in the same fashion using generalized linear mixed-effects models with a Poisson distribution and sampling date as an additional factor.
Results
The best models for total live plant abundance (i.e. vascular and moss and lichen), total vascular plant litter, and canopy height all included interactions between Open Top Chamber warming and previous grazing treatment (see table 1 for all model selection results). However, for total live abundance (figure 1(a)) and canopy height (figure 1(c)) there were no significant differences between treatment types when tested with multiple comparisons (all p > 0.05). The 12 seasons of summer warming significantly increased the abundance of vascular plant litter compared to the ambient treatment, and litter in ambient plots increased with the previous low grazing treatment but decreased with high grazing (figure 1(b)).
Table 1. AICc scores for different generalized mixed-effects models (Fact = factorial warming x grazing; Add = additive warming + grazing; Warm = OTC only; Graz = goose grazing only; Rand = random-effects only) for each of the response variables. The AICc score of the 'best' model is indicated by bold type; its effects are described using marginal R2, the proportion of variance explained by the fixed factors alone. If a random-effects model was the 'best' model, then no R2 is reported.
| A. Variables with generalized linear mixed-effects models | ||||||
|---|---|---|---|---|---|---|
| Response variable | Fact | Add | Warm | Graz | Rand | Marginal R2 |
| Total live abundance | 361.85 | 362.44 | 0.06 | |||
| Total litter abundance | 364.90 | 367.15 | 0.21 | |||
| Species richness | 173.07 | 166.89 | 161.34 | 165.04 | 159.91 | 0.04 |
| Total live forb abundance | 210.20 | 216.43 | 0.21 | |||
| Total live grass abundance | 397.85 | 392.43 | 386.89 | 389.74 | 384.62 | |
| Total live rush abundance | 182.07 | 176.11 | 171.92 | 178.00 | 174.22 | 0.04 |
| Total moss abundance | 281.30 | 276.35 | 272.80 | 273.88 | 270.74 | |
| Total lichen cover | 165.62 | 161.13 | 157.19 | 159.22 | 155.71 | |
| D. octopetala live abundance | 128.88 | 142.75 | 0.25 | |||
| Salix polaris live abundance | 582.78 | 618.23 | 0.15 | |||
| S. polaris dead abundance | 268.30 | 271.63 | 0.04 | |||
| S. polaris female flowers | 753.67 | 829.19 | 0.18 | |||
| S. polaris male flowers | 395.54 | 497.41 | 0.23 | |||
| Bistorta vivipara live abundance | 214.15 | 216.55 | 0.11 | |||
| B. vivipara dead abundance | 100.12 | 94.18 | 93.10 | 95.11 | 94.44 | 0.03 |
| B. vivipara flowers | 635.22 | 748.25 | 0.31 | |||
| Alopecurus magellanicus live abundance | 366.11 | 367.47 | 0.05 | |||
| A. magellanicus dead abundance | 206.80 | 208.19 | 0.02 | |||
| A. magellanicus flowering stalks | 383.88 | 420.69 | 0.14 | |||
| B. Variables with linear mixed-effects models | ||||||
| Response variable | Fact | Add | Warm | Graz | Rand | Marginal R2 |
| Vascular plant canopy height | 171.25 | 172.62 | 0.10 | |||
| Shannon's diversity index | 30.58 | 20.34 | 8.55 | 15.59 | 4.32 | |
| Pielou's evenness | −105.63 | −126.48 | −148.11 | −137.98 | −159.13 | |
| Beta diversity | −2.48 | −15.26 | −29.36 | −23.08 | −36.76 | |
| S. polaris leaf length | −5.67 | −16.97 | −27.90 | −23.54 | −34.00 | |
| S. polaris leaf width | −7.53 | −16.89 | −28.02 | −24.67 | −35.26 | |
| S. polaris leaf area | 1.15 | −8.36 | −19.15 | −15.18 | −25.67 | |
| B. vivipara leaf length | 44.22 | 43.55 | 41.25 | 38.03 | 36.45 | |
| B. vivipara leaf width | −5.25 | −13.10 | −23.92 | −21.02 | −31.29 | |
| B. vivipara leaf area | 31.33 | 29.35 | 26.08 | 23.15 | 20.62 | |
| A. magellanicus leaf length | 103.25 | 99.44 | 97.07 | 95.98 | 94.16 | |
| A. magellanicus stalk height | 107.62 | 106.88 | 103.68 | 109.05 | 106.53 | 0.08 |
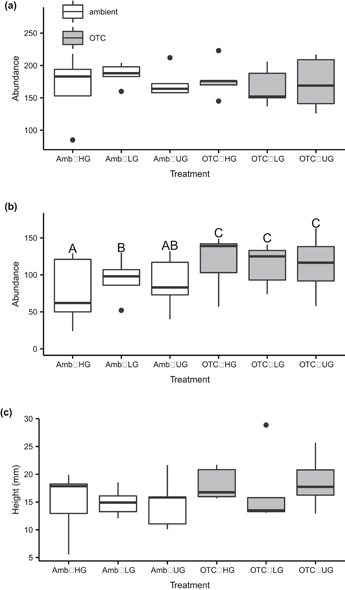
Figure 1 Adventdalen total (a) live (vascular, moss and lichen) and (b) dead plant abundance in 2014 after 12 growing seasons of warming by OTCs and nine years after the cessation of grazing treatments, as measured by point frame hits; and (c) the height of vascular plant canopy where present. Amb = ambient temperature, OTC = warmed plots; HG = high grazing, LG = low grazing, UG = ungrazed. Error bars represent standard error of the mean. Bars not sharing a common letter indicate significant differences between treatments, as measured across the whole timespan of the experiment (linear comparisons, p < 0.05).
Download figure:
Standard image High-resolution imageThe meadow had a total of 35 vascular plant, bryophyte, and lichen species (species lists with live abundance, appendix II; dead abundance, appendix III). Neither OTC warming nor grazing were included in the best models for species richness, diversity, or evenness. The community was dominated by the deciduous shrub S. polaris, which made up 23.7 percent of total live abundance across all plots.
The functional group composition of the mesic meadow shifted in response to the simulated warming and historical grazing (figure 2(a)), but only for some groups. Live abundance of grasses, lichens, and mosses did not differ by treatment, averaging 18.3 (grass), 2.3 (lichen), and 46.3 (moss) percent of all live point-frame hits across the entire experiment. Dryas octopetala, the only evergreen shrub found in the plots, made up less than one percent of total abundance and was affected differently by grazing in warmed and ambient plots (figure 2(b)), with any grazing treatment in ambient plots suppressing abundance but moderate grazing promoting it in warmed plots. Forbs (figure 2(c)) made up 5.9 percent of all live point-frame hits and also showed different responses according to the interaction of manipulations, with any level of grazing decreasing abundance in ambient plots but promoting it in warmed plots. Rushes made up on average less than one percent of live abundance in the plots, and was significantly higher in warmed than ambient plots (glmm, z = 2.18, p = 0.03) regardless of grazing treatment (figure 2(d)).
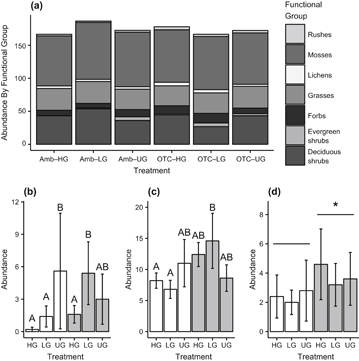
Figure 2 (a) Average number of point frame hits made up by different plant functional groups in plots with warming and historical grazing treatments. Abundance, as estimated by point-frame hits, differed significantly by treatment for the (b) evergreen shrub, (c) forb, and (d) rush functional groups. Amb = ambient temperature, OTC = warmed plots; HG = high grazing, LG = low grazing, UG = ungrazed. Error bars represent standard error of the mean. Bars not sharing a common letter indicate significant differences between treatments, as measured across the whole timespan of the experiment (linear comparisons, p < 0.05).
Download figure:
Standard image High-resolution imageThe dominant species, the deciduous shrub Salix polaris, showed a significant interaction in live abundance between warmed and grazed plots. In ambient plots the low grazing treatment increased S. polaris live abundance, whereas in warmed plots this treatment decreased live abundance (figure 3(a)). Patterns of S. polaris litter accumulation were different than those of live abundance, with generally more litter in plots that had been warmed, and generally less litter in plots which had been intensively grazed in the past (figure 3(b)). Grazing drove differences in the number of female flowers but there was a less consistent pattern with temperature (figure 3(c)); while there were higher female floral abundances in warmed plots across all grazing treatments, this was most pronounced in the ungrazed plots. Likewise, there were more male S. polaris flowers in warmed compared to ambient plots, however warming appeared to suppress male floral abundance in grazed plots (figure 3(d)). Plots surveyed later in the season tended to have more S. polaris flowers and/or fruits, with more flowers appearing slightly earlier in warmed compared to ambient plots (figure 3(e)). The size of S. polaris leaves, meanwhile, were unaffected by either warming or grazing (figure 3(f)).

Figure 3 Responses of the deciduous shrub Salix polaris, the dominant shrub in the mesic tundra, to 12 growing seasons of warming and to prior grazing at Adventdalen as observed in live (a) and dead (b) abundance as measured by point-frame hits; the density of female (c) and male (d) flowers per square meter; phenology of flowering in warmed and ambient plots (e); and leaf length (f, left side of split bars, colored as in figure 1 and width (f, right side of split bars, darker gray colors). Amb = ambient temperature, OTC = warmed plots; HG = high grazing, LG = low grazing, UG = ungrazed. Error bars represent standard error of the mean. Bars not sharing a common letter indicate significant differences between treatments, as measured across the whole timespan of the experiment (linear comparisons, p < 0.05).
Download figure:
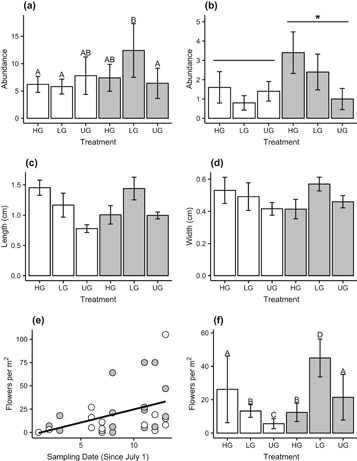
Standard image High-resolution imageThe dominant grass, A. magellanicus, was unaffected by OTCs in terms of live abundance (figure 4(a)), while dead abundance was slightly higher in warmed than ambient plots and higher in highly grazed than ungrazed plots (figure 4(b)). The length of the longest leaves of A. magellanicus was not affected by treatments (figure 4(c)), however reproductive stalks were taller in warmed than ambient plots (linear mixed-effects model [lmm], F1, 17.165 = 5.1464, p = 0.04; figure 4(d)). There was little evidence that sampling date affected the number of reproductive structures present, either separately or in an interaction with other factors (Δ AICc was −0.88 after dropping date as a factor). However, both warming and previous grazing treatment had significant, interactive effects on the number of flowering A. magellanicus stalks found in plots, with generally more flowering stalks in warmed plots and also more flowering stalks in plots with prior Barnacle goose grazing (figure 4(e)).

Figure 4 Responses of the grass Alopecurus magellanicus to 12 growing seasons of warming and to prior grazing at Adventdalen as observed in live (a) and dead (b) abundance as measured by point frame hits; length of longest leaf (c) and flowering stalk (d) of a subset of A. magellanicus plants in each plot; and the density of flowering stalks per square meter (e). Amb = ambient temperature, OTC = warmed plots; HG = high grazing, LG = low grazing, UG = ungrazed. Error bars represent standard error of the mean. Bars not sharing a common letter indicate significant differences between treatments, as measured across the whole timespan of the experiment (linear comparisons, p < 0.05).
Download figure:
Standard image High-resolution imageThe dominant forb B. vivipara had differing live abundance by treatment type, with prior grazing generally promoting abundance in warmed plots but reducing it in ambient plots (figure 5(a)), and significantly higher dead abundance in the OTC plots than in ambient plots (glmm, z = 1.94, p = 0.05; figure 5(b)). Leaf length (figure 5(c)), width (figure 5(d)) and area (table 1) did not differ with either grazing or warming treatments. The number of B. vivipara flowers counted in plots significantly increased as with later sampling dates (correlation test, r2 = 0.40, p = 0.02), but this apparent phenological pattern was not affected by warming (Δ AICc was −3.07 after dropping the date by treatment interaction from the model; figure 5(e)). However, the number of flowers was higher in warmed than ambient plots, except for plots which had been subject to the high grazing treatment, where this pattern was reversed (figure 5(f)).
Figure 5 Responses of the forb Bistorta vivipara to 12 growing seasons of warming and to prior grazing at Adventdalen as observed in live (a) and dead (b) abundance as measured by point frame hits; length (c) and width (d) of the longest leaf of a subset of B. vivipara plants in each plot; the phenology of flowering as observed in the plots (e); and the density of flowering stalks per square meter in different treatments (f). Amb = ambient temperature, OTC = warmed plots; HG = high grazing, LG = low grazing, UG = ungrazed. Error bars represent standard error of the mean. Bars not sharing a common letter indicate significant differences between treatments, as measured across the whole timespan of the experiment (linear comparisons, p < 0.05).
Download figure:
Standard image High-resolution image
Discussion
OTC effects on live and dead plant abundance
Surprisingly and contrary to our hypothesis, total live vascular plant, bryophyte, and lichen abundance in warmed plots did not differ significantly from ambient plots. This may be attributed to harsh environmental limitations in the High Arctic: temperature, nutrients, and moisture. The Svalbard permafrost keeps soil temperatures cooler than in the Low Arctic and contributes to determining plant community composition (Brooker and Van Der Wal 2003). Warming soil temperature, for example through increased insulative snow depth, has been shown to have a positive effect on aboveground productivity in the High Arctic, while merely warming summer air temperature may not (Natali et al 2012). Thus Open Top Chambers placed only during the growing season, as in this experiment, do not necessarily release plants from the cold soil temperatures to the extent that winter warming might. Other environmental limitations include the comparatively nutrient-poor substrate in the High Arctic. Nitrogen and phosphorus are co-limiting and many responses depend on increasing phosphorus supply (Gordon et al 2002, Robinson et al 1998). Lack of additional fertilization may have limited our plant community's response to warming. Finally, soil moisture is also frequently a limiting factor in the Arctic (Elmendorf et al 2012a), and OTC warming dries soils (Bokhorst et al 2013).
Despite few changes in live plant abundance, we found that the amount of dead vascular plant material increased significantly, sometimes by a factor of three or more, in the OTC plots. This pattern is common in many previous experiments (Wahren et al 2005, Klein et al 2004, Oberbauer et al 2007, Elmendorf et al 2012a), but not all (Post and Pedersen 2008). Previous grazing history had no effect on live abundance in the plots, even though initial data from this study shows that the goose grazing had reduced graminoid leaf length (Cooper et al 2006). A long-term herbivore exclosure experiment elsewhere on Svalbard also shows that biomass is greatly reduced with grazing, however the complete exclosure of herbivores in the latter study allowed tundra vegetation to fully recover from the effects of grazing (Sjögersten et al 2011). Thus the primary driver of this accumulation of dead plant material seems to be temperature, rather than grazing history.
Some litter appeared new, as if it was from the previous growing season, but it was not possible to age the litter and determine when the increased buildup began (i.e. early or late in the warming experiment). In low arctic sites vascular plant material decays about 30–60% over two-three years (Hobbie and Gough 2004, Cornelissen et al 2007), while in a polar desert on Svalbard shrub litter decomposed 15%–40% in the first 15 months (Robinson et al 1995). This suggests that litter detected in the plots is likely from recent growing seasons. In fact, in 2013, summer precipitation was three times higher than the average of the previous five years (Abbandonato 2014). This likely released the plants from moisture stress, allowing a strong short-term growth and biomass response to the OTC treatment within a single season and separate from the long-term effects; the resulting biomass would produce more litter for the following season (2014, when we measured the plots). This does not preclude additional long-term mechanisms which could increase litter deposition, but it is important to note that high-precipitation years may become more frequent on Svalbard due to the predicted increase in precipitation due to sea ice melting (Kopec et al 2015) as well as the increasing variability of climate and extreme climate events (IPCC 2014).
The buildup of a thicker litter layer may eventually become a limitation for growth and decomposition by shading prostrate leaves and cooling the soil. More likely, however, is that as has been shown in Greenland (Blok et al 2016), decomposition rates are slowed by the warming and soil drying which is typical in OTCs (Robinson et al 1995). Additionally, a substantial portion of litter in our study came from the increase in dead shrub material, which is typically the most recalcitrant type of vascular plant litter (Myers-Smith et al 2011). Because warming of a greater magnitude can increase the speed of decomposition (Hobbie 1996), this may be a medium-term transient response as climate change accelerates. While the increase in dead plant material could have been aided by the OTC structures themselves, which reduce movement of litter between plots, the removal of the OTCs during the winter season should have minimized this effect.
The increase in litter has major implications for ecosystem functioning, as decomposition of dead material is the main source for carbon and nitrogen cycling. However, since much of the additional litter was comparatively recalcitrant shrub material this effect may be muted (Blok et al 2016). Previous research also suggests that arctic leaf litter has lower nitrogen and phosphorus content due to high nutrient resorption efficiencies during leaf senescence (Aerts et al 2012). Future studies should explicitly include measures of bioavailable nutrient stores in the soil at long-term OTC sites, in parallel with monitoring litter accumulation.
OTC effects on functional group abundance and diversity
As hypothesized, we found some shifts in functional group abundance, although these changes were more subtle than expected. Evergreen shrub abundance (D. octopetala) was similar in ambient and OTC plots after 12 growing seasons of warming, while deciduous shrub abundance (S. polaris) was lower in warmed plots. Because evergreen shrubs in particular are as limited by soil moisture as they are by summer air temperature (Elmendorf et al 2012a), soil drying by the OTCs could explain this pattern. More broadly, greening has been widely detected experimentally as well as by remote sensing across the Low Arctic (Myers-Smith et al 2011) and occasionally in the High Arctic (for example, Hudson and Henry 2009), but meta-analyses of OTC experiments across biomes indicate that the High Arctic is more resistant to shrub expansion (Elmendorf et al 2012a). This may be because high arctic shrubs are dwarf forms rather than the taller forms which respond more positively to experimental warming (Elmendorf et al 2012a). Our results suggest that the ecosystem services and regulation currently provided by dwarf shrubs (Myers-Smith et al 2011) may remain relatively unchanged in the High Arctic.
However, shrub abundance did differ with previous grazing manipulation. The evergreen shrub D. octopetala was less abundant in highly grazed plots than in ungrazed plots in both ambient and OTC treatments, even nine years after the cessation of goose grazing. Meanwhile, live S. polaris declined in the low-intensity grazing treatment, but only in warmed plots. While geese seldom graze on these species, other associated effects such as trampling could have caused long-term declines which would have consequences for ecosystem services and community structure. Conversely, even though graminoids are a common food item for some geese on Svalbard (Fox et al 2006), grasses showed no difference in abundance by treatment, most likely due to compensatory growth (Cooper et al 2006).
Rushes had higher abundance in warmed plots, regardless of grazing. In fact, the only functional groups which showed higher abundance in the warmed plots were forbs and rushes, each of which only made up a modest amount of the total live abundance in the community. In many systems, an increase in vascular plant abundance excludes mosses and lichens by shading and litter deposition (i.e. Chapin et al 1995), although other mosses such as Sphagnum species are photoinhibited and may benefit from shading (Zona et al 2011). Interestingly, the increase in forb and rush abundance was not coupled with any change in lichen or moss abundance, much less the decline found in the Low Arctic by Cornelissen et al (2001). Instead the canopy remained relatively open, with ∼15%–20% of the area of the plots still lacking a canopy layer after 12 seasons of warming. Canopy cover and height were also unaffected by the previous grazing treatment.
Contrary to our predictions, we found no difference in diversity between warmed and ambient plots or between different grazing treatments, as measured by α-diversity (Shannon's index), β-diversity, and community evenness (Pielou's index). All the species in the mesic meadow are extremely long-lived (i.e. Parsons et al 1994, Eriksson and Froberg 1996); barring a mortality event, substantial recruitment of new species may take even longer than a decade or two. Environmental factors are also different in the Adventdalen mesic meadow compared to low arctic and subarctic sites, where long-term declines in diversity have previously been documented primarily at wet sites (Elmendorf et al 2012a).
OTC effects on reproduction and plant size
We hypothesized that OTC warming would have a generally positive effect on dominant species in the tundra communities, but results showed much more variable and nuanced responses. Twelve seasons of warming caused a small but significant decrease in the live abundance of the dominant shrub S. polaris, a weak but significant increase the live abundance of the dominant forb B. vivipara, and no effect on the live abundance of the dominant grass A. magellanicus. Grazing history had a nuanced effect on S. polaris abundance (discussed earlier), no effect on abundance of A. magellanicus, and led to an increase in B. vivipara abundance only in the warmed, low-intensity grazing treatment. Neither warming nor grazing had any effect on leaf size in any of the three focal species.
Grazing history generally promoted flowering, and to a greater extent in warmed than ambient-temperature plots. All three species produced more abundant flowers in the OTC plots, and in A. magellanicus flowering stalks were taller in OTC than in ambient plots even though there was no difference in the height of vegetative leaves. Increases in reproduction in response to warming in the High Arctic have been found previously in several species (Wookey et al 1995, Wada and Kanda 2000, Buizer et al 2012, Klady et al 2011), theorized to be due to the abiotic limitations which may continue to constrain vegetative growth even as conditions are ameliorated by warmer temperatures. Plants in the High Arctic have evolved to prioritize reproduction under favorable conditions. Many vascular plants, including B. vivipara and S. polaris, pre-form embryonic flower buds which do not open until the next, or several more, growing seasons. In fact, sexual reproduction is quite unsuccessful in B. vivipara, which reproduces primarily by bulbils (Diggle et al 1998). Alopecurus magellanicus reproduces both sexually and vegetatively, as does S. polaris (Brochmann and Steen 1999).
One major question is whether investing in reproductive effort as the climate warms will have long-term costs: will increasing flowering and fruit production for several consecutive favorable seasons take a toll? Classic theory as well as recent experimental work suggests that reproduction sustains costs to future fecundity, vegetative growth and survival (Alvarez-Cansino et al 2010, Bell 1980), although compensatory mechanisms have also been demonstrated. In a climate change context, recent evidence shows that as growing seasons become warmer and longer, the survival costs of increasing reproduction shrink over three to five years of manipulating the level of reproduction (Sletvold and Ågren 2015). Thus even if sexual reproduction is not the main mode of propagation in these plants, the increase in flowering may become a less costly way to supplement total reproduction as the climate warms. Increased sexual reproduction will also provide plant populations with more possibilities for evolutionary adaptation to changing environmental conditions (Hedhly et al 2009). Increasing sexual reproduction in species which have multiple reproductive modes at their disposal is a particularly interesting potential eco-evolutionary feedback which should be further explored.
Conclusion
After 12 growing seasons of summer warming, we found a small but significant decrease in the abundance of the dominant shrub Salix polaris and small but significant increases in forbs and rushes. This indicated some shift in community composition, but of a magnitude much smaller than in the Low Arctic where shrubs can greatly expand in response to warming. Plant community composition and abundance was only sometimes affected by a previous grazing treatment which had been discontinued nine growing seasons prior. While the high arctic tundra was relatively resistant to changes in vegetation abundance patterns, we found indications of major shifts in underlying ecosystem processes. A substantial increase in dead vascular plant material suggests that aboveground production increased—possibly faster than decomposition. Impacts of climate warming on tundra nutrient cycling have been undetectable in short-term experiments, but these results suggest that after a decade or more of warming, changes in productivity, litter accumulation, and decomposition rates may begin to have substantial impacts on ecosystem functioning. Further studies should include explicit measures of nutrient availability at long-term warmed sites to confirm whether carbon, nitrogen, and phosphorus cycling are indeed changing. Furthermore, we found that dominant species showed increased sexual reproduction in warmed plots, and particularly in plots which had previously been subject to increased grazing.
Data Accessibility
Data available from the Dryad Digital Repository: https://doi.org/10.5061/dryad.2m1k2.
Acknowledgments
This study was a continuation of a field experiment originally funded by the European Commission Directorate-General for Research, contract no: EVK2-2001-00235; in 2005 EJC took over responsibility for the study site, with funding from UNIS and the University of Tromsø. CJL would like to thank the Svalbard Scientific Foundation for an NFR Arctic Field Grant, the University Centre in Svalbard for logistical support, and Timothée Bonnet and Florian Altermatt for helpful comments while drafting the manuscript.