


Abstract
Approximately 95% of households in Mozambique burn solid fuels for cooking, contributing to elevated indoor and outdoor fine particulate matter (PM2.5) concentrations and subsequent health and climate impacts. Little is known about the potential health and climate benefits of various approaches for expanding the use of cleaner stoves and fuels in Mozambique. We use state-of-the-science methods to provide a first-order estimation of potential air pollution-related health and climate benefits of four illustrative scenarios in which traditional cooking fires and stoves are displaced by cleaner and more efficient technologies. For rural areas, we find that a 10% increase in the number of households using forced draft wood-burning stoves could achieve >2.5 times more health benefits from reduced PM2.5 exposure (200 avoided premature deaths and 14 000 avoided disability adjusted life years, DALYs, over a three-year project lifetime) compared to natural draft stoves in the same households, assuming 70% of households use the new technology for both cases. Expanding use of LPG stoves to 10% of households in five major cities is estimated to avoid 160 premature deaths and 11 000 DALYs from reduced PM2.5 exposure for a three-year intervention, assuming 60% of households use the new stove. Advanced charcoal stoves would achieve ∽80% of the PM2.5-related health benefits of LPG stoves. Approximately 2%–5% additional health benefits would result from reduced ambient PM2.5, depending on the scenario. Although climate impacts are uncertain, we estimate that all scenarios would reduce expected climate change-related temperature increases from continued solid fuel use by 4%–6% over the next century. All results are based on an assumed adjustment factor of 0.8 to convert from laboratory-based emission reduction measurements to exposure reductions, which could be optimistic in reality given potential for continued use of the traditional stove. We conclude that cleaner cooking stoves in Mozambique can achieve health and climate benefits, though both are uncertain and local information about baseline and intervention PM2.5 exposure levels are needed.
Export citation and abstract BibTeX RIS

Original content from this work may be used under the terms of the Creative Commons Attribution 3.0 licence. Any further distribution of this work must maintain attribution to the author(s) and the title of the work, journal citation and DOI.
1. Introduction
Household air pollution (HAP) impacts public health (e.g. Smith et al 2014, WHO 2014) and climate change (e.g. Bond et al 2013, Lacey and Henze 2015). HAP is a mixture of air pollutants emitted from inefficient fuel combustion, including fine particulate matter (PM2.5), carbon monoxide, nitrogen oxides, and others. PM2.5 is itself a mixture of components, including black carbon (BC), organic carbon (OC), nitrate, and sulfate. Approximately 95% of the population in Mozambique use solid fuels for cooking (Bonjour et al 2013), with wood typically used in rural areas and charcoal in urban areas (van der Plas et al 2012). The resulting HAP is estimated to be responsible for approximately 18 000 premature deaths and 696 000 disability-adjusted life years (DALYs) in Mozambique in 2015 (IHME 2016, Forouzanfar et al 2016). HAP is a major contributor to ambient PM2.5 in Sub-Saharan Africa, contributing approximately 14 000 ambient PM2.5-related premature deaths across the region in 2013 (Chafe et al 2014, Smith et al 2014). Ambient PM2.5 was also associated with 7 000 premature deaths and 235 000 DALYs in Mozambique in 2015 (IHME 2016, Forouzanfar et al 2016).
Household solid fuel combustion also contributes to climate change by emitting carbon dioxide (CO2), methane (CH4) and other ozone producing gases, black carbon (BC) and brown carbon (Anenberg et al 2013). Although the net climate impacts from aerosols emitted from this sector are uncertain, when long-lived greenhouse gases are accounted for, the long-term climate effect is strongly warming (Bond et al 2013, Lacey et al 2017). Controlling CH4 and BC along with long-lived greenhouse gases can increase the chances of limiting global temperature rise to below 2 °C (UNEP/WMO 2011, Shindell et al 2012). Cleaner fuels and more efficient solid fuel cookstove technologies can avoid near- and long-term temperature increases from climate change and improve public health by reducing household and ambient air pollution exposures (Anenberg et al 2013, UNEP/WMO 2011, Shindell et al 2012).
A small but growing body of literature addresses the multiple societal benefits of different approaches for reducing HAP. Several studies estimate benefits of reducing emissions from solid fuel cookstoves, ranging from global to national scales, and considering one or several societal benefits (e.g. Mehta and Shahpar 2004, Hutton et al 2006, 2007, Maccarty et al 2008, Wilkinson et al 2009, Arcenas et al 2010, Venkataraman et al 2010, Malla et al 2011, Pant 2011, Jeuland and Pattanayak 2012, Grieshop et al 2012, Shindell et al 2012, Aunan et al 2013, Johnson and Chiang 2015). Here we examine illustrative cookstove intervention programs designed specifically for Mozambique and quantify benefits from reduced household and ambient air pollution on health and short- and long-term climate change. This approach demonstrated for Mozambique can be applied to any country.
2. Materials and methods
We estimate the household and ambient air pollution-related health and climate benefits of illustrative scenarios of cleaner cookstove programs in Mozambique. We use local data from Mozambique where possible, extrapolate from other locations where Mozambique-specific data are unavailable, and provide a sensitivity analysis in the supplemental information (available at stacks.iop.org/ERL/12/025006) that can be used to reevaluate these and other scenarios as local data become available.
2.1. Scenarios
We examine four illustrative scenarios, informed by cleaner cooking efforts underway in Mozambique (table 1; see supplemental information):
- Rural Natural Draft (RND): expanded penetration of natural draft stoves (e.g. Envirofit Econofire) burning unprocessed wood and other biomass in 10% and 40% each of all rural household (a) nationwide and (b) in four provinces: Sofala, Manica, Inhambane, and Gaza.
- Rural Forced Draft (RFD): as for the RND scenario, but substituting forced draft stoves (e.g. BioLite HomeStove) that burn unprocessed biomass more efficiently (by, for example, blowing air into the combustion chamber) in the same rural areas.
- Urban Modern Charcoal (UMC): expanded penetration of cleaner charcoal-burning stoves (e.g. Envirofit Econochar) in 10% and 40% of households in five major cities in Mozambique: Maputo, Beira, Nampula, Tete, and Pemba.
- Urban Liquefied Petroleum Gas (ULPG): as for the UMC scenario, but using liquefied petroleum gas (LPG) stoves (e.g. Envirofit Pureflame) in place of charcoal in the same cities.
Table 1. Scenarios for clean cookstove programs in Mozambique (HH = households).
| Name | Rural natural draft (RND) | Rural forced draft (RFD) | Urban modern charcoal (UMC) | Urban LPG (ULPG) |
|---|---|---|---|---|
| Community type | Rural | Rural | Urban | Urban |
| Baseline fuel | Unprocessed biomass | Unprocessed biomass | Charcoal | Charcoal |
| Baseline stove | 3 stone fire | 3 stone fire | Traditional | Traditional |
| Improved fuel | Unprocessed biomass | Unprocessed biomass | Charcoal | LPG |
| Improved stove | Natural draft e.g. Envirofit EconoFire | Forced draft e.g. BioLite Homestove or Phillips HD4010 | e.g. Envirofit Econochar | e.g. Envirofit Pureflame |
| IWA Tier (high power indoor PM2.5 emissions) | 1 | 3 | 3 | 4 |
| Baseline exposure (µg m−3) | 150 | 150 | 150 | 150 |
| % PM2.5 emissions reduced (per HH) | 44% | 80% | 80% | 95% |
| % PM2.5 exposure reduced |
35% | 64% | 64% | 76% |
| Intervention exposure level used (µg m−3) | 97 | 54 | 54 | 36 |
| Fraction of HHs using the intervention | 0.7 | 0.7 | 0.7 | 0.6 |
| Cost per intervention ($/HH) | 13 | 55 | 15 | 20 |
| Fuel/maintenance cost ($/yr/HH) |
2.5 | 2.5 | 2.5 | 104 (Nampula), 27 (Beira), 0 (Maputo) |
| Location | a) Nationwide b) Sofala, Manica, Inhambane, Gaza provinces | a) Nationwide b) Sofala, Manica, Inhambane, Gaza provinces | Maputo, Beira, Nampula, Tete, Pemba | Maputo, Beira, Nampula, Tete, Pemba |
| # households | 10%, 40% | 10%, 40% | 10%, 40% | 10%, 40% |
aDerived from percentage PM2.5 emissions reduced (per HH) multiplied by the 0.8 adjustment factor to convert to exposure reduction. b Assumed maintenance cost only for RND and RFD (fuel collected and not purchased), and for UMC scenarios (fuel use savings).
2.2. Household air pollution health impact assessment
To estimate HAP-related health benefits, we used the Household Air Pollution Intervention Tool (HAPIT) version 2 (available at: https://hapit.shinyapps.io/HAPIT/, described by Pillarisetti et al 2016 and summarized in the supplemental information). HAPIT combines PM2.5 exposure levels before and after the intervention with epidemiologically-derived PM2.5 Integrated Exposure Response curves (IERs; Burnett et al 2014) and population and baseline disease incidence for 2010 (IHME 2016) to estimate the PM2.5-related disease burden averted.
For baseline PM2.5 exposure levels, we used findings from studies in Maputo (of personal exposure to PM7), Ghana (van Vliet et al 2013), and Malawi (Fullerton et al 2009), the most relevant field studies of personal particulate matter exposure in Africa that were discoverable upon an informal literature search, and derived a baseline PM2.5 exposure level of 150 µg m−3 for both urban and rural areas in Mozambique (see supplemental information). This is roughly consistent with personal PM7 exposure measurements during cooking in Maputo (Ellegård 1996) converted to 24-hour exposures, assuming all PM7 particles are PM2.5. Since ambient PM2.5 concentrations are relatively low across Mozambique (ranging from 4 µg m−3 to 17–18 µg m−3; figure 1), extremely high values during cooking times averaged with ambient PM2.5 levels for the remainder of the day's exposure result in substantially lower daily exposure estimates. This value is slightly higher than HAP exposure measurements from urban charcoal use in Ghana (van Vliet et al 2013) and slightly less than half of kitchen area concentrations measured in rural homes in Malawi (Fullerton et al 2009).

Figure 1 Satellite-derived annual average PM2.5 concentrations in 2010 used for ambient PM2.5 exposures, from van Donkelaar et al (2016).
Download figure:
Standard image High-resolution imageAs local estimates of post-intervention exposure levels were also unavailable, we derived post-intervention exposure levels for each scenario according to laboratory emissions measurements categorized by the International Workshop Agreement (IWA) Cookstove Tiers for indoor PM2.5 emissions (ISO 2012, Jetter et al 2012). We applied an adjustment factor of 0.8 to extrapolate from laboratory emissions to field exposure reductions, which are typically smaller. This is a simplified assumption since no local information was available on which to base this adjustment factor. We roughly derived this adjustment factor from field exposure measurements in India for natural draft and forced draft stoves as described below, and carried it through to the UMC and ULPG scenarios as no studies were available in the literature to benchmark exposure values for the urban scenarios. We used emission reductions for IWA Tier 1 for the RND scenario (44% emission reduction, 35% exposure reduction; Jetter et al 2012) and Tier 2 for the RFD scenario (80% emission reduction, 64% exposure reduction). The 35% exposure reduction for the RND scenario is near the middle of the range found with field measurements of kitchen concentrations for natural draft stoves in India (8.55%–61.54% reduction from baseline, Sambandam et al 2014). The 64% exposure reduction for the RFD scenario is reasonable given measurements of 24-hr kitchen concentrations for forced draft stoves in India (e.g. 63% reduction, Sambandam et al 2014). We used emission reductions for IWA Tier 2 for the UMC scenario (80% emission reduction, 64% exposure reduction) and Tier 4 for the ULPG scenario (95% emission reduction, 76% exposure reduction). For all scenarios, we used a counterfactual exposure level of 10 μg m−3, the current World Health Organization guideline for ambient PM2.5 (WHO 2006, 2014), below which health impacts are no longer calculated. This counterfactual level is consistent with approach taken by the Global Burden of Disease study (Forouzanfar et al 2016), and does not substantially influence results since the same counterfactual is used for all scenarios.
The three scenarios that do not include a fuel switch (RND, RFD, UMC) are assumed to have a relatively high rate of adoption of the new technology, defined here as the percentage of the population receiving the new technology that actually uses it to some degree (70%); we assume a lower adoption rate (60%) for ULPG, which includes a fuel switch from charcoal to LPG. This parameter is inclusive of any use of the new technology, including households engaging in fuel/stove stacking (multiple fuels/stoves used within the household). It does not consider the degree to which the old technology is displaced by the new technology, which is captured in the post-intervention exposure level calculation. While no empirical data were available on which to base these values, field evidence from Ghana and India suggests that these adoption rates are reasonable assumptions (Piedrahita et al 2016, Pillarisetti et al 2014).
2.3. Ambient air pollution impacts on health
We estimated ambient air quality changes and related health impacts using GEOS-Chem, a global chemical transport model that uses input meteorology from the Goddard Earth Observing System along with online calculations of aerosol formation, growth, and deposition at 2° by 2.5° resolution (Bey et al 2001; the version used here detailed by Lee et al 2015). As for HAP health impacts, we used disease specific IERs (Burnett et al 2014) to estimate the number of annual premature deaths from exposure to ambient PM2.5 concentrations. We used satellite observations (van Donkelaar et al 2016) to redistribute aerosol mass concentrations to 0.1° by 0.1° resolution (see supplemental information). This model is used in conjunction with its adjoint (Henze and Seinfeld 2007), enabling efficient calculation of the sensitivity of the model estimated ambient air quality health impacts with respect to cookstove emissions from each species and gridcell. We used these sensitivities to linearly approximate the contribution of emissions within Mozambique to ambient PM2.5-related mortality globally and within Mozambique.
Baseline model calculations used year 2000 emissions and meteorology, and we rescaled estimated PM2.5 concentrations to 2010 values using satellite-based corrections at 2° by 2.5° resolution (van Donkelaar et al 2016; figure 1). The satellite data used most closely match the in situ measurements in neighboring South Africa (www.rbcaa.org.za/, accessed: 16 May 2016) and improve upon the GBD 2013 dataset (Brauer et al 2016) by using geographically weighted regression factors. We also used these satellite data to redistribute PM2.5 concentrations to 0.1° by 0.1° resolution for assessing health impacts. Solid fuel cookstove emissions were estimated by combining the Bond et al (2007) carbonaceous aerosol emissions inventory for biofuel use with the domestic sulfur dioxide (SO2) emissions from Lamarque et al (2010). We then applied country specific solid fuel use fractions from Bonjour et al (2013) and a mask representing the percent of gridcell population residing in Mozambique to accurately estimate emissions from Mozambique alone. We used a simple parameterization that secondary organic aerosol (SOA) impacts are an additional 18% of OC impacts. This assumes a 50% SOA formation rate from aromatic and other emitted non-methane volatile organic compounds from the biofuel sector (Streets et al 2003). To disaggregate urban and rural emissions, we considered population density >100 people per square kilometer to be urban (see supplemental information).
2.4. Ambient air pollution impacts on climate change
We estimated net climate impacts of each cookstove scenario considering the associated change in emissions of both warming (CO2, CH4, and BC) and cooling pollutants (OC, SOA, and SO2). Our approach was to first estimate the impact of each scenario on emissions of individual pollutants, calculate species-specific changes in radiative forcing, and, finally, use previously published relationships to translate radiative forcing to temperature change. Baseline cookstove greenhouse gas (GHG) emissions were derived from published emissions factors for GHG emissions relative to aerosol emissions (Turn et al 1997, Roden et al 2006, Johnson et al 2008, Roden et al 2009, Jetter et al 2012), considering only traditional stoves and fuels, to create an average emissions factor for GHG emissions as a function of aerosol emissions. Other studies have shown that harvesting woodfuels in a renewable manner substantially impacts the net impact of cooking with woodfuel on CO2 emissions (Bailis et al 2015, Wilson et al 2016). We therefore used a Mozambique-specific estimate of fraction of non-renewable biomass harvesting from Bailis et al (2015), resulting in only 39.6% of cookstove CO2 emissions contributing to net climate impacts.
To calculate the radiative forcing from CO2, CH4, and nitrous oxide (N2O), which are relatively long-lived in the atmosphere, we used time dependent impulse response functions (Joos et al 2013, Aamaas et al 2013). Since the other pollutants considered have shorter atmospheric lifetimes and their radiative forcing effects are spatially heterogeneous, we estimated their climate impacts within large latitudinal bands, consistent with Shindell and Faluvegi (2009). We calculated radiative forcing and climate impacts of carbonaceous aerosol emitted in each gridcell using the GEOS-Chem Adjoint model (Henze and Seinfeld 2007, Henze et al 2012), following Lacey and Henze (2015), and used a similar methodology to add SO2. Specifically, we used Mie theory to calculate aerosol optical properties, which were then used in the LIDORT radiative transfer model (Spurr et al 2001) to estimate net changes in radiative flux from a baseline pre-industrial atmosphere. This model assumes species-specific fixed initial lognormal size distributions and includes only aerosol direct radiative forcing (DRF). To include aerosol indirect and semi-direct effects, scaling factors of the DRF with respect to these effects were used in a similar manner to prior published works (e.g. UNEP/WMO 2011). This approximation has produced climate impact estimates that are comparable to fully coupled microphysical model simulations of similar emissions perturbations (Kodros et al 2015). We report central estimates with ranges encompassing uncertainties in aerosol radiative efficiencies estimated from multi-model studies (Boucher et al 2013, Myhre et al 2013).
Transient radiative forcing estimates for both short-lived climate pollutants and long-lived GHG emissions were combined to calculate net radiative forcing in a given year. The net radiative forcing results were then multiplied by the transient global mean sensitivity derived from Boucher and Reddy (2008) to estimate the surface temperature response. For aerosol and aerosol precursor emissions, we used previously published absolute regional temperature potentials (ARTPs; Shindell and Faluvegi 2009, Shindell 2012) to translate latitudinal radiative forcing to temperature change. This method of attributing the climate impacts from radiative forcing has been validated through comparison of the estimated surface temperature responses using ARTPs to the calculated response from several fully-coupled earth system models (Shindell et al 2012, Stohl et al 2015).
2.5. Cost-effectiveness
We evaluate scenario-specific cost-effectiveness based on the health benefits of reduced HAP, excluding ambient air pollution health benefits and climate benefits. We use the WHO-CHOICE framework (www.who.int/choice/en/); if $/DALY averted is less than gross domestic product (GDP) per-capita, the scenario is considered very cost-effective; if $/DALY averted is between 1–3 × GDP per-capita, the scenario is considered cost-effective; and any scenario in which $/DALY averted is greater than 3 × GDP per-capita is considered not cost-effective (Evans et al 2006). Values for stove/fuel and maintenance costs used to evaluate cost-effectiveness for each scenario (table 1) are used to estimate the USD($) per DALY averted, which we then compare to Mozambique's 2014 GDP per capita of $586 (World Bank 2016).
Stove and fuel costs are based on local information (personal communication: Rosario Loayza, 18 May 2016, and Envirofit, 20 May 2016). Rural fuel costs are assumed to be zero as unprocessed biomass is collected rather than purchased, and we assume maintenance costs are low ($2.5 yr−1). Urban charcoal and LPG prices are from surveys in Maputo/Matola, Nampula, and Beira cities (van der Plas et al 2012). Monthly LPG expenditures ranged from $159 in Beira to $158 in Maputo/Matola and $165 in Nampula. For the ULPG scenario, we subtract monthly charcoal costs from monthly LPG costs to derive fuel costs of $99 for Nampula, $22 for Beira, and −$30 for Maputo (higher baseline annual expenditures for charcoal versus LPG). We assume that fuel costs beyond baseline charcoal expenditures are covered by the intervention program, and set the negative value indicating cost savings for Maputo to zero within HAPIT to calculate $/DALY.
3. Results
We estimate that the RND scenario reaching 10% of rural households nationwide would avert 200 premature deaths and 14 000 DALYs from reduced household PM2.5 over the 3-year project lifetime (table 2). The RFD scenario is estimated to avert 500 premature deaths and 38 000 DALYs from reduced household PM2.5 given the same project lifetime and household penetration level. These results assume an adoption rate of 70% and an adjustment factor of 0.8 to convert from laboratory-based emission reduction measurements to exposure reductions, both of which could be overly optimistic. For example, household PM2.5-related health benefits for the RFD scenario would be reduced by 13% if a lower adoption rate of 60% is used instead of 70%, which may be warranted since forced draft stoves are more of a departure from traditional stoves compared to natural draft stoves. We estimate that 5 and 10 annual premature deaths globally would be averted from reduced ambient air pollution for the RND and RFD scenarios, respectively, approximately 40% of which occur within Mozambique. We estimate that the RND and RFD scenarios would result in a net global cooling in 2050 of 16 and 29 μK, respectively. The cooling benefit increases (more climate beneficial) to 28 and 52 μK in the year 2100 due to the increasing effects of GHGs (figure 2). Health and climate benefits for both scenarios are four times higher with a 40% rural households penetration level.
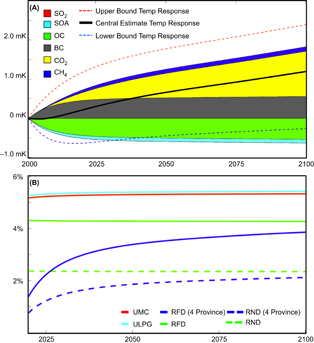
Figure 2 (a) Transient speciated net climate impact (mK) of present day emissions from nationwide solid fuel use in Mozambique and (b) for each cookstove intervention, percent reduction from the national central estimate climate impact (shown in figure 2(a)). Each rural cookstove intervention scenario is based on 300 000 households (nationwide 10% penetration and province-level 40% penetration) and each urban scenario is based on 275 000 households (40% penetration).
Download figure:
Standard image High-resolution imageFor the RND and RFD scenarios reaching 10% of households in Sofala, Manica, Inhambane, and Gaza provinces only, we estimate 50 and 100 premature deaths averted from reduced household PM2.5 over the 3-year project lifetime (table 2). We also find that reduced ambient PM2.5 would avert 2 and 4 annual premature deaths for the two scenarios, respectively, approximately 30% of which occur within Mozambique. These scenarios would lead to 3 and 6 μK global surface temperature cooling in 2050 (6 μK and 12 μK in 2100). A slight climate dis-benefit occurs in the several years following scenario implementation, since radiative forcing in the model gridcells overlaying these provinces is highly sensitive to reflecting organic carbon emissions (figure 2). However, the temperature impact trend rapidly turns to cooling and reaches larger and larger cooling magnitudes over the course of the century as the radiative impact of the longer-lived greenhouse gases (i.e. CO2 and CH4) overtakes that of the shorter-lived species (i.e. BC and OC).
Table 2. Estimated health and climate benefits of the rural scenarios. Results are rounded and therefore may not match reported ratios of benefits between scenarios.
| Scenario | Rural natural draft (RND) | Rural forced draft (RFD) | ||||||
|---|---|---|---|---|---|---|---|---|
| Nationwide | 4 provinces | Nationwide | 4 provinces | |||||
| 10% | 40% | 10% | 40% | 10% | 40% | 10% | 40% | |
| Household air pollution | ||||||||
| # HHs | 300 000 | 1 200 000 | 80 000 | 300 000 | 300 000 | 1 200 000 | 80 000 | 300 000 |
| Deaths averted (3-year project lifetime) | 200 | 800 | 50 | 200 | 500 | 2200 | 100 | 500 |
| DALYs averted (3-year project lifetime) | 14 000 | 55 000 | 3 700 | 14 000 | 38 000 | 150 000 | 10 000 | 38 000 |
| Ambient air pollution | ||||||||
| Global deaths averted (annual) | 5 | 20 | 2 | 8 | 10 | 40 | 4 | 20 |
| Temperature | ||||||||
| 2050 Global Impact (μK) | −16 (10 to −43) | −63 (41 to −168) | −3 (2 to −8) | −13 (9 to −35) | −29 (19 to −77) | −115 (75 to −307) | −6 (4 to −16) | −23 (15 to −61) |
| 2100 Global Impact (μK) | −28 (6 to −56) | −113 (24 to −226) | −6 (1 to −12) | −26 (6 to −52) | −52 (11 to −104) | −206 (44 to −412) | −12 (3 to −24) | −47 (10 to −94) |
To determine whether the rural scenarios have greater ambient PM2.5-related health and climate benefits when higher penetration levels are achieved in smaller geographical areas versus lower penetration levels in larger geographical areas, we compare 40% penetration in the four provinces to 10% penetration nationwide, resulting in the same number of households in each geography. For 40% penetration in the four provinces compared to 10% penetration nationwide, we find 60% larger ambient PM2.5-related health benefits (8 deaths averted versus 5 for the RND scenario) but 20% and 10% lower climate benefits in 2050 and 2100, respectively (less cooling). The difference in climate impact occurs because OC emissions from grid cells overlaying these four provinces are particularly influential on global radiative forcing, a function of surface albedo, atmospheric lifetime, aerosol formation rate, wind patterns transporting pollutants inland or over oceans, and other meteorological factors such as cloud cover and incoming solar radiation. These results indicate that concentrating cleaner stoves would have greater ambient air quality benefits compared with lower penetration levels across a broader geographical area.
For the urban scenarios, we estimate that the UMC scenario at 10% penetration level would avert 100 premature deaths and 9 000 DALYs over the 3-year project lifetime from reduced household PM2.5 (table 3). We estimate that the ULPG scenario would avert 200 premature deaths and 11 000 DALYs from reduced household PM2.5 at the same household penetration level. As for the rural scenarios, these results are based on an assumed adjustment factor of 0.8 to convert from laboratory-based emission reduction measurements to field exposure levels, and assumed adoption rates of 70% and 60% for the UMC and ULPG scenarios, respectively. These ULPG results would be 16% higher if a usage rate of 70% was used, as was used for the other three scenarios. An estimated 6 annual premature deaths globally would be averted from reduced ambient PM2.5 for both scenarios, approximately 40% of which occur within Mozambique. We estimate that the UMC and ULPG scenarios would each result in a net global cooling in 2050 of 9 μK (16 μK in 2100).
Table 3. Estimated health and climate benefits of the urban scenarios. Results are rounded and therefore may not match reported ratios of benefits between scenarios.
| Scenario | Urban modern charcoal (UMC) | Urban LPG (ULPG) | ||
|---|---|---|---|---|
| 10% | 40% | 10% | 40% | |
| Household air pollution | ||||
| # HHs | 70 000 | 275 000 | 70 000 | 275 000 |
| Deaths averted (3-year project lifetime) | 100 | 500 | 200 | 600 |
| DALYs averted (3-year project lifetime) | 9 000 | 35 000 | 11 000 | 44 000 |
| Ambient air pollution | ||||
| Global deaths averted (annual) | 6 | 23 | 6 | 23 |
| Temperature | ||||
| 2050 Global Impact (μK) | −9 (6 to −24) | −36 (24 to −96) | −9 (6 to −24) | −36 (24 to −96) |
| 2100 Global Impact (μK) | −16 (10 to −43) | −64 (42 to −171) | −16 (10 to −43) | −65 (43 to −174) |
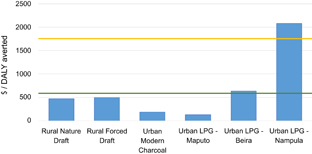
In terms of cost-effectiveness, we find that the RND and RFD scenarios cost approximately $471 and $497 per DALY averted (figure 3). Both scenarios are considered very cost-effective per the WHO-CHOICE framework, as the $/DALY for both is less than GDP per capita of $586. The UMC scenario costs approximately $185 per DALY averted. As the $/DALY result is less than GDP per capita ($586), this scenario is considered very cost-effective, and is estimated to remain so if total intervention costs (stove cost plus program and monitoring and evaluation costs) are <$60 per stove. For the ULPG scenario, we use fuel cost values from three different cities. This scenario costs approximately $125/DALY in Maputo, $634/DALY in Beira, and $2080/DALY in Nampula. The difference between the cities is due to the highly variable household expenditures on charcoal, which are offset by switching to LPG. In Maputo, this scenario leads to cost savings since baseline household expenditures are higher for charcoal versus LPG. This scenario is very cost-effective in Maputo, cost-effective in Beira, and not cost-effective in Nampula. Total intervention cost per stove would need to exceed $200 for Beira and $275 for Maputo before the ULPG scenario in these cities stops being cost effective.
Figure 3 Cost-effectiveness results for each scenario. Green line indicates target for very cost-effective ($/DALY < GDP per capita of $586 in 2014). Yellow line indicates target for cost-effective ($/DALY < 3 × GDP per capita).
Download figure:
Standard image High-resolution image
As little information was available about baseline and intervention exposure levels in rural and urban households in Mozambique, we examined the sensitivity of results to different baseline and post-intervention exposure levels (table 4). The magnitude of averted deaths is larger with increasing baseline exposure level, decreasing intervention exposure level, and higher intervention adoption rate. Per 5 000 households with 70% adoption rate, using a baseline exposure level of 200 µg m−3 rather than 150 µg m−3 would have resulted in 25% more estimated deaths averted for an intervention exposure level of 50 µg m−3. Per 5 000 households with 70% adoption rate, using an intervention exposure level of 75 µg m−3 rather than 50 µg m−3 (similar to the RFD and UMC scenario exposure levels used) would decrease health benefits by 38%. Such a scenario could occur if post-intervention exposure levels were higher than estimated for the core results—for example, though we assumed that exposure reductions were only 80% the magnitude of laboratory-based emission reduction measurements, high rates of stove/fuel stacking could further temper the exposure reduction in reality (e.g. Mortimer et al 2016). As more local information becomes available, for example from field measurement campaigns in Mozambique, the sensitivity results presented here and in the supplemental information can be used to re-estimate household air pollution health impacts, ambient air pollution health impacts, and climate impacts.
Table 4. Premature deaths averted per 5 000 households by baseline and intervention PM2.5 exposure levels, assuming an adoption rate of 60% (top row of each cell) and 70% (bottom row of each cell) and project lifetime of 3 years.
| Baseline | Intervention exposure | |||||||
|---|---|---|---|---|---|---|---|---|
| exposure | 200 | 175 | 150 | 125 | 100 | 75 | 50 | 25 |
| 300 | 1.125 1.125 | 2.25 2.25 | 2.25 3.375 | 3.375 4.5 | 4.5 5.625 | 6.75 7.875 | 10.125 12.375 | 15.75 19.125 |
| 275 | 1.125 1.125 | 1.125 2.25 | 2.25 2.25 | 3.375 3.375 | 4.5 5.625 | 6.75 7.875 | 10.125 12.375 | 15.75 19.125 |
| 250 | 1.125 1.125 | 1.125 1.125 | 2.25 2.25 | 3.375 3.375 | 4.5 5.625 | 6.75 7.875 | 10.125 12.375 | 15.75 19.125 |
| 225 | 0 0 | 1.125 1.125 | 1.125 2.25 | 2.25 3.375 | 4.5 4.5 | 6.75 6.75 | 10.125 11.25 | 15.75 18 |
| 200 | 0 0 | 0 1.125 | 1.125 1.125 | 2.25 2.25 | 3.375 4.5 | 5.625 6.75 | 9 11.25 | 14.625 18 |
| 175 | 0 0 | 0 0 | 1.125 1.125 | 2.25 2.25 | 3.375 3.375 | 5.625 6.75 | 9 10.125 | 14.625 16.875 |
| 150 | 0 0 | 0 0 | 0 0 | 1.125 1.125 | 2.25 3.375 | 4.5 5.625 | 7.875 9 | 13.5 15.75 |
| 125 | 0 0 | 0 0 | 0 0 | 0 0 | 1.125 1.125 | 3.375 4.5 | 6.75 7.875 | 12.375 14.625 |
4. Discussion and conclusions
We conducted a screening-level analysis of the household and ambient air pollution-related health and climate benefits that could be achieved by implementing cleaner cooking programs in Mozambique. For rural areas, forced draft wood-burning stoves are estimated to achieve >2.5 times more health benefits compared to natural draft stoves, assuming equal usage rates. Both natural draft and forced draft stoves are estimated to be very cost-effective. For urban areas, advanced charcoal stoves would achieve approximately 80% of the health benefits of LPG stoves and are estimated to be very cost-effective. LPG stoves are estimated to be very cost-effective in Maputo where charcoal is relatively expensive, cost-effective in Beira, and not cost-effective in Nampula, where charcoal is relatively cheap. Climate impacts are uncertain due to the current level of scientific understanding of short-lived climate pollutant radiative impacts. However, we estimate that all scenarios would reduce expected climate change-related temperature increases from continued national-scale solid fuel cookstoves use by 4%–6% (figure 2(a)) over decadal and longer-term time periods, depending on the scenario.
HAP- and ambient air pollution-related health benefits are not directly additive. HAP impacts include child acute lower respiratory infections and chronic disease incidence for all ages, while ambient air pollution health impacts include only chronic diseases for ages 30+ years. HAPIT distributes health benefits over 20 years and includes in the results only those health benefits occurring during the project lifetime, plus attenuated benefits for two years after the project ends. HAPIT distributes the total number of intervention stoves equally over each project year. Ambient air pollution health benefits assume all stoves are distributed at the project start and are calculated as an annual benefit estimate. Future work will move towards harmonizing these approaches to yield more comparable estimates in the future.
Due to the dearth of exposure measurements in Mozambique, we used studies from nearby countries to derive baseline exposure level estimates, and used laboratory emission studies with an assumed adjustment factor for intervention exposure level estimates. Both baseline and intervention exposure levels applied here are highly uncertain due to: 1) poor observed relationships between measurements of emissions in the lab and the field, 2) highly variable and context-specific relationships between kitchen area concentrations and personal exposures to HAP, and 3) the lack of ambient PM2.5 measurements in microenvironments near areas of heavy cookstove use, which could be higher than the concentrations derived from satellite observations. The degree of fuel/stove stacking among the intervention population is unknown and could be substantial (e.g. Ruiz-Mercado and Masera 2015). Our adjustment factor of 0.8 applied to convert the percentage of emissions reduced by the intervention to the percentage of exposure reduced by the intervention may not be large enough to account for both lab to field extrapolation of emissions reductions and degree of fuel/stove stacking. We attempted to address this through the sensitivity analysis wherein pre- and post-intervention exposure levels are varied up and down. Additionally, HAPIT assumes equal exposures among household members. As field measurements of emissions and exposure levels become available, sensitivity results can be used to recalculate benefits.
We were unable to quantify several other important sources of uncertainty. For example, we assume that all PM2.5 mixtures have the same health effects, despite variation between emission sectors and across stove and fuel types (e.g. Jetter et al 2012, Anenberg et al 2013). We ignore subnational variability in disease incidence rates, household size, and exposure levels (e.g. Chowdhury and Dey 2016). Climate impacts of short-lived climate pollutants are uncertain due to limited data on black carbon to organic carbon emission ratios from different stove types and fuels and their influence on the climate (e.g. Anenberg et al 2013, Bond et al 2013, Soneja et al 2016, Wang et al 2016). Impact of price shocks on fuels in urban areas and/or any behavioral changes required with new technology adoption were beyond our scope, though are important considerations for any intervention program. Finally, the prevalence and impact of mixed usage of traditional and intervention stoves should be evaluated and incorporated into these types of assessments, primarily by monitoring stove adoption rates, usage, and personal exposure measurements amongst a subset of households.
Benefits results may be underestimated for several reasons. We exclude health damages from pollutants beyond PM2.5 (e.g. Guarnieri et al 2014, Pope et al 2015) and reduced incidence of preterm birth and low birth weight, burns, and ocular disorders, which have been associated with household solid fuel combustion (Epstein et al 2013, Lakshmi et al 2013, Patel et al 2015, Pokhrel et al 2005, Smith et al 2014, Ravilla et al 2016). We do not consider the impact of reduced charcoal use on charcoal production, which would likely have benefits in terms of avoided emissions and impacts on forests, health, and climate (Mercier et al 2016), though increased use of efficient charcoal stoves could also increase charcoal fuel use.
For the cost-effectiveness calculations, following Pillarisetti et al (2016), we exclude ambient air quality health benefits, climate benefits, dissemination and monitoring and evaluation costs, household medical expenditures, and time spent collecting fuel. For the urban LPG scenario, we assume that fuel costs beyond baseline expenditures on charcoal are covered by the program. Including additional costs would increase our $/DALY values; considering other health, environmental, and social benefits would decrease them.
This screening-level analysis is intended to inform the design and development of realistic cleaner cookstove programs in Mozambique. Future studies can conduct more refined analyses for specific intervention designs, using more localized data on exposure levels, household size, baseline incidence rates, and technology adoption as they become available.
Acknowledgments
This work was supported through the World Bank's climate change and health program made possible by the Nordic Development Fund. The authors declare no potential conflicts of interest. We are grateful to the following individuals for valuable discussions and insights: Sanjay Srivastava, Rosario Loayza, Veronica Stolz, Phil Outram, Ana Mariguesa, Jose Carlos Edo Monfort, Humberto Cosssa, Angela Dengo, Ross Hughes, Paulo Sithoe, Kalpana Balakrishnan, Rufus Edwards, and Marc Jeuland.
Certain images in this publication have been obtained by the authors from the Wikimedia website, where they were made available under a Creative Commons licence or stated to be in the public domain. Please see individual figure captions in this publication for details. To the extent that the law allows, IOP Publishing disclaim any liability that any person may suffer as a result of accessing, using or forwarding the image. Any reuse rights should be checked and permission should be sought if necessary from Wikimedia and/or the copyright owner (as appropriate) before using or forwarding the image. It is included within this article on that basis. It is attributed to aquarius.ifm-geomar.de.