

Abstract
Groundwater is increasingly being overdrafted in the Southeastern U.S., despite abundant rainfall and the apparent availability of surface water. Using the state of Louisiana as an example, the current study quantifies the stresses on water resources and investigates the potential for opportunities to use surface water in lieu of groundwater pumping. The assessment is based on a fine watershed scale (12-digit Hydrological Unit Code [HUC] boundaries) water balance between the availability of surface and groundwater and surface water and groundwater demand. Water demand includes environmental flows, as well as public supply, rural domestic, industrial, power generation, agricultural, and aquaculture sectors. The seasonality of water stress is also addressed by incorporating monthly variations in surface water supply and irrigation demands. We develop several new weighting schemes to disaggregate the water withdrawals, provided by the U.S. Geological Survey on a county scale, to the HUC12 scale. The analysis on the smaller HUC12 scale is important for identifying areas with high water stress that would otherwise be masked at a larger scale (e.g. the county or HUC8 watershed scales). The results indicate that the annual water stress in Louisiana is below one (i.e. there is more water available than is used) for most watersheds; however, some watersheds (15 of the HUC12 units) show stresses greater than one, indicating an insufficient water supply to meet existing demands. The areas of the highest water stress are largely attributable to water consumption for power generating plants or irrigation. Moreover, estimating the stresses on surface water and groundwater sources separately confirms our speculation of abundant surface water and demonstrates a significant over-drafting/deficit of groundwater in many of the states aquifer systems. These results have implications for identifying new opportunities for reallocation of surface water use to reduce groundwater pumping and improve water sustainability in the region. Seasonal fluctuations in surface water supply and water withdrawals for irrigation highlight the fact that the water system is under more stress during the summer season. This observation underscores the need for infrastructure for short-term surface water storage in agricultural regions. The water budget analysis presented here can be useful for stakeholders in developing water management plans and can also help to inform the development of a water code that will enable Louisiana to successfully manage and conserve its water resources for the future.
Export citation and abstract BibTeX RIS
Introduction
Despite large amounts of average annual rainfall and an apparent abundance of surface water, the Southeastern U.S., including the state of Louisiana, are overusing groundwater (Hook et al 2000, Liu et al 2008, Konikow 2013). Substantial groundwater loss over the last decade in the Southeast U.S. was recently documented through a GRACE (Gravity Recovery and Climate Experiment) satellite investigation (Famiglietti and Rodell 2013). This trend has already impacted the degree of salinization in some aquifer systems (Heywood and Griffith 2013) and has reduced or eliminated base flow in some streams further inland (Mitra et al 2016, Rugel et al 2016). In addition, overdrafting of aquifers has been shown to be a major cause of land subsidence, especially for major coastal cities and urban communities including New Orleans, Louisiana (Zektser et al 2005, Budhu and Adiyaman 2010, Dokka 2011, Jones et al 2016).
Of the states in the Southeast, Louisiana is particularly sensitive to water stress because of its abundance of large ports, navigable waterways, freshwater ecosystems, and agriculture and aquaculture production. Based on a groundwater availability study conducted by Reilly et al (2008), the state of Louisiana was listed as one of the states in the Southeastern U.S. that includes areas of water level declines of more than 40 feet in confined aquifers (e.g. Borrok and Broussard 2016, and/or more than 25 feet in unconfined aquifers. The U.S. Geological Survey (USGS) estimates that more than 1600 million gallons per day (MGD) of groundwater was withdrawn in Louisiana in 2010. Groundwater withdrawals increased by 1.8% from 2005 to 2010 with a corresponding reduction in surface-water withdrawals by about 19% (from 8597 to 6964 MGD; Sargent et al 2011). Understanding the water budget of Louisiana and the stress on this system is crucial for keeping pace with the evolving demands for water due to population growth, expanding industry, and climate change. Evaluation of water stress can also be used to pinpoint and appraise opportunities for changing the way we currently manage water, particularly in areas where low water stress is juxtaposed with areas of higher water stress.
There exist a variety of metrics to evaluate the stresses on water systems. Although the formulations may be unique, they all fundamentally involve the balance of water availability and water demand. Water stress indicators have typically been evaluated on large spatial scales, ranging from global or continental (Smakhtin et al 2004, Averyt et al 2013, Schlosser et al 2014), to a country (Falkenmark 1989, Alcamo et al 2000) or regional basin scale (Sun et al 2008, Tidwell et al 2014). In these previous studies, the smallest unit of water balance was on the eight-digit Hydrologic Unit Code (HUC) scale. The HUC classification system represents a unique identification number consisting of two to twelve digits that divides and subdivides the United States into successively smaller hydrologic watershed units (Seaber et al 1984, Verdin and Verdin 1999). These larger-scale studies provide unique insights, but at the same time can hide substantial smaller-scale deviations in stress. It is these more local changes that frequently drive decision making for water management within municipalities, irrigation districts, conservation areas, etc.
Probably because of their larger-scale focus, many previous water stress investigations have also omitted some of the finer-details that might become more important at smaller management scales. For example, Sun et al (2008)'s investigation of water stress in the Southeastern United States was an excellent larger-scale study, but did not break down the contributions of different water demand sectors or resolve their impacts on surface water and groundwater separately. The Averyt et al (2013) investigation of stresses on watersheds throughout the U.S., did evaluate the impact on individual water use sectors, but was forced to make broad assumptions about groundwater (i.e. infinite availability of groundwater), and did not address environmental flow considerations.
In this study, we modify a previously-published water stress metric to examine the water system in the state of Louisiana on the fine watershed scale (i.e. the twelve-digit HUC12 scale). At this scale the state of Louisiana contains more than 1200 individual watersheds. The assessment of the stresses on water system is based on climatologically average conditions of water availability and incorporates intra-annual variability at the seasonal scale. The analysis includes the contribution of each individual demand sector to the stresses on both surface water and groundwater sources (combined and individually). We additionally examine the potential for reallocation of surface water use to reduce groundwater overdrafts and to improve water sustainability in the study region. This investigation can provide policy makers with a water budget framework that can be useful for the state of Louisiana, but can also be adopted as a starting point for expansion to other regions in the Southeastern U.S. and elsewhere.
1. Datasets
Table 1 summarizes the datasets used in this study, including their spatial and temporal resolutions. Water usage data from surface water and groundwater sources were collected by the U.S. Geological Survey (USGS) in cooperation with the Louisiana Department of Transportation and Development (DOTD) and published as water withdrawal estimates at the county level. These compilations are available for Louisiana every five years from 1960 to present (Sargent et al 2011). The surface water supply dataset used in this study is provided by the National Hydrography Dataset (NHDPlus) and includes average annual or monthly streamflow volumes. NHDPlus is an integrated suite of application-ready geospatial data products, incorporating many of the best features of the National Hydrography Dataset, the National Elevation Dataset, and the National Watershed Boundary Dataset. Stream flow is routed through the network of flow lines and mean annual flow estimates for each flow line reflect the average flow from 1971 to 2000 (McKay et al 2012). Groundwater availability, set equal to the annual average recharge rate, was determined using an existing USGS dataset with a grid resolution of 1 km. The USGS dataset uses estimates of the mean annual natural ground-water recharge by multiplying a grid of base-flow index values (Wolock 2003) by a grid of mean annual runoff values derived from a mean (1951 to 1980) annual runoff contour map (Gebert et al 1987). The same groundwater dataset was used by Tidwell et al (2014) for estimating unappropriated groundwater availability in the western states. For the purpose of the current study, the groundwater availability in each HUC12 unit is set equal to the average of recharge rates for all grids located inside the HUC12 under study.
Table 1. Sources of datasets used in water budget analysis.
| Variable | Temporal scale | Spatial scale | Source |
|---|---|---|---|
| Surface Water Supply | Annual (monthly) average (1971–2000) | Stream lines | NHDPlus |
| Groundwater Supply | Annual average (1951–1980) | 1 × 1 Km2 | USGS |
| Surface water withdrawals | Annual average (2010) | County scale | USGS |
| Groundwater withdrawals | Annual average (2010) | County scale | USGS |
2. Methodology
Disaggregation of water withdrawals
Water withdrawals were disaggregated to the HUC12 watershed scale. In addition to spatially distributing county-level data to the smaller HUC12 watersheds, up to three other weighting factors were considered for disaggregation of surface water withdrawals, depending upon the demand sector. These included (1) the percentage of crop acreage in each HUC12 unit; (2) The maximum order of stream lines located inside each HUC12 unit; and (3) The ratio of urbanized area in each HUC12 unit compared to the total urbanized area in the county containing the HUC12. The three weighting factors were incorporated into a geometric weighting formula that was used to consider the importance of the different factors in the disaggregation of surface water use for each sector from the county level to the HUC12 scale. Note that for HUC12 units that crossed the boundaries of more than one county, the weighting factors were calculated for the area of the HUC12 that fell inside each county separately and then aggregated to re-form the original HUC12. The geometric weighting formula is described by equations (1)–(3), below:
Where (n) represents the number of factors taken into account for disaggregation for a given demand sector, (m) is the total number of HUC12 units, located completely or partially, within a county, WHUC is the weight assigned to each HUC12 watershed, and WWSW is the volume of surface water withdrawal for a given sector calculated at the HUC12 scale by multiplying the weighting function (WHUC) by the surface water withdrawal at the county level (SWcounty). For example, withdrawals from the public supply sector are disaggregated using the HUC12 area (w1) and level of urbanization (w2) as the two weighting factors (n = 2). The disaggregation of irrigation sectors on the other hand includes three (n = 3) different factors; w1, w2, and w3 representing the weights for area, crop area, and stream order, respectively. The multiplicative formula will set the weight to zero if one of the factors is not present for a given HUC. For example, considering the industrial demand sector, if the HUC unit has no urbanized area, then WHUC = 0 even with the presence of other factors (e.g. area). The weighting factors considered for the disaggregation of the different water withdrawal sectors evaluated are summarized in table 2. Similar to surface water withdrawals, groundwater use was also disaggregated from the county level to the HUC12 scale (WWGW). The disaggregation method for groundwater utilizes a water well registration database provided by the Louisiana Department of Natural Resources. In brief, groundwater use within a county was disaggregated to all the active wells within that county by sector type and through weighting by the number of wells in each HUC12 watershed.
Stress on the water system
We adopt the water supply stress index (WaSSI) approach used by Sun et al (2008) for this investigation. The WaSSI index is expressed as a ratio of annual water demand to annual water supply for each individual watershed basin. Hence, the greater the WaSSI value, the more stress on the water system. The WaSSI was calculated for each HUC12 watershed using the following modified formula:
Where WW is the water withdrawal from surface water (WWSW) and groundwater sources (WWGW) calculated using disaggregation methods as explained in the previous section, WS is the water supply, and ENV is the environmental flow requirement for a given HUC12 basin. The surface water supply for each HUC12 is calculated as the regulated streamflow at the watershed outlet plus the amount of surface water that was withdrawn inside each HUC12. The latter addition is necessary to calculate the amount of flow in the stream in its natural condition prior to any withdrawals. Since it is difficult to get reliable estimates for how much water is consumed and returned by all the different demand sectors, our assessment considers only total water withdrawals and not consumptive demand. The original WaSSI formula is modified to include an environmental flow factor (ENV) that can account for the minimum amount of flow in rivers and streams that is necessary to support a healthy ecosystem. Environmental flow is required to provide a certain level of protection for aquatic and riparian environments (e.g. Tennant 1976, Smakhtin et al 2004, Arthington et al 2006, Poff and Zimmerman 2010, Richter et al 2012). Pastor et al (2014) compared five different hydrological methods for calculating environmental flow requirements in global water assessments and concluded an average value of 37% of annual flow is necessary to maintain a healthy stream environment. In this study, a more conservative ratio of 50% was chosen to define environmental demands following the same threshold adopted by Tidwell et al (2014) to estimate unappropriated surface water availability in western United States. Additional investigative work, including accounting for the intra-annual variability in streamflow, would be necessary to improve environmental flow calculations and to include better resolution over seasonal or shorter time periods. The WaSSI metric can also be used as a framework for calculating the stress contribution of each individual demand sector to the overall water stress, as well as to examine the stress on surface water and groundwater resources separately.
3. Results and Discussion
Disaggregation of water withdrawals
The results of disaggregation of the surface water data to the HUC12 scale using equations (1)–(3) and considering the weighting factors in table 2 are illustrated in figure 1. Note that an example of total surface water and groundwater withdrawals in 2010 at the county level is provided for the irrigation sector in the supplemental online material. Surface water demand for the power sector was calculated by only considering the HUC12 units where thermoelectric plants were located and using the estimates of water withdrawal provided by the USGS (Diehl and Harris 2014). These estimates are based on linked heat and water budgets, and complement reported thermoelectric water withdrawals in Louisiana in 2010. The rural domestic sector is not plotted because almost no surface water withdrawal was recorded for this sector. Figure 2 presents the disaggregated groundwater withdrawals at the HUC12 scale for the irrigation (a), industrial (b), public supply (c), and rural domestic (d) sectors. Based on the 2010 USGS water use dataset, the demand for water to cool power plants was dominated by surface water, so groundwater use was not relevant for this sector in Louisiana and was not included in this figure.
Table 2. Weighting factors considered for the disaggregation of different water withdrawal sectors.
| Weighting factor | Water withdrawal sector |
|---|---|
| Area | Irrigation, Industrial, and Public Supply sectors |
| Crop Area | Irrigation sector |
| Stream Order | Irrigation and Industrial sectors |
| Urbanization | Industrial and Public Supply sectors |

Figure 1 Surface water withdrawals (in MGD) in 2010 disaggregated to the HUC12 scale in Louisiana by (a) irrigation sector, (b) industrial sector, (c) public supply sector, and (d) power generation sector. Withdrawals are mapped using different non-linear color scales (HUC12 watersheds with surface withdrawals less than the bottom scale are displayed in white).
Download figure:
Standard image High-resolution image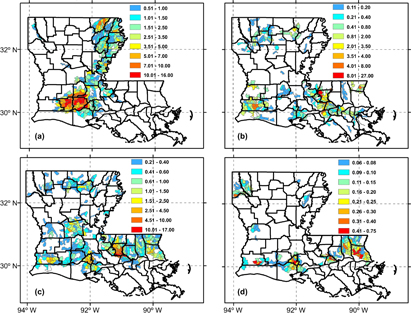
Figure 2 Groundwater withdrawals (in MGD) in 2010 disaggregated to the HUC12 scale in Louisiana by (a) irrigation sector, (b) industrial sector, (c) public supply sector, and (d) rural domestic sector. Withdrawals are mapped using different non-linear color scales (HUC12 watersheds with groundwater withdrawals less than the bottom scale are displayed in white).
Download figure:
Standard image High-resolution imageTotal and sector-based water stress
Figure 3 shows the WaSSI stress index defined in equation (4) for Louisiana's water system on the HUC12 watershed scale. The water stresses for most HUC12 units in Louisiana are below one; however, some watersheds show stresses greater than one, indicating insufficient average annual water supply to these systems to meet existing demands. In other words, groundwater is being overdrafted in these regions. The analysis on the HUC12 scale is useful for depicting small spatial variations in the stresses that can be masked when estimated at a larger county or HUC8 watershed scale. In order to better interpret and compare WaSSI results, we assigned threshold levels for what we considered to be low, medium, and high stresses. The choices of threshold value were based loosely on the Criticality Ratio concept that has been used in previous studies (Alcamo et al 2000, Falkenmark and Rockström 2004) but were adjusted to more conservative levels because the information needed to calibrate them under these conditions and at these smaller scales is not available. Table 3 lists the different categories of stress levels and the number of HUC12 units in Louisiana with the corresponding water stresses. According to the calculated stress levels, about 96% of the HUC12 watersheds in Louisiana are under low annual average water stress, while about 1.2% of the HUC12 watersheds are highly stressed with water demand exceeding the available water supply (i.e. the WaSSI was greater than 1.00 in these HUC12 units; table 3). As observed in figure 3, most of the watersheds in north Louisiana are under low stress, while many of the watersheds in the southeastern and southwestern parts of the state fall under medium or high categories of stress.
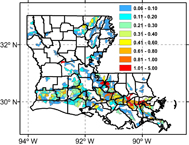
Figure 3 Water Supply Stress Index (WaSSI) on the HUC12 scale derived using annual average estimates of water supply and demand and a 50% environmental flow requirement (HUC12 watersheds with WaSSI less than 0.06 are displayed in white).
Download figure:
Standard image High-resolution imageThe stresses shown in figure 3 explain the combined impacts of water demand for all sectors on the sustainability of Louisiana's water system. However, it is also of interest to examine the contribution of each demand sector separately. Figure 4 illustrates the WaSSI values for each HUC12 unit calculated separately for four different demand sectors, (a) agriculture, (b) industrial, (c) public supply, and (d) power generation. This analysis reveals that agriculture is the main driver for the water stress in southwest and northeast Louisiana. High water stresses present in southeast Louisiana, however, are attributed mainly to large withdrawals by the industrial sector. Stresses greater than one, indicating groundwater is being mined to fill the water supply gap, occurs in several of the watersheds that include extensive water demand for cooling in thermoelectric power plants (figure 4(d)). The assessment presented in this study considers total water withdrawals and therefore does not account for return flows from non-consumptive use. In HUCs with a large amount of industry or agriculture, this return surface flow can be considerable. Future work will be necessary to quantify the amounts of non-consumptive use for these activities. The public supply sector does not contribute much to the average annual water stress in Louisiana (i.e. less than 0.1), except for watersheds that include the highly-populated cities of Baton Rouge and New Orleans.
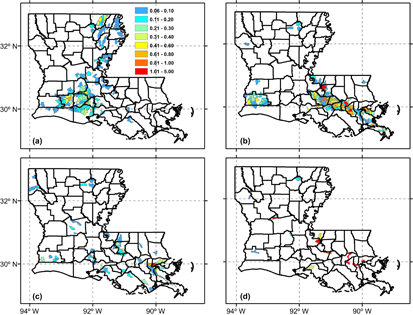
Figure 4 Sectoral-based stresses (WaSSI) on the HUC12 scale for the (a) Irrigation sector, (b) Industrial sector, (c) Public supply sector, and (d) Power generation sector. Stresses are mapped using the same non-linear color scale (HUC12 watersheds with WaSSI less than 0.06 are displayed in white).
Download figure:
Standard image High-resolution imageSurface water versus groundwater stress
Separate estimates of water stress for surface water and groundwater in Louisiana are depicted in figure 5. Surface water stress was calculated by eliminating groundwater demand and availability from the WASSI formula (equation (4)) and groundwater stress was calculated by eliminating surface water availability and surface water demand (including environmental flow).
The mapping of average annual surface water stress (figure 5(a)) shows that surface water stress is modest throughout Louisiana with the exception of some stress in southeastern Louisiana where industrial uses for surface water dominate. The picture is much worse when evaluating stress on the groundwater system (figure 5(b)). Some of the groundwater aquifers, especially the Chicot aquifer in southwestern Louisiana, are being severely overdrafted (i.e. the demand for this groundwater exceeds the recharge rate). We expanded our investigation to focus on characterization of Louisiana's groundwater system in terms of the important aquifer units. The seven largest freshwater-bearing aquifer units in Louisiana are illustrated in figure S2 (stacks.iop.org/ERL/11/124031/mmedia) of the supplemental online material. Table 4 lists the median water stresses on these major aquifers calculated using the groundwater stresses of the HUC12 units that fall within the aquifer boundaries. The Chicot aquifer is the most stressed aquifer with a median WaSSI of 0.22 followed by the Mississippi River Alluvial Aquifer with a WaSSI or 0.21.

Figure 5 Water Supply Stress Index (WaSSI) on the HUC12 scale estimated for (a) surface water supply and withdrawals, and (b) groundwater supply and withdrawals. Both are mapped to the same non-linear color scale (HUC12 watersheds with WaSSI less than 0.06 are displayed in white).
Download figure:
Standard image High-resolution imageTable 4. Median water stress for the major aquifers in Louisiana estimated for groundwater supply and withdrawals only (WaSSI(GW)).
| Aquifer | WaSSI(GW) |
|---|---|
| Chicot | 0.22 |
| Mississippi R. Alluvial | 0.21 |
| Sparta | 0.06 |
| Carrizo-Wilcox | 0.06 |
| Catahoula | 0.04 |
| Red River | 0.08 |
| Chicot Equivalent | 0.08 |
The fact that average annual stress on the groundwater system is so much greater than that on the surface water system, suggests that there is an opportunity in many parts of Louisiana to offset the use of groundwater by relying more heavily on the surface water supply. This idea was further tested by calculating the WaSSI index such that the surface water supply was relied upon to meet the annual demands of both surface and groundwater (i.e. the groundwater availability term was set to zero). Figure 6 shows the change in the WaSSI index when only the surface water supply is used as opposed to both surface and groundwater (figure 3). The vast majority of HUCs were either not stressed further or stressed only slightly more when relying entirely on surface water. Only a limited number of watersheds (19 of the HUC12 units) showed a substantial increase in stress (>0.6 increase in WaSSI; figure 6). These watersheds tend to be near the coast in the southeast and southwest parts of Louisiana. The availability of surface water is also constrained by the amount of water required to meet environmental flow, i.e. the value of ENV factor in the WaSSI formula. Assuming a water system reaching an acceptable stress value equal to 0.5, we estimated the corresponding environmental flow factor (ENV). We noticed that most of the HUC12 watersheds can maintain healthy environmental flows of 0.5 or 50% of average streamflow or higher. However, 19 of the HUC 12 watersheds can only reach such stress level with zero or negative environmental flow, indicating that the total available surface water supply (and more) would be needed to counterbalance demand. Most of these HUC12 watersheds exist in southeastern Louisiana along the Mississippi river and in the southwestern portion of the state. The stresses in these HUCs watersheds are mainly driven by industrial uses that withdraw large amounts of water. However, as mentioned above, much of the stress may be alleviated if a large percentage of the water is used and then returned to surface water bodies. Other issues like thermal pollution may then become important.

Figure 6 Increase in Water Supply Stress Index (WaSSI) on the HUC12 scale under the use of only surface water supply, i.e. no dependence on GW supply (HUC12 watersheds with WaSSI less than 0.06 are displayed in white).
Download figure:
Standard image High-resolution imageSeasonal water stress
The stresses on the water supply in Louisiana discussed so far are based on annual average estimates of streamflow and annual demand values. However, water withdrawals by some sectors can vary significantly during different seasons. For instance, the rice irrigation season in Louisiana begins in March and continues through July. For farms growing rice and subsequently growing crawfish, the water use extends through November. Based on these estimates on the timing for water demand for irrigation of rice and rice/aquaculture by season, two scenarios for seasonal water withdrawals were tested: (1) Water withdrawals for rice irrigation only, and (2) water withdrawals for rice irrigation and crawfish farming. We tested these scenarios for an example county, Acadia, in southwest Louisiana. In Acadia county rice and crawfish farming are the dominant uses of the water supply. For the first scenario, 90% of the water withdrawals by the irrigation sector are assumed to be uniformly distributed from March through July (the rice season). In the second scenario, 90% of the water withdrawals are assumed to be uniformly distributed and March to November (for rice and crawfish). The remaining 10% of water withdrawals are distributed evenly over the remaining periods of time for both scenarios. The chosen seasonal water distributions are based on direct communications with farmers in this region of Louisiana.
Figure 7a depicts the monthly variation in the average and standard deviation of streamflow for all the HUC12 units (23 in total) in Acadia County. The monthly streamflow among the HUC12 units in Acadia County varies considerably, further supporting the importance of performing water budget calculations on small watershed scales and over seasonal time scales. The temporal variability in the streamflow distribution indicates that the average peak surface water supply is received in January (figure 7(a)). The WaSSI stress index is calculated for each HUC12 located inside Acadia County using the two different scenarios of irrigation (figure 7(b) and (c)), while keeping the water withdrawals by the other sectors evenly distributed over the entire year for simplicity of analysis. Specific analysis for the seasonal variations in other factors such as recharge rate is beyond the scope of this study and future research will be needed to incorporate this and other temporal variability. The results for scenario 1 show that peak water stress is achieved for all of the HUC12 watersheds in Acadia County in July (figure 7(b)), because surface water supply is at a minimum (figure 7(a)). The average WaSSI of all the HUCs in Acadia County (illustrated as a thick line) shows that the average maximum stress is 0.13 for July. However, the averaging of stresses among all the HUCs conceals the high variability among the individual watersheds. Three HUC12 watersheds had a WaSSI stress greater than 0.3 and one watershed had a peak WaSSI value of 0.44 (which is highly stressed, table 3). The water stresses based on the second scenario of irrigation water withdrawals (figure 7(c)) show peak WaSSI values in August and October. These are the months where the supply of surface water is the lowest (figure 7(a)). Scenario 2 had the effect of lowering and spreading out the average water stress, but at the same time the continuous withdrawal of water to meet crawfish farming requirements caused substantial stress to the water system in several of the HUC12 watersheds (figure 7(c)).

Figure 7 Seasonal analysis of the Water Supply Stress Index (WaSSI) computed at a HUC12 scale for an example county, Acadia, Louisiana. Panel (a): Mean and standard deviation of monthly distribution of streamflow based on the NHDPlus dataset (1971–2000). Panel (b): Monthly WaSSI for the different HUC12 watersheds in Acadia County (thin lines) due to seasonal variation in irrigation demand for scenario 1 (see text for explanation). Panel (c): Same as Panel (b) but for scenario 2 (see text for explanation). The thick continuous line in panels (a) and (b) represent the average WaSSI across all of the HUC12 watersheds. The horizontal dashed line indicates the annual-scale WaSSI for the county.
Download figure:
Standard image High-resolution image
Table 3. Categories of WaSSI index corresponding to different stress levels.
| Stress Level | Stress on System | Number of HUC12 Units (%) |
|---|---|---|
| <0.50 | Low stress | 1299 (96.3%) |
| 0.50–1.00 | Medium stress | 32 (2.5%) |
| >1.00 | High stress | 15 (1.2%) |
4. Conclusions
Here we evaluated water stresses for the water system in Louisiana based on the balance between the availability of surface and groundwater resources and groundwater and surface water withdrawals. Louisiana was chosen as an example as one of a group of states in the Southeastern U.S. with abundant rainfall and surface water but groundwater that is being overdrafted (e.g. Famiglietti and Rodell 2013). The key conclusions from this work are as follows:
- (1)By applying a modified WaSSI index at small spatial scales we were able to identify important variations in overall annual water stress in Louisiana. Although 85% of HUC12 watersheds were considered to be under low annual stress conditions, 5% of the watersheds were under high levels of stress. These differences would likely not have been seen if we used a larger scale of analysis because the stresses of many HUC12 units would be averaged together. This suggestion is confirmed by comparing our results with the WaSSI stress index results calculated by Sun et al (2008) at the larger HUC8 scale in Louisiana. Large areas of low stress at the larger scale actually encompass some smaller HUC12 watersheds within them that are under considerable stress. The assessment of water stress at such small scales is important for water management planning and policy, including the evaluation of sites for economic development, water transfers, and water storage. It may also provide insight into the possibility of local and regional water transfers as a means to achieve a sustainable water system.
- (2)While the surface water system in most of Louisiana, and likely in other similarly wet regions, is not stressed (even when considering different levels of environmental flow requirements), the groundwater system is under considerable stress. The levels of stress on the groundwater system in Louisiana are comparable to stresses that were previously identified by Averyt et al (2013) in the drier areas of the Southwestern U.S. Stresses on the groundwater aquifers in wet regions such as Louisiana are masked by the abundant availability of surface water. This suggests that there is an opportunity in Louisiana, and perhaps other states in the Southeast U.S., for identifying improved ways to manage surface water to help offset groundwater use. Our testing of how the overall water stress would change if we relied upon surface water only to support all water demand in Louisiana showed that this would be feasible for the majority of the HUC12 watersheds in the state. We also saw that environmental flows in most regions of the state could easily be maintained at levels to support key ecological functions even with increased surface water use.
- (3)Evaluation of water stress over seasonal scales demonstrates the high degree of heterogeneity of water stress even within a single county. The seasonal fluctuations in WaSSI indicate peak stresses in July for watersheds with rice irrigation, while for crawfish and rice farms, stresses are more pronounced during August and October. The analysis of seasonality in WaSSI could potentially help water managers and decision makers set alternative plans during the year to meet various demands especially in seasons with limited surface water supply. For example, these analyses suggest that even a small investment in local temporary storage of surface water during moths of high availability would be a useful strategy in making the entire water system more sustainable.
This study provides a useful foundation for understanding the dynamics of the water system in Louisiana, which can help to inform users and policy makers. This work may also have implications for other regions in the Southeastern U.S., where re-allocation of surface water use to reduce groundwater over-pumping may be part of the long-term strategy for achieving sustainability. Our next step in the analysis of water stress will be to adopt a probabilistic-based approach for the WaSSI stress formula that can account for sources of uncertainties in water availability. Additional work will also consider water stress under scenarios of climate change, including droughts and flooding, and the growing demands for different sectors.
This material is based upon work supported by the National Science Foundation under grant No. CBET-1360398 and grant No. DUE-1122898. The authors would like to thank the anonymous reviewers for their valuable comments and suggestions to improve the quality of the manuscript.