

Abstract
Ecosystem carbon dioxide, energy, and water fluxes were measured using eddy covariance in a fresh clear-cut surrounded by a mixed spruce-birch-aspen forest in the boreal zone of European Russia. Measurements were initiated in spring 2016 following timber harvest and continued for five months. The influence of surrounding forest on air flow and turbulent fluxes within the clear-cut were examined using a process-based two-dimensional (2D) hydrodynamic turbulent exchange model. The clear-cut was a source of CO2 to the atmosphere prior to onset of vegetation growth during early spring. During this period the mean daily latent (LE) and sensible (H) heat fluxes were very similar and the Bowen ratio (β = H/LE) averaged about 1.0. Daily net ecosystem exchange of CO2 (NEE) was around 0 gC m−2 d−1 following onset of vegetation growth from mid-spring through summer, while β declined to 0.6–0.7. There was strong diurnal variability in NEE, LE and H over the measurement period that was governed by solar radiation and temperature as well as the leaf area index (LAI) of regrown vegetation. Modeled vertical CO2 and H2O fluxes along a transect that crossed the clear-cut and coincided with the dominate wind direction showed that the clear-cut strongly influenced turbulent fluxes within the atmospheric surface layer. Furthermore, modeled atmospheric dynamics suggested that the clear-cut had a large influence on turbulent fluxes in the downwind forest, but little impact on the upwind side. An aggregated approach including field measurements and process-based models can be a useful approach to estimate energy, water and carbon dioxide fluxes in non-uniform forest landscapes.
Export citation and abstract BibTeX RIS

Original content from this work may be used under the terms of the Creative Commons Attribution 3.0 licence. Any further distribution of this work must maintain attribution to the author(s) and the title of the work, journal citation and DOI.
Introduction
Forest harvest and other disturbances strongly influence terrestrial energy, water, nutrient and carbon cycling, with resulting biophysical and biogeochemical impacts on the climate system (IPCC 2013, Carlson and Groot 1997, Williams et al 2014). Considerable effort has gone into quantifying the influence of forest disturbance and management on biogeochemical cycling during recent decades using experimental and modeling approaches (Blennow 1998, Carlson and Groot 1997, Amiro 2001, Rannik et al 2002, Kowalski et al 2003, Sogachev et al 2005, Amiro et al 2006, Frank and Ruck 2008, Olchev et al 2009, Radler et al 2010, Aguilos et al 2014, Williams et al 2014, Khomik et al 2014). In particular, the experimental studies by Carlson and Groot (1997) and Radler et al (2010) showed that the size and shape of clear cuts had important effects on microclimate in forest ecosystems, largely through impacts on irradiance, wind speed and wind direction, air and soil temperature. Air temperature extremes increased as the size of forest canopy opening increased. Williams et al (2014) investigated CO2 and H2O fluxes in a temperate forest for three years after harvest using eddy covariance and portable chamber measurements. There were rapid changes in CO2 and H2O fluxes during the years following harvest, including an increase in gross ecosystem productivity (GPP) due to vegetation recovery that was coincident with large and relatively stable soil respiration. An experimental study by Amiro (2001) showed that clear-cutting an aspen forest in Canada decreased net radiation, latent (LE) and sensible (H) heat fluxes, as well increased soil heat fluxes (G). Measurements also indicated that clear-cutting can lead to a large reduction in daytime CO2 fluxes and, surprisingly, to little change in nocturnal CO2 fluxes (Amiro et al 2006).
Modeling approaches are usually applied to scientific tasks that cannot be resolved completely using the experimental (measuring) methods only. In particular, models are promising tools for describing atmospheric fluxes above non-uniform land surfaces with mosaic vegetation and complex topography. Frank and Ruck (2008) used a hydrodynamic model to investigate the effects of forest clearing on air flow. The results were validated against wind tunnel measurements and showed that forest clearing had marginal impacts on airflow within and above the upstream forest area, yet significant downwind impacts. Similar effects of forest clearings on air flow and turbulent exchange processes were found from modeling experiments provided by Sogachev et al (2005) using a three-dimensional (3D) atmospheric boundary-layer model.
The effects of forest management practices and forest disturbances on atmospheric fluxes can vary significantly among climatic zones and forest types (Keenan and Kimmins 1993) and thus it is important to investigate these impacts among a wide range of climatic, hydrological and soil conditions using experimental and modeling approaches.
This study examined the effects of clear cutting on atmospheric fluxes in the expansive and minimally studied boreal forest of western Russia. Net ecosystem exchange (NEE) of CO2, LE and H were continuously measured in a recently clear-cut boreal forest stand using eddy covariance technique. Furthermore, the CO2 fluxes measured using eddy covariance were verified against CO2 fluxes measured using portable chambers. The influence of surrounding forest on fluxes measured within the clear-cut was assessed by simulating turbulence and wind patterns using a two-dimensional (2D) process-based model. The model was also used to estimate the horizontal heterogeneity of CO2 and H2O fluxes above the clear-cut and surrounding forest under various weather conditions.
1. Methods
Experimental site
The study focused on a recently clear-cut mixed spruce forest situated near the Central Forest State Natural Biosphere Reserve in the Twer region of Russia (56°26'N, 33°03'E), which is far from any anthropogenic sources of air pollution (figure 1). The topography is almost flat with a gentle slope that does not exceed one degree.
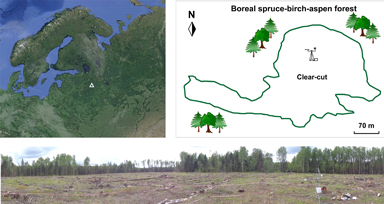
Figure 1. The geographical location of our experimental site in Twer region, general scheme of the clear-cut with location of the field station for continuous meteorological and flux measurements of LE, H and NEE, and panoramic photo of the study area.
Download figure:
Standard image High-resolution imageThe mixed spruce-birch-aspen forest was clear-felled in winter–early spring 2016 and cover around 3.6 ha. The study site after clear-cutting was completely free from woody plants and had a large amount of litter and harvest residue remaining on the soil surface (figure 1). Active regeneration of herbaceous species, low-growing shrubs and juvenile trees within the clear-cut began on the second part of May. Vegetation one-sided leaf area index (LAI) reached 2.5 m2 m−2 and a maximum height of 70–90 cm in late August. LAI was assessed both directly by using the destructive sampling method and indirectly using the AccuPARLP-80 (Decagon Devices Inc., USA). The amount of organic carbon in the upper 10 cm soil layer within the clear-cut varied from 2.73 to 5.79%. The height of surrounding forest ranged between 18 and 22 m.
Meteorological and eddy covariance measurements
Equipment for meteorological and eddy covariance flux measurements was mounted at a height of 2.4 m on a 3 m tall steel tripod (CM 106B, Campbell Sci. Inc., USA) installed in the northern part of the clear-cut (figure 1). The measuring station was about 190 m from the southern and south-western forest boundary, which is the dominated wind direction in spring and summer. The shortest distance between the measuring station and forest edge was about 90 m to the north. The measurements started on 7th April 2016 immediately after timber harvest. Air temperature and humidity, wind speed and direction, and precipitation rate were continuously measured using an automatic meteorological station WXT 520 (Vaisala Inc., Finland). Net radiation, as well as incoming and outgoing short-wave and long-wave radiation fluxes were measured by net radiometer NR01 (Hukseflux Thermal Sensors, The Netherlands). Incoming photosynthetically active radiation (PAR) was measured using a quantum sensor LI-190R (LI-COR Inc., USA). Soil temperature and water content were determined by reflectometers CS655 (Campbell Sci. Inc., USA), which were installed in four places around the flux tower at 10 cm depth. Soil heat flux was measured using self-calibrating heat flux sensors HFP01SC (Hukseflux Thermal Sensors, The Netherlands). All meteorological parameters were sampled with frequency 0.1 Hz and averaged over 30-min intervals.
The eddy covariance equipment for measurements of vertical NEE, LE and H fluxes included an open path CO2/H2O gas analyzer LI-7500A (LI-COR Inc., USA) and 3-D ultrasonic anemometer WindMaster Pro (Gill Instruments, UK). Eddy covariance data were collected at a 10 Hz rate. The fluxes were calculated from the raw data at 30-min intervals using the EddyPro data processing software (LI-COR Inc., USA). Post-field data processing was carried out according to established recommendations for data analysis (Aubinet et al 2012). Angle-of-attack correction, axis double rotation and block average detrending method were applied. Time lags were compensated by the covariance maximization. Air density fluctuations were compensated for using the WPL-correction terms (Webb et al 1980). Quality check included 1–9 flag policy (Foken et al 2004). All additional statistical tests (drop-outs, absolute limits, skewness and kurtosis) to assess the statistical quality of the raw time series data were carried out with default settings of the EddyPro software. The NEE values were calculated as a sum of the turbulent CO2 fluxes and the storage terms (Migliavacca et al 2009). After data post-processing the fluxes with quality flags ranged between 6 and 9, as well as all data with spikes that were usually associated with rainy weather, dew events, low wind, weak turbulence and stable atmospheric conditions were removed. Fluxes measured under weak turbulent conditions were filtered out based on the u* threshold value estimated using the Flux Analysis Tool (FAT) (Ueyama et al 2012). The mean u* threshold value estimated for the entire measuring period was about 0.04 m·s−1.
Footprint analysis
The upwind area where the atmospheric flux measured by eddy covariance instruments is generated (footprint) was estimated using the model from Kljun et al (2004). During the entire measurement period the mean daytime (from 07:00 to 20:00 GMT+3) fetch length was about 26 m, which was significantly less than the distance between the measuring system and the nearest forest edge (circa 90 m in north direction). The maximum fetch lengths exceeding the minimal distance to the nearest forest edge were usually observed during the night under stably stratified atmospheric conditions. Taking into account the relatively small distance between the field station and the northern forest edge all fluxes measured under northern, north-eastern and north-western wind directions were filtered and removed to avoid any influence of surrounding forest on flux measurements.
Gap filling
Gaps in the NEE, LE and H measurement records were filled using two alternative approaches. The first approach used standard algorithms provided by the REddyProc online tool, which is based on procedures described by Reichstein et al (2005). The second approach was based on flux calculations using a process-based Mixfor-SVAT model (Oltchev et al 2002, Olchev et al 2008, 2015, Falge et al 2005). The main model advantage is its ability to describe both seasonal and daily patterns of CO2 and H2O fluxes of bare soil and different vegetation types including grassland, shrubs and forest taking into account individual structure, biophysical properties and responses of plant species to changes in environmental conditions. The model was validated using eddy covariance data measured under well-developed turbulent conditions and showed ability to adequately describe the vertical H2O and CO2 fluxes within the clear-cut area under various weather conditions. The modeling approach was applied for gap filling in periods with precipitation, dew, low turbulence, and in all cases when the fetch length came close or exceeded the distance between the station and forest edge in the upwind direction. The CO2 flux partitioning into gross primary production (GPP) and total ecosystem respiration (TER) was also estimated using both the REddyProc online software and the Mixfor-SVAT model.
Chamber measurements
Closed (non-steady state) chamber measurements were used to quantify the spatial variability in CO2 flux within the clear-cut. Additionally, they helped to verify the flux measurements provided by eddy covariance technique. Measurements were made during short-term field campaigns on five plots within the clear-cut that were characterized by different vegetation and soil properties. The measuring system consisted of the infra-red CO2 analyzer LI-840 (LI-COR Inc., USA) combined with a portable transparent hemispherical chamber. The soil surface area covered by the chamber was about 0.28 m2. The chamber was installed on a collar fixed to the soil. Chamber collars at each selected plot were installed in spring and not moved during the experiments. Collar-insertion depth was 15 cm. The CO2 fluxes were measured every week several times during daylight hours from the middle of May to the end of August 2016. The CO2 fluxes were calculated from the rate of CO2 concentration change inside the chamber during the 200 s time interval after chamber closure. For measurements of dark respiration, the measuring chamber was covered by a non-transparent, light-reflecting cover.
Modeling turbulent exchange under non-uniform land surface
To assess the possible influence of clear-cutting on wind and turbulence pattern within and around the harvested, as well as on the turbulent fluxes of CO2 and H2O at different levels above the ground surface, a 2D hydrodynamic turbulent transfer model was applied (Mukhartova et al 2015). The model is based on solution of the Navier-Stokes and continuity equations using the one-and-a-half order closure scheme (Garratt 1992, Panferov and Sogachev 2008, Olchev et al 2009). This scheme assumes more simplified description of the turbulence field relative to two or higher-order closure models (e.g. Katul and Albertson 1998). However, the combination of efficient description of airflow structure in the presence of vegetation with a reasonable number of input parameters and relatively low computational cost makes this approach sufficient enough for most practical tasks (Sogachev and Panferov 2006).
The averaged system of hydrodynamic equations used in the model to calculate the components of the mean wind velocity  in a two-dimensional domain
  ,
,  , where
  is roughness height, is written as (Levashova et al 2015)
where  —the horizontal coordinate,
  —the vertical coordinate,
  —the density of dry air, δP—the deviation of mean air pressure from the hydrostatic distribution,
  —the turbulent kinetic energy, K—the turbulent diffusivity,
  ,
,  —the virtual temperature,
  —the adiabatic temperature for dry air and
  —the viscous drag forces induced by the presence of vegetation.
The equation for heat transfer within and above a plant canopy is written as:
where T—the air temperature,  ,
,  —the specific heat of the air at constant atmospheric pressure,
  —the coefficient of turbulent thermal diffusion, and H—the sensible heat flux.
The net CO2 flux between the leaf interior and ambient air is described using an aggregated approach based on the model suggested by Ball et al (1987) in Leuning modification (Leuning 1995)
where Al—the leaf gross photosynthesis, Rl—the leaf dark respiration,  —the CO2 compensation point, Cs—concentration of CO2 near the leaf surface, gs—the leaf stomatal conductance, g0—value of gs at the light compensation point, Ds—the water vapor deficit, a1 and D0—empirical parameters. The model assumes exponential attenuation of solar radiation within uniformly structured forest canopy. The leaf stomatal conductance is considered as a function of incoming PAR and temperature of the ambient air. The soil CO2 emission is considered as a function of soil temperature and moisture. Moreover, it is assumed that the soil CO2 emission is depended on turbulent exchange rate near the soil surface.
Transfer equation for CO2 and H2O within and above a plant canopy is written as:
where q—the specific humidity, KC and Kv—the turbulent exchange coefficients for CO2 and H2O, FC—the sources/sinks of CO2 in vegetation, FS—emissions of CO2 from soil, EC, ES—the leaf transpiration and soil evaporation rates, LAD—the leaf area density. The leaf transpiration rate is depended on gs and leaf boundary layer conductance. Evaporation from the soil surface is calculated as a function of soil temperature and moisture.
All necessary input parameters describing the vegetation and soil processes were measured in the field or taken from the literature. The model validation was provided using the results of eddy covariance and chamber flux measurements at the clear-cut and two forest sites situated in the same forest region (Kurbatova et al 2008).
Modeling experiment scenarios
To quantify the possible effect of clear-cutting on turbulent exchange processes within and above a forest canopy the transect crossing the clear-cut from the south to the north and coincided with dominating wind direction in spring and summer was selected. The total length of this transect was about 640 m. The length of the transect part situated within the clear-cut was 265 m. The spatial wind and turbulence pattern, as well vertical CO2 and H2O fluxes, were simulated for different wind speeds and thermal stratifications of the atmospheric surface layer.
2. Results and discussion
Meteorological conditions
The weather conditions during spring and summer of 2016 were highly variable (figure 2(a)). The mean daily air temperature varied from 1.3 to 11.3 °C in April, between 8.2 and 18.6 °C in May, and between 12 and 24 °C in summer months. The mean summer temperature was 16.6 °C. A large amount of precipitation (121 mm in April – May and 280 mm in June – August) provided sufficient soil moisture conditions to prevent plant water stress during the entire measuring period (volumetric soil water content ranged between 0.35 and 0.43 m3 m−3).
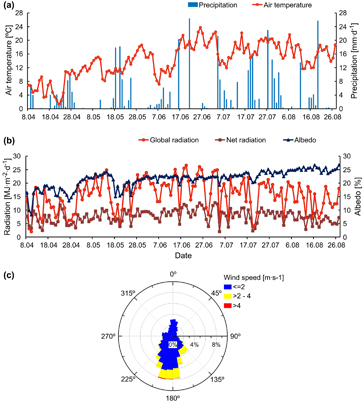
Figure 2. Temporal variability in key meteorological variables measured continuously during spring and summer 2016 in a recently clear-cut mixed spruce forest in western Russia. (a)—daily mean air temperature and total precipitation. (b)—daily global and net radiations, mean daytime albedo. (c)—wind direction and speed.
Download figure:
Standard image High-resolution imageIncoming solar radiation was influenced by cloud cover and varied between 1.9 and 24.2 MJ m−2 per day (figure 2(b)). The net radiation ranged between 2.3 and 11.8 MJ m−2 per day. Surface albedo gradually increased during the measurement period from 10% in April to 26% in August and depended mainly on ground surface vegetation, the ratio between diffuse and direct solar radiation, and the moisture of the upper soil horizon. In particular, our observations showed that the minimal surface albedo (8–13%) occurred on rainy days in spring prior to onset of vegetation growth.
The mean (±1SD) wind speed during the measurement period was relatively low (1.1 ± 0.8 m s−1). There were only several episodes when the 30-min average wind speed exceeded 4 m s−1. Wind-rose analysis (figure 2(c)) showed that the wind usually came from three main directions: south, south-east and north. Wind from the northern sector usually occurred at night and was characterized by relatively low speeds (<1 m s−1). Daytime winds were mainly from the south. Friction velocity (u*) varied over the day from 0.05 to 0.17 m s−1. Nocturnal u* values were close to 0.04 m s−1 and daytime values varied around 0.16 m s−1. Nights were usually characterized by very stable atmospheric conditions, with 35–50% of cases exhibiting a Monin–Obukhov stability parameter (1/L) less than −0.1. The atmosphere during the day was characterized by unstable (0.01 < 1/L <0.1) and very unstable (1/L > 0.1) conditions 45–55% and 30–50% of the time, respectively.
Turbulence and wind patterns within the clear-cut area
The clear-cut had a strong influence on air flow and turbulence patterns within and above the harvested area and the surrounding forest canopy (figure 3), as indicated by vertical profiles of wind speed components and turbulent exchange coefficients simulated using the 2D exchange model oriented along the dominant wind direction (south to north).
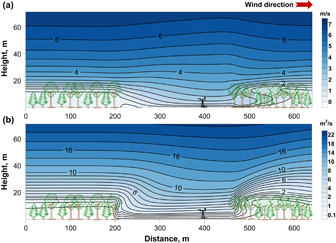
Figure 3. Modeled 2D pattern of (a) horizontal wind speed and (b) turbulent exchange coefficient along a transect crossing the clear-cut from south to north. Negative values for horizontal wind speed corresponded to reverse air flow.
Download figure:
Standard image High-resolution imageThe modeled recirculation zone, characterized by reverse air flow, was observed on the leeward side of the clearing and had a maximum length about 50–70 m, which under windy conditions did not influence the flux measuring system. The model indicated that the eddy covariance flux measurements made at 2 m height were not significantly influenced by the surrounding forest when winds were from the south at speeds greater than 0.4 ms−1 and the atmosphere was neutral or unstable.
These simulation results agree well with several prior studies. For instance, Frank and Ruck (2008) modeled airflow in a large forest clearing (clearing width / mean tree height ≈ 9) and found that the largest effect of forest clearing on air flow near the ground surface occurred along the windward forest edge, with less effect on the leeward forest edge. Furthermore, their model indicated that the general flow pattern was not significantly influenced by clearing shape, which is an important conclusion for our study given the complex shape of the clear-cut that we examined. Similar results were obtained by Panferov and Sogachev (2008), who examined the influence of forest gap size on risk of wind damage.
The consistent influence of forest clearing on wind speed and turbulence patterns among different modeling approaches suggests that these results are robust.
Eddy covariance measurements of H and LE
The temporal patterns of H and LE fluxes during the measurement period were characterized by substantial variability (figure 4(a)). Soil moisture was sufficient during the entire measurement period and changes in H and LE were mainly governed by surface net radiation and the amount of ground surface vegetation growth within the clear-cut after the second part of May. The mean daily LE was about 2.0 MJ m−2 d−1 in spring, reached 8–10 MJ m−2 d−1 in June and decreased slightly in August to 6–8 MJ m−2 d−1. Daily H was often negative (around −0.2 MJ m−2 d−1) during the first part of April when conditions were cold, net radiation was low, and energy could have been expended heating soil and thawing ice. Maximum daily H (up to 7 MJ m−2 d−1) was observed in May during periods with sunny weather and then gradually declined during July and August while the LAI of ground vegetation simultaneously increased.
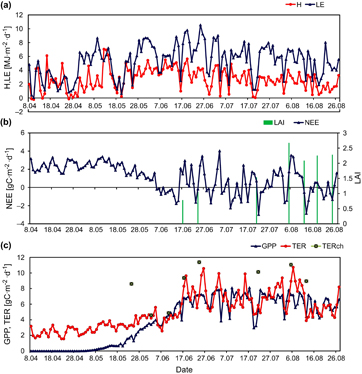
Figure 4. Temporal variability of daily (a) H, LE, (b) NEE of CO2, and (c) GPP and TER measured using eddy covariance in a recent clear-cut. Green columns in (b) show the temporal variation of LAI. Black points in (c) indicate the TER measured using the chamber method (TERch).
Download figure:
Standard image High-resolution imageThe Bowen ratio (β = H/LE) was mainly influenced by temporal LAI dynamics of ground surface vegetation and dropped from 1.0 to 0.7 between April and May, then declined to 0.5 during summer.
Humphreys et al (2005) in Quebec, Canada, found a much lower rate of vegetation regeneration after clear-cut. The LAI of pioneer and understory species in the clear-cut during the first year was only 0.2 m2 m−2, with LAI then increasing to ∼2.5 m2 m−2 three years following harvest. Dense vegetation cover can decrease dependence of β on soil moisture. In particular, measurements of β by McCaughey and Brintnell (1984) at a logged site in Ontario, Canada, indicated a relatively weak dependence of β on soil moisture. Daytime β values were about 0.5 under moist soil conditions and 0.8 under dry conditions.
Eddy covariance measurements of NEE of CO2
The CO2 flux measurements showed that the clear-cut was a source of CO2 from the beginning of April to the first part of June (figure 4(b)). Daily NEE rates were mainly influenced by temperature conditions and ranged between 1.5 and 3.5 gC m−2 d−1. The day-to-day variability in NEE was considerably higher from mid-June through August, potentially because of the photosynthetic activity of herbs, shrubs, and juvenile trees that remained after tree felling and began intensive growth starting the middle of May. The daily NEE values ranged around 'zero' balance from +4.0 (CO2 source) to −3.0 gC m−2 d−1 (CO2 sink) depending on solar radiation, temperature and soil moisture conditions. The daily CO2 flux averaged for the entire measuring period was 1.0 ± 3.8 gC m−2 d−1. Total CO2 flux for the first five months after tree felling (from April to August 2016) was about 155 gC m−2, indicating that the site was a source of CO2 to the atmosphere. The temporal GPP pattern was mainly governed by LAI variability of herbaceous and shrub vegetation (figure 4(c)). Daily GPP reached maximal values in the end of June - beginning of July (up to 8.0 gC m−2 d−1). August GPP values didn't exceed 6.0–7.0 gC m−2 d−1. Minimum TER was observed in spring (< 4.0 gC m−2 d−1) when the soil respiration was strongly suppressed by low soil temperatures. Spring TER was always higher than GPP and increased to upwards of 10.0 gC m−2 d−1 during July and August.
The diurnal pattern of NEE had a clear variation governed mainly by solar radiation and temperature conditions and the amount of ground vegetation. During the night NEE was always positive (CO2 source) (figure 5(b)). NEE was mainly negative (CO2 sink) during the day following onset of intense growth and photosynthesis by herbaceous species, low-growing shrubs and juvenile trees in the second part of May and reached maximum absolute values shortly before noon.

Figure 5. Diurnal variability in mean (a) Rn, H, LE and G, (b) as well as NEE of CO2, GPP and TER in August 2016. Vertical whiskers indicate plus or minus one standard deviation.
Download figure:
Standard image High-resolution imageTo verify the CO2 fluxes derived from eddy covariance measurements they were compared with CO2 fluxes measured using portable chambers. Very high temporal variation of solar radiation during the periods of chamber flux measurements resulted in relatively high variability of measured NEE rates that does not allow for representative comparison with eddy covariance fluxes. We therefore compared TER measured by the eddy covariance against TER measured using the mobile chamber system (TERch). TERch was mainly governed by temperature conditions and it was non sensitive to solar radiation fluctuations. The results of these TERch measurements provided from the second part of May to the end of August and showed in figure 4(c) indicate a gut agreement with TER values derived from eddy covariance data. Differences are likely due to significant heterogeneity of soil and vegetation cover within the clear-cut. The soil surface in some plots selected for chamber measurements was covered by a large amount of litter and logging residues, while the soil surface in other plots was damaged by forest logging machines.
The temporal variability in NEE, GPP and TER that we observed is consistent with studies focused on clear-cuts in other geographical regions. In particular, Humphreys et al (2005) found that summer NEE in a fresh, grassy clear-cut was about −2.0 gC m−2 d−1 under similar meteorological conditions, while TER was around 4.5 gC m−2 d−1. Similarly, Rannik et al (2002) found that mean summer NEE was about −4.0 gC m−2 d−1 in a recently harvested Scots pine forest in Finland. Difference in NEE and TER among recent clear-cuts with similar vegetation cover is likely due to differences in both environmental conditions (e.g. temperature, soil conditions) and specific logging methods. In particular, a large amount of litter and logging residue remained on the ground after clear-cutting in Russia, which gradually decomposes and is emitted as CO2 from the ecosystem into the atmosphere.
Model estimation of clear-cutting effects on vertical CO2 and H2O fluxes
For our modeling experiment we selected 8 May 2016 as a typical day with sunny weather, moderate wind, and neutrally stratified boundary layer. Intensive leaf development in the surrounding forest finished during the beginning of May, during which time there was little occupation of the clear-cut by herbaceous vegetation and juvenile trees. Such weather conditions and contrasting vegetation structure between the clear-cut and surrounding forest allow us to highlight the maximum effects of the clear-cut on atmospheric fluxes.
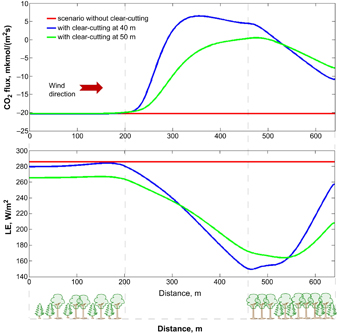
Analysis of modeled H2O and CO2 fluxes above the forest canopy along the transect crossing the clear-cut area from south to north at different levels above the forest canopy shows significant impact of the clear-cut on vertical atmospheric fluxes (figure 6). The effect of clear-cutting manifested both above the clear-cut itself and also very strongly above the downwind part of the surrounding forest. In particular, the model predicted a small reduction in the magnitude of vertical fluxes along the transect and elongation of the perturbed area from downwind from the clear-cut.
Figure 6. Modeled CO2 and LE fluxes above the forest canopy along the transect crossing the clear-cut area from south to north. Flux calculations were provided for a noon on a sunny day (08 May 2016) at two levels above the forest canopy within the atmospheric surface layer (40 and 50 m above a ground surface). Red lines indicate potential fluxes of undisturbed forest (i.e. before clear-cutting). It was assumed in numerical experiments that the structure and species composition of fallen forest was similar to surrounding forest stands.
Download figure:
Standard image High-resolution image
The effect of the clear-cut on atmospheric fluxes increased drastically when the atmosphere was unstable (i.e. modeling experiments that over-heated the soil surface within the clear-cut).
The large horizontal heterogeneity of atmospheric fluxes even in the case of a relatively large clear-cut (3.6 ha) makes it clear that measuring atmospheric fluxes over highly heterogeneous landscapes with complex topography and mosaic vegetation cover remains a challenge.
3. Conclusion
Field measurements in a new clear-cut showed rapid changes in energy (H, LE) and carbon (NEE of CO2, GPP, TER) fluxes during spring and summer 2016 that were governed mainly by atmospheric conditions and vegetation regrowth. Effects of the surrounding forest on air flow and turbulent exchange within the clear-cut were examined using a 2D process-based turbulent exchange model and found to be minimal. On the other hand, the model indicated that the clear-cut caused large heterogeneity in vertical turbulent exchange both above the clear-cut itself and the downwind forest. The clear-cut was a source of CO2 to the atmosphere during spring (NEE > 0 gC m−2 d−1), though onset of herb, shrub and juvenile tree growth in mid-May led to GPP roughly balancing TER (NEE ≈ 0 gC m−2 d−1). β was around 1 during early spring, but declined to around 0.5 during summer when daily LE tended to exceed H. Our results agreed well with carbon dioxide and energy fluxes measured in clear-cuts in other geographical regions despite differences in meteorological conditions, vegetation, soil, and instrumentation. Combining eddy covariance and chamber flux measurements with 2- or 3-D atmospheric modeling provides a useful approach for evaluating the effects of forest management and disturbance on ecosystem carbon and water fluxes in non-uniform forest landscapes.
Acknowledgments
This study was supported by a grant from the Russian Science Foundation (14-14-00956) and was associated with the Northern Eurasian Earth Science Partnership Initiative (NEESPI). We thank Dr Logan T Berner from Oregon State University (USA) for providing feedback and English edits on the manuscript.