
Abstract
Soil microbes play a key role in nutrient cycling and carbon sequestration. Global change can alter soil microbial population composition and behavior. Biochar addition has been explored in the last years as a way to mitigate global warming. However, responses of microbial communities to biochar addition in particular in relation to abiotic disturbances are seldom documented. An example of these disturbances, which is predicted to be exacerbated with global warming, is regional drought. It has been known that fungal-based food webs are more resistant to drought than their bacterial counterparts. Our study found that biochar addition can increase the resistance of both the bacterial and fungal networks to drought. Contrary to expected, this result was not related to a change in the dominance of fungal or bacteria. In general, soil amended with biochar was characterized by a faster recovery of soil microbial properties to its basal values. Biochar addition to the soil also suppressed the Birch effect, a result that has not been previously reported.
Export citation and abstract BibTeX RIS

Content from this work may be used under the terms of the Creative Commons Attribution 3.0 licence. Any further distribution of this work must maintain attribution to the author(s) and the title of the work, journal citation and DOI.
1. Introduction
Biochar, the product of pyrolysis of biomass, has been a subject of an increasing number of articles, mainly fueled by its potential to increase agronomic crop yields and to mitigate global warming. In the last years there is a rising body of work quantifying the effect of different types of biochars with respect to their influence in greenhouse gas fluxes, including CO2, CH4 and N2O, from soils (Spokas and Reicosky 2009). Most of these studies show a promising possibility to use biochar to diminish greenhouse gas emissions in agroecosystems (Spokas and Reicosky 2009, Méndez et al 2012, Paz-Ferreiro et al 2012).
However, more complicated feedbacks mechanisms consequence of the interaction between abiotic factors and biotic communities have largely been ignored. As an example, it has been reported that microbial population biochar mediated changes could be, at least to some extent, responsible for changes in plant resistance to stress (Elad et al 2011, Viger et al 2014).
There are other potential soil-atmosphere feedbacks linked to biochar utilization that remain largely unexplored. As an example of these feedbacks, Meyer et al (2012) quantified the albedo reduction caused by biochar application to the soil. The analysis provided by their model resulted in a 13–22% reduction on the mitigation of warming by biochar compared to the results disregarding the albedo effect.
In addition to this, alterations in the precipitation patterns as global change intensifies will be one of the biggest threats over the present century. A predicted consequence of this, so called, intensification of the global water cycle (Huntinton 2006) will be extreme events of drought and humidity increasing its frequency of occurrence in different areas of the globe, including the tropical and subtropical areas (Lintner et al 2012). Nowadays, it is known that land use can alter the resistance and resilience of the soil microbial and faunal communities to drought (de Vries et al 2012). In particular, slow-growing organisms such as fungi tend to be more resistant but less resilient than fast growing-organisms. This means that fungi have a greater ability than bacteria to withstand a disturbance, but they have a lower rate of recovery. However, the effect of biochar in these parameters, resistance and resilience of the soil microbial community, has not been to date the object of research. In our work we hypothesize that biochar amendment will not only alter soil microbial communities, as proved recently in other studies (Paz-Ferreiro et al 2014) but will also affect the resistance and resilience to drought of these populations.
2. Material and methods
Soil (an Acrisol) was collected at Heshan Hilly Land Interdisciplinary Experimental Station, Chinese Academy of Sciences in Guangdong Province, China, located at 22°41'N and 112°54'E in September of 2013. The climate of the region is subtropical monsoon with a mean annual precipitation of 1700 mm and a mean annual evapotranspiration of 1600 mm. Precipitation mainly occurs in the rainy season from April to September. The mean annual temperature is 21.7 °C with a mean maximum monthly temperature of 29.2 °C in July and a mean monthly minimum of 12.6 °C in January. The soil has a sandy-clay-loam texture, a pH (1 : 2.5 soil : deionized water ratio) of 4.3. Total C and total N contents were determined with a vario ISOTOPE CUBE elemental analyzer (elementar, Germany). Electrical conductivity was determined as a measure of soil salinity using a ratio 1 : 2.5 soil : deionized water ratio and then measured with a Crison 222 conductivimeter. Soil nutrients (P, Ca, Mg and K) were determined following a Mehlich 3 extraction and determined by ICP-AES. See table 1 for the values of these properties. The predominant clay-size mineral fraction in the soil was kaolinite, followed by gibbsite, goethite and hematite.
Table 1. General characteristics of the soil and the soil amended with biochar at the end of the experiment.
| Control | Soil with biochar | |
|---|---|---|
| Available P (mg kg−1) | 13.3 ± 5.4 | 103.5 ± 7.4 |
| K (mg kg−1) | 83.4 ± 6.6 | 1147.2 ± 144.4 |
| Ca (mg kg−1) | 236.0 ± 71.6 | 1903.2 ± 139.7 |
| Mg (mg kg−1) | 12.2 ± 1.8 | 221.7 ± 25.9 |
| pH (water) | 4.3 ± 0.1 | 6.4 ± 0.2 |
| pH (KCl) | 3.8 ± 0.1 | 6.0 ± 0.2 |
| Electrical conductivity (μS cm−1) | 12.3 ± 0.5 | 58.3 ± 7.0 |
| Total C (%) | 2.01 ± 0.06 | 2.70 ± 0.14 |
| Total N (%) | 0.220 ± 0.024 | 0.264 ± 0.046 |
Samples were taken from the 0–10 cm depth using a trowel and immediately passed through a 2 mm sieve in the field-moist state. It was then mixed and split into subsamples for a pot experiment.
The biochars was prepared from poultry litter at a final temperature of 400 °C and heating at rate of 10 °C min−1 in the same way as described by Gascó et al (2012). The final temperature was maintained for 2 h. Poultry litter was collected at the Experimental Poultry Farm of South China Agricultural University (23° 09' N and 113° 21' E) located at Guangzhou, China. Chicken at this facility are organically bred and fed with a mixture of corn, wheat bran and soybean pulp. After collection, litter was dried in an oven (70 °C) for 24 h and sieved to 1 mm. This biochar has been used before in other experiment and was selected for this investigation due to its previously reported ability to increase crop yields (Lu et al 2014). The biochar used in this experiment had an alkaline pH with a value of 10.0 as determined with the same method than for the soil. The total carbon content of the biochar was 16.77% while its total nitrogen content was 1.37%. This resulted in a C/N ratio of 12. Proximate analysis was calculated by thermogravimetry using a Labsys Setaram equipment. Samples were heated up to 600 °C under an N2 atmosphere at a flux of 40 mL min−1 using a heat rate of 20 °C min−1. Volatile matter (VM) was determined as the weight loss from 120 °C to 600 °C. At 600 °C, air flux was introduced until a constant weight was reached and ashes were determined as the final weight of the samples. Fixed carbon (FC) was calculated by difference. Proximate analyses revealed an ash content of 74.95%, VM of 7.66% and FC of 17.39%. Biochar nitrogen adsorption analysis to determine BET surface was carried out at 77 K in a Micromeritics Tristar 3000 (Instituto de Catálisis y Petroquímica, CSIC, Spain). The surface area of the biochar was 7.418 m2 g−1. Dissolved organic carbon in the biochar was determined using a 1:10 biochar:deionized water ratio and had a value of 281 mg kg−1.
In September of 2013, a mesocosm using a fully replicated randomized experiment was set up in a greenhouse in South China Botanical Garden. The experiment had four replicates per treatment. Each of the 16 mesocosms involved in the experiment consisted of a pot filled with 500 g of soil. The soils were adjusted to a humidity content of 60% of field capacity and watered daily to account for moisture losses. Biochar was added at a rate of 3% (w:w) to half of the pots. The soils were allowed to equilibrate for 1 month after mixing with biochar. After one month, eight of the sixteen soil samples were dried to 10% of water holding capacity (WHC) and maintained that humidity level for a week. Then, soils were re-wetted at 60% WHC. Eight of the sixteen soil samples were used as a control and were not submitted to a drying-rewetting cycle.
Microbial properties were determined after 1 month of equilibration, the last day of the one week drying period (prior to re-wetting), and 1 day, 5 days and 21 days after re-wetting.
Soil respiration was determined after incubation of the samples for 1 h in the presence of NaOH, which was later titrated using HCl.
Enzyme activities were assayed in triplicate using published protocols which are described by Paz-Ferreiro et al (2014) for β-glucosidase, β-glucosaminidase and phosphomonoesterase. CM-cellulase activity was determined after incubating the samples with a 7% solution of carboxymethil-cellulose as substrate and incubating for 24 h in a 2 M acetate buffer (pH 5.5) at 50 °C h and assessing the released reducing sugars following the method of Schinner and von Mersi (1990). All enzyme concentrations were determined by reference to standard curves as described by Paz-Ferreiro et al (2012).
Microbial community structure was assessed by analyzing the composition of extractable ester-linked PLFAs, using the method was described by Bossio and Scow (1998). Concentrations of individual PLFAs were calculated based on 19 : 0 internal standard concentrations. The indicator PLFAs were used for classification of microbial community types.
The fatty acids i15:0, a15:0, i16:0, i17:0, a17:0, cy17:0, 18:1ω7, 18:1ω5 and cy19:0 were chosen to represent bacterial PLFAs and 18:2ω6 was used as an indicator of fungal biomass (Frostegård and Bååth 1996). Actinomycetes were represented by 10Me16:0, 10Me17:0 and 10Me 18:0 (Frostegård and Bååth 1996) while arbuscular mycorrhizal fungi (AMF) were indicated by 16:1ω5c (Olsson 1999).
Resistance index (RS) and resilience indices (RLt) were calculated as in Orwin and Wardle (2004):
 , being C0 the value of the control at the end of the disturbance and│D0│ the absolute difference between the control and the disturbed soil.
 , being │Dx│ the absolute difference between the control and the disturbed soil at time x.
To analyze the results a one-way ANOVA was conducted using SPSS 15.0. The factor studied in the one-way ANOVA was treatment (control versus biochar addition. Treatments were considered to differ statistically at P < 0.05.
3. Results and discussion
Several studies have demonstrated that soil drought is an important stress for soil biota and can lead to the death of sensitive soil microorganisms. However, these microorganisms can also react to disadvantageous conditions forming spores or adapting to the new surroundings, which could be done building-up compatible substrates (Schimel et al 2007). In our study, we found that soil microbes were seriously altered by drought (see supplementary material).
Biochar addition resulted in a significant increase in the resistance to drought of the fungal community and bacterial communities and the enzymes cellulose, β-glucosidase and phosphomonoesterase (see table 2).
Table 2. Values of resistance to drought for the amended and unamended soil (n = 4 replicates per treatment) obtained prior to re-wetting.
| Variable | Control | Soil with biochar | F (P) |
|---|---|---|---|
| Respiration | 0.14 ± 0.08 | 0.08 ± 0.02 | 3.076 (0.120) |
| Microbial biomass C | 0.11 ± 0.03 | 0.12 ± 0.04 | 0.429 (0.537) |
| AM fungi | 0.63 ± 0.24 | 0.74 ± 0.30 | 0.833 (0.397) |
| Actinomycetes | 0.64 ± 0.23 | 0.73 ± 0.33 | 1.485 (0.269) |
| Bacterial biomass | 0.39 ± 0.12 | 0.75 ± 0.03 | 56.723 (<0.001) |
| Fungal biomass | 0.51 ± 0.07 | 0.78 ± 0.04 | 52.227 (<0.001) |
| Cellulase | 0.28 ± 0.08 | 0.58 ± 0.12 | 16.667 (0.006) |
| β-glucosidase | 0.37 ± 0.11 | 0.73 ± 0.21 | 79.253 (<0.001) |
| β-glucosaminidase | 0.44 ± 0.07 | 0.40 ± 0.12 | 0.369 (0.536) |
| Phosphomonoesterase | 0.22 ± 0.05 | 0.69 ± 0.08 | 30.301 (0.002) |
The response of bacteria to drought was more intense than that of fungi, for both the control and the biochar amended soil. It is well know that bacteria show more inhibition compared to fungi after a water stress, a result that has been reported before (Kilham 1994, Bapiri et al 2010, de Vries et al 2012). Our most important and striking result is that biochar seems to offer an additional protection for both bacterial and fungal communities, when compared to the control soil. Our main hypotheses regarding this observation are that firstly, biochar is a highly porous material that can increase the habitats suitable for microbial and fungal colonization. This would be specially the case of bacteria, as they tend to live in smaller pores (typically in pores with a diameter of 0.15–4 μm) compared to fungal hyphae (3–8 μm) (Killham 1994). Smaller pore sizes, suitable for bacterial colonization, are more abundant in biochar. Secondly, biochar can improve soil aggregation, which is known to host a higher number of fungi (Kong et al 2011). Moreover, drying and wetting generally results in the disruption of macroaggregates (Denef et al 2001), a process that can be inhibited by the presence of biochar. Thirdly, biochar addition can improve water retention) providing a better medium to microbial and fungal growth, but exceptions are present (Méndez et al 2012). Finally, the biochar used in our experiment had a high mineral content and DOC contents, which could have acted as a substrate thus promoting a quicker recovery of soil properties to its basal state.
Biochar did not change the fungal to bacterial ratio in a significant way (data not shown), which has been reported as a factor increasing the resistance of soil microbial communities to stress (de Vries et al 2012). Biochar addition resulted in an alteration of soil pH of 2.1 units (see table 1) and it is a well known fact that elevated pH favors bacterial over fungal communities (Rousk et al 2009). A move towards bacterial dominated food webs could have been expected in a more alkaline environment; however it is possible that this particular biochar is providing a more adequate source of carbon for fungi rather than for bacteria, a process that in consistent with previous reports (Steinbeiss et al 2009). On the other hand, research involving biochar and measuring N2O emissions (Cayuela et al 2013) or heavy metal bioavality (Lu et al 2014) have used liming controls and demonstrated that biochar effects are only partly mediated by alterations in soil pH.
Soil respiration was more affected by drought stress than other properties analyzed such as soil enzymes. The strong inhibition of soil respiration reported in our study is comparable to the results found by others (Yu et al 2014). The fact that respiration exhibited a much stronger response to stress than soil enzymes can be attributed to the later having an extracellular component than can be stabilized in the soil colloids or clay particles (Paz-Ferreiro and Fu, in press). Rewetting a dry soil also results in a pulse of respiration with a rate that exceeds the basal respiration for the moist soil. This is known as the Birch effect (Birch 1958). The pulse is transient, with values of respiration converging in time with the basal rate. In our study we found that the Birch effect was more pronounced for the control soil than for the soil amended with biochar. This can be seen in figure 1 as negative values of resilience indicate a pulse of CO2, while values of resilience between 0 and 1 indicate a lower respiration than that of the undisturbed soil. The recovery of soil respiration to its basal value was also quicker in the biochar amended soil than in the control soil. We found that the pulse of respiration generated was uncoupled from the enzymatic or microbial growth, a result which is similar as reported previously by other authors (Meisner et al 2013).
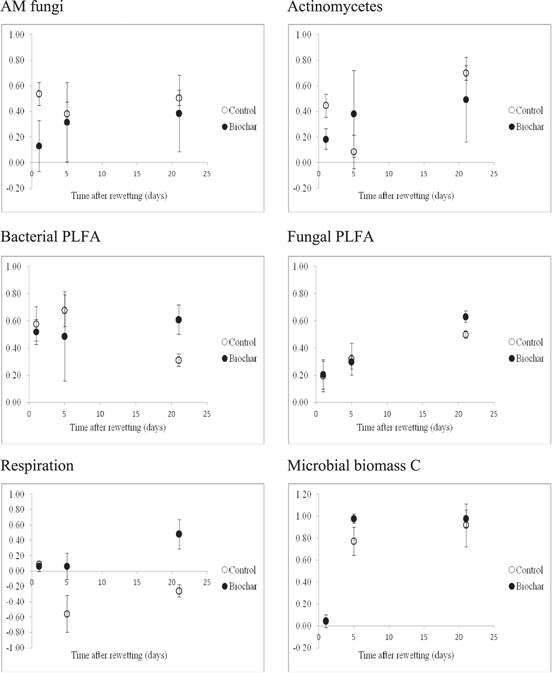
Figure 1. Resilience indices for soil AM fungi, actinomycetes, fungal PLFA, bacterial PLFA, soil microbial biomass and soil basal respiration.
Download figure:
Standard image High-resolution imageSoil enzymes are indicators of soil quality, but they can also respond to abiotic factors, such as changes in soil temperature or humidity (Paz-Ferreiro et al 2012). The response of soil enzymes to drought has not been previously documented for biochar amended soils. The resistance and resilience indices can be seen in table 1 and figure 2, respectively. It is known that soils amended with more labile carbon sources such as compost exhibit a greater resistance to drought, which has been also attributed to an increase in pore volume (Hueso et al 2011). The results that we obtained for the hydrolases in our study can be attributed both to an increase in the pore volume and to the incorporation of some labile substrate with the biochar.

Figure 2. Resilience indices for soil enzymes.
Download figure:
Standard image High-resolution image
It is also important to note than biochar is a word to define materials prepared under very different conditions and using a variety of feedstocks. In general, most biochars have a higher C/N ratio than the biochar used in our study. In this sense our biochar had a C/N ratio of 12, while most biochars tend to have higher C/N ratios (see for example Tsai et al 2006). A high C/N ratio could result in the dominance of fungal based decomposition pathways, which as shown before are more resistant to drought. Thus, although experimental work should be done to confirm our results in a variety of agroecosystems and in relation to the use of other biochar materials, we could expect that biochar addition to soil can result in an increased resistance of the microbial community to drying rewetting disturbances.
Our most important conclusion is that biochar addition can alter the resistance and resilience of soil microbial properties to water stress and this process is mediated by changes in the soil microbial and fungal communities. The universality of these findings should be assessed as the biochar used in this experiment had significant amounts of P and other nutrients, which are common in sludge or manure derived biochars but absent in woody derived biochars. Thus, further research should validate our results using biochars with contrasting characteristics. In addition it will be necessary to elucidate the mechanisms involved in the response of soil microbial communities reported in our study.
Acknowledgements
The authors wish to thank two anonymous reviewers for their useful suggestions to improve a preliminary version of this article. This work was funded by National Basic Research Program of China (2011CB403204), the Strategic Priority Research Program of the Chinese Academy of Sciences (XDA05070301), and the National Natural Science Foundation of China (No.31210103920, U1131001, 30925010). J. Paz-Ferreiro acknowledges the support from the Chinese Academy of Sciences (fellowship for young international scientists number 2012Y1SA0002).