
Abstract
Nitrogen (N) is crucial for crop productivity. However, nowadays more than half of the N added to cropland is lost to the environment, wasting the resource, producing threats to air, water, soil and biodiversity, and generating greenhouse gas emissions. Based on FAO data, we have reconstructed the trajectory followed, in the past 50 years, by 124 countries in terms of crop yield and total nitrogen inputs to cropland (manure, synthetic fertilizer, symbiotic fixation and atmospheric deposition). During the last five decades, the response of agricultural systems to increased nitrogen fertilization has evolved differently in the different world countries. While some countries have improved their agro-environmental performances, in others the increased fertilization has produced low agronomical benefits and higher environmental losses. Our data also suggest that, in general, those countries using a higher proportion of N inputs from symbiotic N fixation rather than from synthetic fertilizer have a better N use efficiency.
Export citation and abstract BibTeX RIS

Content from this work may be used under the terms of the Creative Commons Attribution 3.0 licence. Any further distribution of this work must maintain attribution to the author(s) and the title of the work, journal citation and DOI.
Changes were made to this article on 24 June 2015. Supplementary files S2 and Annex 2 were corrected owing to an error in the presentation of the results of Belgium and Denmark, which showed the results of Bangladesh instead of the real calculated data.
1. Introduction
Although malnutrition has not receded in absolute terms, world agriculture, in the past half century, has succeeded in increasing its production of vegetal proteins by a factor of 3 (Lassaletta et al 2014a). This has been made possible by changes in cropping systems generally referred to as the Green Revolution, based on the adoption of improved crop varieties, use of pesticides, and increased application of synthetic fertilizers, among which nitrogen was by far the most crucial (Tilman et al 2002, Mueller et al 2012, Sinclair and Rufty 2012). The flipside of the coin, however, is an increased alteration of surface and groundwater resources, coastal eutrophication, air pollution and increased greenhouse gas emission (Billen et al 2013, Sutton et al 2013). From this perspective, very different situations exist, linked to the disparity of cropping system development in the countries and regions of the world (Billen et al 2014).
It is the purpose of this paper to describe these issues, based on an original analysis of the data available in the FAO data base since 1961 (www.faostat.fao.org). Our approach is based on the calculation of the various components of the arable soil budget of 124 countries and, most importantly, on the description of the trajectory drawn from 1961 to 2009 by these countries in terms of their total crop production (Y, expressed in harvested vegetal protein, kgN ha–1 yr–1) and the total N inputs onto cropland (F), excluding permanent grassland, in the form of synthetic fertilizers, manure, symbiotic fixation and atmospheric deposition  . This approach differs from, and is complementary to the Net Anthropogenic Nitrogen Input or NANI approach (Howarth et al 2012). Our aim is to analyze cropping systems and to evaluate the excess N application on arable land, the most sensitive components of agricultural systems, while the NANI approach deals holistically with the complete N cycle at the country scale, including the livestock compartment and the effect of agricultural commodity trade (Swaney et al 2012, Lassaletta et al 2014b).
Using a different approach, Conant et al (2013) have recently created a global soil N input database that enables evaluation of trends in nitrogen use and recovery by country for a number of important crops over the last 40 years. Their data show that differences in efficiency of N use between OECD and other countries have persisted and exhibit no sign of convergence. In this paper we use the concept of the yield-fertilization relationship in an original way compared to the concept commonly used, relating here the mean yield integrated over the entire crop rotation to the total fertilization of the cropland soils of a given territory. While the yield-fertilization relationship is normally used in conventional agronomy as a tool to predict the yield increase of a given crop that could be expected from increasing fertilization in a given pedo-climatic context, we consider the integrative values of Y and F as overall indicators of the agronomical and environmental performances of a cropping system: the Y/F ratio is a measure of its nitrogen use efficiency (NUE), while the F-Y difference is the regional N surplus (or N balance) representing the potential for hydrological or gaseous losses of nitrogen to the environment.
2. Methods
Based on FAO data, we have reconstructed the trajectory followed by 124 countries in the past 50 years, in terms of crop yield (Y refers to harvested crop part and is expressed in kgN ha–1 yr–1) and total nitrogen inputs to cropland (F, sum of nitrogen in manure, synthetic fertilizer, symbiotic fixation and atmospheric deposition, in kgN ha–1 yr–1) for the 1961–2009 period. Together these countries represent 99.2% of the world population and 99.6% of the cropland surface in 2009 (see supplementary material S1, available at stacks.iop.org/ERL/9/105011/mmedia, for detailed methodology).
Total annual crop production by each country was calculated taking into account the yearly harvested yield of 178 primary crops and their N content, as reported in Lassaletta et al (2014a). The cropland surface was estimated by summing up the surfaces of all individual crops. Only in the cases where this sum was higher than the stated value of the 'arable land and permanent crops' surface area provided by the FAOstat resources module, the latest surface area was retained. This procedure allowed avoiding discrepancies in the FAO data base. (See S1 for details).
Total fertilization of cropland was defined as the total N input in the form of synthetic fertilizers, symbiotic N fixation, manure application and atmospheric deposition onto cropland, excluding permanent grassland. The reason for focusing our analysis on cropland is that the fate of the agricultural surplus (excess N input over N export by plant harvest) strongly differs between cropland and permanent grassland, particularly with respect to the relative proportions of NH3 volatilization, denitrification, leaching and storage in the soil organic pool (Velthof et al 2009, Billen et al 2013). Note that temporary grassland (e.g. the FAOstat crop category 'Grasses Nes for forage;Sil'), included within crop rotations, are considered as cropland. Yearly data on synthetic N fertilizer application, under different N forms, for the entire period were obtained from the Resources module of the FAOstat database. Countries with more than 15 missing annual data were removed from the analysis. Occasional gaps were filled with data from the International Fertilizer Industry Association (www.fertilizer.org/) if available and if not, by using figures of the closest years. FAO data on annual per country synthetic fertilizer use refer to total use in agriculture and is provided without distinction between arable and grassland. We therefore had to subtract from these figures the proportion used for grassland fertilization, which in some European countries such as Ireland and the Netherlands accounts for a significant proportion. We have estimated the proportion of synthetic fertilizers to grasslands at the country scales processing the information compiled from different sources (Richard 1951, Power and Alessi 1971, Anonymous 1992, FAO 2006, Heffer 2013) (see S1 for details).
To estimate the crop biological nitrogen fixation by fixing crops included in the FAOstat database we used a yield-based approach, assuming that crop yield is the factor that best aggregates variables associated with crop, soil and climatic conditions including available N, soil moisture, vigor of stand, and other management factors influencing N2 fixation:

where %Ndfa is the percentage of N uptake derived from N fixation, Y is the yield (expressed in kgN ha–1 yr–1), NHI is the N harvest index, defined as the ratio of the harvested material to the total above-ground N production, and BGN is a multiplicative factor expressing the total N2 fixation including below-ground contributions associated with roots, nodules and rhizo-deposition via exudates and decaying root cells and hyphae. These parameters have been obtained from different sources (Herridge et al 2008, Salvagiotti et al 2008, Laberge et al 2009, Kombiok and Buah 2013, Álvarez et al 2014, Anglade et al under review). We applied a regional %Ndfa for soybean N fixation. For sugar cane, rice, paddy and forage products, we applied a constant rate of biological fixation per hectare, as suggested by Herridge et al (2008) (see S1 for details).
To estimate the animal excretion factors, we have followed the methodology of Sheldrick et al (2003) that assumes that excretion rates, within a given livestock category, are proportional to the slaughtered animal weights. We have calculated different ratios for dairy and for other cattle stocks using the dairy stocks provided in the FAOstat 'livestock primary' module. These stocks have been subtracted from the total cattle stock to estimate non-dairy cattle. As a result, a particular excretion factor has been applied to each type of animal, country and year. The proportion of N excreted that is finally used as manure applied onto cropland was taken from the estimates of Sheldrick et al (2003) at the regional level for each type of animal. It was considered that 30% of the available manure is lost during management and storage before reaching the crop, as proposed by Oenema et al (2007) for Europe and close to the value estimated by Liu et al (2010) at the world scale. We finally discount the amount of N that is applied to permanent grasslands by applying the proportions provided by regions, and in some cases at the country scale, by Liu et al (2010) (see S1 for details).
Deposition of oxidized and reduced nitrogen compounds onto croplands was calculated from the GlobalNEWS database (Seitzinger et al 2010) by extrapolating linearly between available years. The atmospheric deposition data used in GlobalNEWS are derived for the year 2000 from Dentener et al (2006) and previous figures were obtained by scaling deposition fields for this year following Bouwman et al (2009). We calculated the input of N per ha (yearly national average) and we applied this input per ha into the surface of cropland considered in this study (see S1 for details).
3. Results and discussion
3.1. Y versus F trajectories of world agricultures
The trajectory followed from 1961 to 2009 by a number of countries in terms of crop yield and total N inputs into cropland is shown in figure 1. The results for all countries of the FAO data base are provided in supplementary material (S2). The Y versus F trajectory drawn by most countries shows, at least for periods of several decades, a distinct curvilinear relationship. Linear trajectories, like those described by de Wit (1992) for individual crops were seldom observed. Several mathematical formulations of the yield-fertilization relationship in a given pedo-climatic and technical-agronomical context have been proposed in the agronomical literature, most of them involving negative exponential functions (Llewely and Featherstone 1997, Harmsen 2000). Nijland et al (2008) proposed to integrate the production functions of Liebig, Mitscherlich and Liebscher (de Wit 1992) into one system model based on Michaelis−Menten hyperbolic relationships. Because we are expressing both output and input in exactly the same unit (kgN ha–1 yr–1) and because we are looking for a simple long-term integrative theoretical relationship, we decided to make use of the simplest possible function obeying the three following properties: (i) the function intercept should be zero; (ii) the slope of the function should be 1 at low fertilization; (iii) the function should reach a plateau at high fertilization. The first two properties reflect the fact that, in the long run, harvest cannot exceed N restitutions to the soil, and that the effect of low fertilization in strongly N-limited systems is characterized by a NUE close to 1. The third property expresses the classical law of diminishing return and the fact that, in constant technical-agronomical context, some other limiting factor will always impose a ceiling to production at saturating N availability. Two mathematical functions with only one parameter obey both conditions: a hyperbolic function of the form Y = Ymax*F/(F + Ymax) [1] and a negative exponential function such as Y = Ymax [1 − exp(−F/Ymax)] [2]. We observed that the former generally provides the best fit to the data. In both cases the parameter Ymax represents the yield value reached at saturating N fertilization, as well as the value of fertilization at which a definite fraction of this maximum yield is reached (this fraction being 0.5 in the case of relation [1] or 0.63 for relation [2]). Over the 1961–2009 period, certain countries that we will call 'type I', such as China, Egypt and India, present a simple trajectory with regularly increasing fertilization and gradual reduction in the crop yield response, following a consistent and unique Y versus F relationship (figure 1(a)).
Other countries (called 'type II'), such as the USA, Brazil and Bangladesh, display a historical trajectory with first a regularly increasing fertilization and yield, fitting the Y versus F relationship with a definite Ymax, then a turning point with a shift of the trajectory to another relationship with a significantly higher Ymax. This likely reflects improved agronomical practices in terms of production factors other than nitrogen, together with the pursuit of increasing fertilization. The turning point seems to have occurred in the 1980s or later depending on the country (figure 1(b)). The case of the USA, for example, is consistent with a slowdown in the increase of synthetic fertilizers inputs from the 1980s parallel to a moderate increase in the yields of the most important crops (Howarth et al 2002, Alston et al 2010).
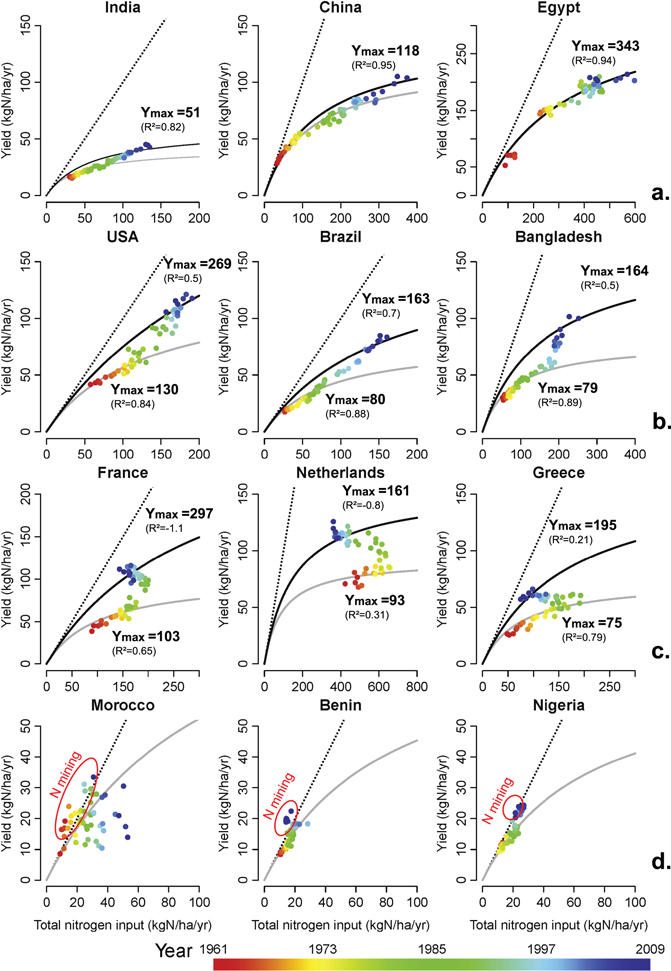
Figure 1. Examples of trajectories followed by countries in the Y versus F diagram. (a) Examples of type I trajectories. (b) Examples of type II trajectories. (c) Examples of type III trajectories. (d) Examples of type IV trajectories. R2 is the coefficient of determination, defined as: ![${{R}^{2}}=1-\left[ \sum {{({\rm ob}{{{\rm s}}_{{\rm i}}}-{\rm cal}{{{\rm c}}_{{\rm i}}})}^{2}}/\sum {{({\rm ob}{{{\rm s}}_{{\rm i}}}{\rm meanobs})}^{2}} \right]$](https://content.cld.iop.org/journals/1748-9326/9/10/105011/revision1/erl502906ieqn2.gif) where obsi are the observed values of yield, calci the yield value calculated with the relationship and meanobs is the average value of the observed yields over the period considered. Negative values of R2 indicate poor fit of the relationship on the observed values. This is often the case for the most recent period of type III trajectories because of still evolving agronomical conditions.
where obsi are the observed values of yield, calci the yield value calculated with the relationship and meanobs is the average value of the observed yields over the period considered. Negative values of R2 indicate poor fit of the relationship on the observed values. This is often the case for the most recent period of type III trajectories because of still evolving agronomical conditions.
Download figure:
Standard image High-resolution imageIn most European countries (see the example of France, the Netherlands and Greece in figure 1(c)), the trajectory also shows a bi-phasic pattern, describing a regular increase in both fertilization and yield during the 1960–1975 period, followed by a shift towards improved yields without further increasing fertilization and even decreasing fertilization from the 1980s on ('type III'). The case of the Netherlands is the most spectacular, as in this country, which has always used very high rates of fertilization, the level applied in recent years has been reduced to the same as in the 1960s with, however, doubled yields. This trend is related to the reduction of N inputs prescribed by European environmental policies and regulations (van Grinsven et al 2012), which interestingly did not prevent significant yield increases thanks to a better N management. Note, however, that despite the increase of NUE and decrease in N surpluses, the nitrogen surplus emitted to the environment in many cases remains much higher than that of other countries belonging to types I and II.
Finally, there is a small group of countries, such as Morocco, Benin and Nigeria, whose trajectory does not display any consistent Y versus F relationship (type IV). These countries have always very low inputs and yields. Very often, their trajectory in the Y versus F diagram crosses the 1:1 line, indicating higher yield than fertilization. High inter-annual variation in the agricultural performance observed in some of these countries could be explained by weather phenomena, such as persistent water droughts, socio-political questions, or sometimes could be even an artefact due to the poor quality of our estimates of total nitrogen inputs to agricultural soil: in particular, in those countries where shifting agriculture is practiced, the fertilization of agricultural soil by the nitrogen stock accumulated in forested soil during the fallow period is not taken into account in our input estimations. However the 'negative' nitrogen balance displayed in the Y versus F diagram can also represent the signature of an unsustainable nitrogen mining of agricultural soils.
For type I to III countries, we were able to define the Ymax values providing the best fit of the hyperbolic relationship [1] to the points corresponding to the 1961–1980 period or later, and another Ymax for the most recent 10–15 years. The two Ymax values obtained characterize the past and current agricultural potential respectively, defined as the protein yield that could be obtained from cropland at a maximum N fertilization rate, with the corresponding cropping practices (figure 2). Comparison of the two periods shows a significant increase of Ymax in 45 countries (type II and III trajectories). For a large number (55) of countries, however, nearly the same parameter value or Ymax holds over the 50-year period (type I trajectory), as is the case for China, Egypt, Turkey, Chile, India and a many others. Possible N mining is indicated by higher crop yield than fertilization for 18 countries such as Canada, Morocco, Algeria, Iraq and Mozambique in the 1960–1980 period (see S2 for the complete list). In recent years, N mining continues in 10 African countries, as well as in Former Soviet Union countries, Afghanistan and Paraguay. N mining has been observed in Argentina for the entire studied period. This result is coherent with that recently reported by Álvarez et al (2014) that indicate a budget of the copping system in the pampean agroecosystems, which only becomes positive when including pasture lands. The severe problem of nutrient mining and loss of soil fertility in African countries has been frequently highlighted (Vitousek et al 2009, Liu et al 2010). In these countries yields are among the lowest in the world but have apparently wide margins for improvement through better fertilization practices, including an increasing use of legumes in crop rotations (Vanlauwe et al 2014). However, imbalances with other nutrients such as P could limit yield responses to N addition (van der Velde et al 2014). In the Former Soviet Union, after the abrupt changes which occurred from 1989, crops may have benefitted from nutrient legacies. The results of our calculations for this country, however, might also be affected by recent and poorly documented changes like massive land abandonment not fully documented by the FAO (Schierhorn et al 2013).

Figure 2. Past and current agricultural potential of world countries, in terms of maximum protein yield of cropping systems (Ymax).
Download figure:
Standard image High-resolution image3.2. Agronomical performances: trends in N use efficiency and N-based yield gap
The above-described trajectories can be translated in terms of changes in the NUE of the cropping system in the different countries (figure 3). Type I countries display a regularly decreasing trend of NUE. During the same period a similar drop for the phosphorus use efficiency (PUE) has been reported for China (Sattari et al 2014). In type II countries, the shift in the trajectory toward an improved Ymax results in the stabilization or in the increase of NUE. In type III countries, the reduction of N inputs in recent years with no drop in yield corresponds to increasing NUE.

Figure 3. 50 years trends in nitrogen use efficiency of the cropping system of a number of countries.
Download figure:
Standard image High-resolution imageTo characterize the performance of agriculture of a given territory, van Ittersum et al (1997, 2013) introduced the concept of yield gap, defined as the difference between the actual farmers' yield of a particular cultivar and the potential yield which could be obtained in the same place in the absence of limitation by nutrient and water and with efficient control of pests and diseases. Following the same line of reasoning, but applied to the overall production of the cropping systems of each country in terms of proteins, we calculated (Ymax-Y)/Ymax as a dimensionless indicator of the degree of N limitation of current agricultural yields (figure S2-1). This indicator is high (>0.75) in North America, Australia, most European and many sub-Saharan countries, indicating margins for increasing yields by increasing N fertilization. It is low (<0.3), on the other hand, in countries like China, India and Pakistan, as well as in a number of Central American and North African countries, indicating no benefit in terms of yield to be expected from simple increase of N fertilization in these regions in the absence of radical agronomical improvement of the cropping system. George (2014) has analyzed why crop yields in many developing countries cannot easily respond to increased inputs due to poor agronomical practices.
3.3. Environmental performances: NUE and N losses
The data we have assembled can also be used to estimate the contribution of agriculture in the different world countries to environmental nitrogen contamination, using the nitrogen surplus (F-Y) as an indicator of potential losses. While in grassland this surplus is generally stored in the soil organic matter pool, in the case of cropland, most of it is leached quickly as nitrate, emitted as NH3 or denitrified as di-nitrogen, and nitrous oxide as a by-product, thus contributing to the nitrogen cascade of environmental contamination (Galloway et al 2003). The data thus show the global distribution of environmental N losses from agricultural soils (figure S2-2). Losses are over 50 kgN ha–1 yr–1 in most of Europe, the Middle East, the USA and Central America, India and China. They remain on average below 25 kgN ha–1 yr–1 in most sub-Saharan Africa, the Former Soviet Union countries, and Australia. High surplus values are associated with low NUE (figure S2-2).
Total fertilization, as discussed above, is mainly the sum of synthetic fertilizers, manure application and symbiotic nitrogen fixation. Although not negligible, atmospheric N deposition generally contributes a much smaller share. The proportion of the three former N inputs to overall fertilization varies a great deal among the different world cropping systems, as shown in figure 4(a). Our data show that NUE is generally higher (and the N surplus relatively lower) for agricultural systems with higher proportion of N inputs derived from symbiotic N fixation (figure 4(b)). Conversely, NUE is generally lower for a higher proportion of synthetic fertilizers in total fertilization. This higher efficiency of cropping systems relying largely on biological N fixation is observed for the largest soybean producers of South America as noted by Liu et al (2010) as well as for less productive countries in Africa and Asia with significant production of rice, groundnuts and beans. The higher NUE associated to nitrogen fixation is likely explained by a higher efficiency in the incorporation by legumes of their self-supplied nitrogen (Herridge and Peoples 1990). Also, the increase of the price of synthetic fertilizers might have encouraged the use of other sources of N in a most efficient way.

Figure 4. (a) Distribution of the share of symbiotic fixation and synthetic fertilizers in total N inputs to cropland by countries in 2000–2009. (b) Observed relationship between NUE and the proportion of symbiotic fixation, or of synthetic fertilizers in total N inputs to cropland in the period 2000–2009.
Download figure:
Standard image High-resolution image3.4. Global trends
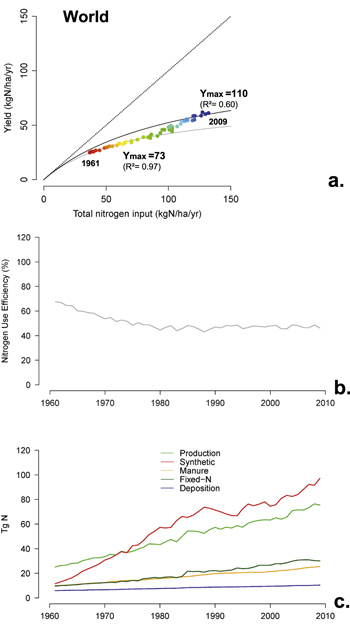
At the global scale, lumping together all cropping systems of the world, a type II Y/F trajectory is observed, with a shift during the 1980s from one Y/F relationship characterized by a Ymax of ∼70 kgN ha–1 yr–1 to an improved one with Ymax of 110 kgN ha–1 yr–1 (figure 5(a)). The overall observed global trend is a distinct decrease of NUE in the 1961–1980 period (from 68% to 45%), followed by a stabilization during the last 30 years around 47% (figure 5(b)). The share of the different sources of N in the total inputs to cropland, depicted in figure 5(c), change considerably during the last 50 years, with synthetic fertilizers now being the largest source. Despite that the total rate of N excreted by livestock is equivalent to synthetic fertilizer application, the manure, rarely used efficiently, finally reaches the crops at a much lower rate which nowadays is slightly lower than crop biological N- fixation (figure 5(c)).
Figure 5. The global cropping system. (a) Trajectory followed by global world cropping systems in the Y versus F diagram (Y: crop yield in protein harvested, kgN ha–1 yr–1; F: total N inputs to the cropland soil, kgN ha–1 yr–1). (b) Trends in nitrogen use efficiency of the global cropping system. (c) Evolution of the components of the global cropping system budget.
Download figure:
Standard image High-resolution image
4. Conclusions
Currently, only 47% of the reactive nitrogen added globally onto cropland is converted into harvested products, compared to 68% in the early 1960s, while synthetic N fertilizer input increased by a factor of 9 over the same period. This means that more than half the nitrogen used for crop fertilization is currently lost into the environment. Even though a significant improvement in NUE occurred in many countries after the 1980s, the present results suggest that a further increase of nitrogen fertilization would result in a disproportionately low increase of crop production with further environmental alterations, unless cropping systems improve their efficiency substantially. In that respect, improvement of agronomical practices and development and proper application of environmental policies have been demonstrated to be efficient strategies. A better integration of crop and livestock systems can also contribute to increasing NUE at the local and global scale (Herrero et al 2010, Lassaletta et al 2014a, Bonaudo et al 2014, Soussana and Lemaire, 2014). Moreover, our data suggest that an increase in the contribution of symbiotic N fixation would result in increasing NUE. Peoples et al (2009) have stressed that the potential of symbiotic nitrogen fixation is currently largely underexploited, given that very few countries have a fraction of arable land devoted to legume crops greater than a few percent. Increased areas of legumes might be achieved by including more leguminous crops in rotations, or by the introduction of short-duration legume green manures or 'catch crops' (Blesh and Drinkwater 2013).
By evidencing the long-term response of N inputs to the soil in terms of production and potential losses to the environment, this paper provides a summarized and comprehensive diagnosis of the effective changes in agronomical and environmental performances of the cropping systems of 124 countries of the world.
Acknowledgments
This study was partly supported by the SeasERA EMoSEM project (ANR-12-SEAS-0005-01). We wish to thank the FIRE (Fédération Ile de France de Recherche en Environnement, CNRS and UPMC). We thank Javier Castrillo who developed several computer routines for the data management and Angel Udias for his help in preparing the figures. We are sincerely grateful to two anonymous reviewers for their detailed and constructive revision. We thank Augustin del Prado, Eduardo Aguilera, Guillermo Pardo, Fernando Estellés, Alberto Sanz-Cobena and Dennis Swaney for helpful suggestions and comments. We also thank to the Scientific Network on GHG mitigation from the agroforestry sector in Spain (REMEDIA) for providing an space for discussion and science developement. The views expressed in this document are purely those of the authors and may not in any circumstances be regarded as stating an official position of the European Commission.