
Abstract
The world's agricultural systems face the challenge of meeting the rising demands from population growth, changing dietary preferences, and expanding biofuel use. Previous studies have put forward strategies for meeting this growing demand by increasing global crop production, either expanding the area under cultivation or intensifying the crop yields of our existing agricultural lands. However, another possible means for increasing global crop production has received less attention: increasing the frequency of global cropland harvested each year. Historically, many of the world's croplands were left fallow, or had failed harvests, each year, foregoing opportunities for delivering crop production. Furthermore, many regions, particularly in the tropics, may be capable of multiple harvests per year, often more than are harvested today.
Here we analyze a global compilation of agricultural statistics to show how the world's harvested cropland has changed. Between 2000 and 2011, harvested land area grew roughly 4 times faster than total standing cropland area. Using a metric of cropland harvest frequency (CHF)—the ratio of land harvested each year to the total standing cropland—and its recent trends, we identify countries that harvest their croplands more frequently, and those that have the potential to increase their cropland harvest frequency. We suggest that a possible 'harvest gap' may exist in many countries that represents an opportunity to increase crop production on existing agricultural lands. However, increasing the harvest frequency of existing croplands could have significant environmental and social impacts, which need careful evaluation.
Export citation and abstract BibTeX RIS

Content from this work may be used under the terms of the Creative Commons Attribution 3.0 licence. Any further distribution of this work must maintain attribution to the author(s) and the title of the work, journal citation and DOI.
1. Introduction
Several recent studies have suggested that we will need to dramatically increase global crop production in the coming decades to keep pace with population growth, changing dietary preferences (especially increasing meat and dairy consumption), and increasing biofuel demand [1–6]. While there are several strategies to meet these challenges—including reducing demand by shifting patterns of consumption and waste [1, 7–9]—there will continue to be significant pressure on the world to grow more crops.
Broadly speaking, there are several ways to increase global crop production and two of these have been widely studied: (1) expand the area of standing croplands in the world, often by clearing natural ecosystems, including tropical forests and savannas [2, 10–14]; and (2) increasing crop yields through agricultural intensification on existing croplands, often through the use of increased fertilizer, irrigation, mechanization, and improved seed varieties [1, 15–18].
While these two widely studied strategies can undoubtedly increase global crop production, they both have serious environmental drawbacks [1]. Cropland expansion, especially into sensitive tropical ecosystems, is implicated as a major driver of biodiversity loss and greenhouse gas emissions [19–21]. Agricultural intensification, without major changes in current farming practices, often results in increased water consumption, water pollution, soil degradation and energy use [22, 23]. Unfortunately, crop productivity gains in large tracts of some important croplands have recently stalled [24–29], and overall yield increases now fall significantly behind those needed to match growing demands [30]. We therefore face tremendous challenges in increasing global crop production, while minimizing the impact on the environment; other means of increasing global agriculture production should be explored.
There is a third way to increase global crop production [31–36]: using the existing standing cropland area more frequently each year through multiple cropping (where appropriate), leaving less land fallow, and having fewer crop failures. Between 1961 and 2007 this third way has contributed to 9% increase in global crop production and by 2050 is expected to contribute to nearly the same amount of crop production as from arable land expansion alone though regionally there are significant differences [35, 36]. Here we analyze how global crop harvests and cropland area have changed over the last few decades, and explore how changes in agricultural practice may be able to increase the amount of crop grown on existing lands per country by increasing the frequency of harvests.
2. Changes in cropland area and harvests
Our analysis first considers the world's total standing cropland (defined as the land that has been cleared for growing crops, including land that may have been fallow in the last five years). In 2011, the last year when global data are currently available, this was estimated to be ∼1.55 billion ha [37]. The total standing cropland is often referred to as the 'arable land base' of the planet: land areas that are currently used to grow the world's crops.
The annually harvested cropland in 2011, on the other hand, was only 1.38 billion ha [38]—or only 89.2% of the world's standing cropland area. Assuming that croplands can only be harvested once per year—which is not true in much of the tropics, where double- or triple-cropping is possible—this represents a ∼10% loss of agricultural land with production potential. Part of this is from leaving land fallow, to allow the land to recoup its soil fertility and moisture levels. However, accounting for recent agronomic practices and widespread double- and triple-cropping in the tropics the loss of agricultural harvest potential on standing croplands is significantly higher.
The growth in annually harvested cropland and standing cropland has been changing in recent decades. Analyzing the 177 crops tracked by FAO [38] since 1961 shows that the amount of annually harvested land has increased much faster than the reported total standing cropland [37] on the globe (figure 1). While standing cropland area increased at the rate of ∼3.5 million ha/year (from ∼1.37 billion ha in 1961 to ∼1.55 billion ha in 2011), the annually harvested land increased at a much faster rate of ∼5.5 million ha/year (to reach ∼1.38 billion ha in 2011 from ∼1.06 billion ha in 1961).

Figure 1. Changes in global harvested land (solid line) and global standing cropland (dashed line), compared to 1961. For harvested land we use 177 crops reported by the Food and Agriculture Organization and for croplands we use the total arable land plus the land under permanent crops also reported by the UNFAO. Pastures are not included in the total croplands, and pumpkins for fodder are not included (due to probably reporting error in FAO data) in harvested lands following [1].
Download figure:
Standard image High-resolution imageThe ratio of annually harvested land to total standing cropland has been increasing over time as well (from 0.78 to 0.89 between 1961 and 2011), showing that the world's cropland harvesting frequency has been increasing significantly. In fact, the frequency of land harvesting increased even faster between 2000 and 2011; globally, annually harvested land increased at the rate of ∼12.1 million ha/year which was approximately 4 times faster than the rate for standing cropland expansion (∼2.9 million ha/year).
In short, the world's total standing cropland has been expanding, but relatively slowly, while the amount of annually harvested cropland has been growing much faster.
These changes in annually harvested cropland have contributed to recent changes in global food production. Considering 174 crops tracked by the United Nations Food and Agricultural Organization (UNFAO), we note that the total global crop production increased by 28% between 1985 and 2005 [1]. Over the same period of time, the total amount of cropland on Earth increased, on net, by only 2.4%: this stemmed from increasing cropland areas in the tropics, combined with some losses of cropland area in the temperate zone [1]. Interestingly, the amount of annually harvested cropland increased by 7% during this period, roughly 3 times faster than the change in cropland area alone, which does not account for increasing rates of multiple cropping, fewer crop failures, and less land left in fallow.
The 28% increase in global crop production between 1985 and 2005 was therefore due to a combination of increasing harvested area (a ∼7% increase) and increasing average yields (a ∼20% increase). We can therefore attribute roughly a quarter of recent crop production increases to changing harvested area, and the remaining three quarters to increasing yields. Thus, tracking changes in crop harvested areas is important.
3. Mapping cropland harvest frequency
While global average statistics point to increasing harvesting frequency—stemming from fewer crop failures, less fallow land and more double and triple cropping—they obscure the intricate nature of how individual countries have used their land resources. Here we calculate annual national-level cropland harvest frequency (CHF) metric, defined as a ratio of the annually harvested cropland to the total standing cropland, to determine changes in cropland harvest frequency for each country:

where, H is the harvested area and C is the standing cropland areas (both in hectares).
A country that harvests 0 ha of its standing cropland has a CHF of 0, whereas those who harvest each cropland hectare once per year have a CHF of 1. If all of the cropland is harvested exactly twice per year then the CHF is 2. The CHF metric is only a rough estimation of the frequency with which a country uses its available land resources. The term also incorporates within it the regional and crop specific differences that must exist and as we currently do not have such crop specific and subnational information we provide only national numbers. We note that Siebert et al [33] provide an analysis of some similar data and computed the ratio of 175 harvested crop areas [39] to the total cropland area [40] at 5 min spatial resolution and called the metric 'cropping intensity'. Computationally, CHF is essentially the same as what other authors have called 'cropping intensity' [33, 34] or 'agricultural intensity' [41, 42]. However, while these other terms show the proportion of arable land that is being planted and harvested, CHF denotes the number of times crops are harvested each year. Moreover, the results of Siebert et al [33] is restricted to the year ∼2000; here we concentrate on developments over the last four decades, especially since 2000. Furthermore, since we use FAO data throughout for computation, we are able to avoid the problems of different data sources (i.e. cropland area from one source and harvested area from another) that may create inconsistencies in some regions [33].
There are significant differences in cropland harvest frequency around the world (figure 2) but more importantly there are numerous countries in the world who on average have not been harvesting their standing croplands once per year (i.e. CHF < 1.0) since 2000. More surprising is our finding that there are several countries globally—in Latin America, Europe, and especially in Africa and in Asia—who are unable to harvest their standing cropland even once every two years (CHF < 0.5, countries colored in red in figure 2; actual numbers are provided in the supplementary information table 1 available at stacks.iop.org/ERL/8/044041/mmedia).
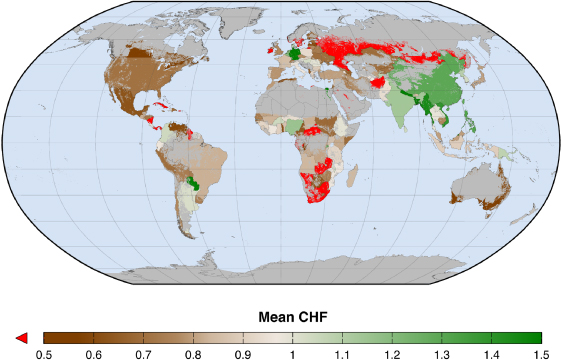
Figure 2. Average cropland harvest frequency (CHF) for the period 2000–2011 for each country. Countries in red are those with CHF < 0.5 (this can be interpreted as all standing croplands come under production once every two or more years). Countries in shades of brown bring their standing croplands in production every two or less years (0.5 < CHF < 1.0), whereas those in shades of green bring their standing croplands in production once or more per year (CHF > 1.0). The results were mapped in this and subsequent global maps only over existing croplands, though they were determined at the national level to provide a clearer distinction between countries with varying cropland extent.
Download figure:
Standard image High-resolution image4. Recent trends in cropland harvest frequency
To examine how cropland harvest frequency has changed over time, we perform a linear regression of CHF values for the period 2000–2011. Below we describe the calculated rates of change in CHF by continent (figure 3). Statistically significant trends are at p ≤ 0.1 and the actual numbers are given in the supplementary information table 1 (available at stacks.iop.org/ERL/8/044041/mmedia).

Figure 3. Rate of change in CHF between 2000 and 2011. A rate of 0 implies that the average CHF noted in figure 2 will remain unchanged. Negative rates imply that the country is witnessing reduced number of harvests, and vice versa. A rate of −0.02 means that 1 harvest every two years will be lost in 25 years, whereas +0.02 means an additional harvest every two years in 25 years.
Download figure:
Standard image High-resolution imageAsia and Australasia. Most of the major agricultural countries of Asia have been increasing their cropland harvest frequency in the last decade. China has significantly increased its CHF at the rate of 1.8 × 10⁻²/year, from 1.24 to 1.40, whereas India has significantly increased its CHF by 1.4 × 10⁻²/year, from 1.08 to 1.21 harvests per year. CHF is also increasing significantly in Australia (0.7 × 10⁻²/year), Bangladesh (1.9 × 10⁻²/year), Cambodia (3.3 × 10⁻²/year−1), Nepal (1.5 × 10⁻²/year) and so on. Exceptions (showing a decreasing trend in CHF at p ≤ 0.1) were in Brunei Darussalam, Iraq, Laos, Saudi Arabia, South Korea, Syria, Turkey, and Vietnam. In Armenia, Iran, Kyrgyzstan, Papua New Guinea, Qatar, Tajikistan, Turkmenistan, and in Sri Lanka the decreasing CHF rates were not significant at p ≤ 0.1.
Africa. Among the larger agricultural countries with significant CHF increase rates were Tanzania, Angola, Cameroon, Egypt and Mali (figure 3). In Eritrea, Ethiopia, Lesotho, Mauritius, Nigeria, South Africa, and Zimbabwe we found significant (at p ≤ 0.1) decreases in CHF. The CHF decrease rates found in Chad, Gambia, Ghana, Guinea-Bissau, Malawi, Oman, Rwanda, Senegal, Swaziland, were however small and not significant at p ≤ 0.1. Overall, sub-Saharan Africa had a higher concentration of countries with negative CHF trends than any other region, suggesting several possibilities—an increase in crop failures or fallow periods, a reduction in double- and triple-cropping, an increase in cropland areas but not brought into production.
Europe. In Western Europe there is a general absence of any significant trends, perhaps indicating that most countries have been using land resources consistently. The exceptions to this are the countries with significantly increasing CHF trends: Austria, France, Germany, Italy, and Portugal. On the other hand Cyprus, Denmark, Finland, Greece, Norway, Spain, Sweden, Switzerland, and the United Kingdom have significant negative CHF trends implying these countries are leaving more land un-harvested. In Eastern Europe, Czech Republic and Moldova have significant decreasing CHF whereas Albania, Belarus, Bulgaria, Estonia, Latvia, Poland and Ukraine have significant positive trends in CHF. While following the collapse of the Soviet Union agriculture abandonment was reported to be widespread [43, 44] this appears to no longer be the case in many of the former Soviet Republics who are harvesting their croplands more frequently.
Americas. In the Americas, the major agricultural countries with increasing CHF rates (at p ≤ 0.1) were: Bolivia, Brazil, Chile, Colombia, Ecuador, El Salvador, Guyana, Haiti, Honduras, Jamaica, Paraguay, Peru, Suriname, United States, Uruguay, and Venezuela, whereas countries with significant decrease rates were: Argentina, Cuba, Dominican Republic, and Mexico (figure 3).
5. Estimating the potential for increasing harvest frequency
We note that many regions of the world have a CHF less than 1, with several less than 0.5, implying less than 1 harvest per two years (figure 2). Many in the tropics are far below their potential CHF of 2 or 3 (in regions where double- and triple-cropping is possible). Therefore, there is a theoretical 'harvest gap' in these regions—a gap between the harvest frequency that is theoretically possible and the harvest frequency seen today, in the region.
However, to better estimate this potential 'harvest gap', the maximum potential CHF needs to be determined. While this depends greatly on the crops in question, and the farming techniques employed, we estimate maximum potential CHF using WorldClim climatological monthly average minimum temperature [45] and a global cropland map [40]. The global cropland map [40] in turn was developed by fusing two different satellite derived land cover maps [46, 47] with ground based agricultural inventory statistics [40, 48].
If a cropland grid cell [40] within a country had a mean monthly minimum temperature ≥10 °C all year we conservatively set the number of possible harvests on the standing croplands in that grid cell at 2. Otherwise, we assume only a single harvest was possible per year in that cropland grid cell. The global area averaged maximum potential CHF calculated in this way is ∼1.32.
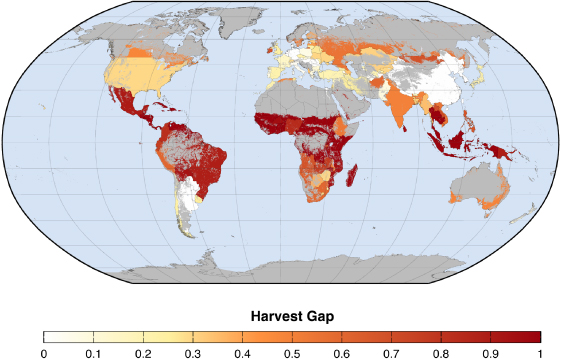
For each country the total standing cropland area and the maximum potential harvested area was summarized at the national level. When the maximum potential CHF was greater than the actual CHF, the difference between the maximum potential CHF and actual CHF is the 'harvest gap' (figure 4).
Figure 4. The difference between current cropland harvest frequency (CHF) and the estimated maximum potential cropland harvest frequency. Our analysis of maximum potential cropland harvest frequency is likely conservative as many tropical areas can have 3 harvests per year, but we set the upper limit of harvests to 2. A negative value of −1 imply 1 harvest per year is not occurring, whereas a positive value of 1 implies an extra harvest compared to the maximum 2 is taking place per year.
Download figure:
Standard image High-resolution image
We keep the method of determining maximum potential CHF deliberately simple to illustrate the concept of 'harvest gap'. The method may introduce errors—an underestimation in some places where another harvest is possible, and overestimation in other, warmer but drier, grid cells where irrigation may not exist. Furthermore, many of the drier croplands already have irrigation; in some drier parts of Africa irrigation is less developed [49] but the potential for irrigation is itself not known. Even current global crop irrigation maps are a matter of active research and development [49–52] and its temporal changes are not available to determine current average yearly irrigation extent.
We test the sensitivity of maximum potential CHF and harvest gaps for temperature thresholds of 7.5–12.5 ° C, and for irrigation using the International Institute for Applied Systems Analysis (IIASA) [53] rain fed plus irrigated global crop maps. The results of these analyses are given in details in the supplementary information (available at stacks.iop.org/ERL/8/044041/mmedia).
We find that the African continent has the largest concentration of potential 'harvest gaps', followed by Latin America and Asia. Europe and North America have limited harvest gaps. On the other hand there are several highly productive countries—such as China, Argentina and Germany—who are harvesting standing cropland area more frequently or closer to the maximum potential CHF. Other important agricultural countries, such as India and Canada have harvest gaps of ∼0.5 which means that an extra harvest in each two year period is theoretically possible; in Mexico and Brazil the numbers are higher at around 0.9 which roughly means another harvest is theoretically possible each year. The actual numbers for each country is provided in the supplementary information table 1 (available at stacks.iop.org/ERL/8/044041/mmedia). The global average potential 'harvest gap' is ∼0.57.
The increase in global crop production that is theoretically achievable by closing the potential harvest gap in each country is simply the product of the country's crop average yield, total cropland area, and the harvest gap (supplementary information table 1 available at stacks.iop.org/ERL/8/044041/mmedia). Based on this, we estimate that global agricultural production can be theoretically boosted by another ∼50% of the average global crop production in 2000–2011, though extra harvests may not retain the same productivity as investments for a second crop may be less profitable at least in the short term.
However, it is important to note that increasing the CHF is not necessarily desirable everywhere. While increasing the cropland harvesting frequency can, in the short run, increase the net annual production of agricultural crops per hectare of land, it can also lead to the long-term deterioration of soil, water resources, and the agricultural land base itself. Depending on local environmental conditions, agronomic practices, and social contexts, increasing cropland harvest frequency could present a short-term gain in crop production, with long-term losses in agricultural yields and environmental conditions. Only if the increasing frequency of harvests can be done sustainably is this strategy a potential way to address some of the challenges of crop production and food security.
Some evidence from field experiments suggest that reducing fallow periods, or increasing CHF, increases soil carbon depending on the tillage adopted, fertilization and crop cycle in the United States [54, 55]. In general however increased cropping frequency reduces soil organic carbon [56, 57], the diversity of soil microbiota [58], arthropod [59], and other species [60] especially if higher CHF leads to conventional cropping [61, 62] and landscape simplification [63]. Increased cropping frequency will also be accompanied with other agricultural inputs such as irrigation and fertilization [64], which could have impacts on water quality and aquatic ecosystems [65]. Excess nitrogen fertilization associated with double-cropping cereal systems in China, for example, has led to widespread soil acidification, which if untreated reduces crop yields [66]. Similar detrimental environmental impacts can be expected from increased herbicide and pesticide application [67] associated with increased CHF. However on-farm [68] to global scale [1, 15] analysis has shown that crop productivity could be raised while maintaining environmental integrity. Furthermore, high CHF has been found as a risk aversion and crop productivity boosting strategy under climate change conditions in many sub-Saharan African countries [69]. If the first crop is a nitrogen fixer, and the second non-N-fixing crop, overall yields improve under such increased CHF [70–72], at least in the short term. Increasing CHF could also increase farmer incomes, break the life cycle of pathogens and pests [73], and reduce chemical application especially in no-till agricultural practices [29].
In reality, CHF has been increasing globally (figures 1 and 3). In specific global regions such as in Mato Grosso, Brazil, CHF has been increasing [74, 75] and contributing to the overall increasing trends in CHF for the entire country (figure 3). The introduction of second crops, generally corn following the primary soybean crop [76, 77] has increased local incomes across economic sectors [78]. Elsewhere, the decrease in cropland areas in many Central Asian countries, notably in Kazakhstan [79] has combined with correspondingly higher harvested area leading to sharp rise in CHF trend (figure 3); elsewhere such as in Turkmenistan both the harvested and cropland areas have increased [37, 38, 79] with the later rising faster and leading to a decreasing (but insignificant) trend in CHF (figure 3). Warming trends in the Tibetan Plateau [80] and elsewhere in the north China plains [81] has also increased CHF contributing to the positive trends in CHF in China (figure 3, supplementary table 1 available at stacks.iop.org/ERL/8/044041/mmedia). Elsewhere policies and/or scarcity of land may have encouraged increasing CHF [82, 83]. Within countries CHF is complex with some regions increasing CHF while others decreasing their CHF in specific crops and for specific years [84].
6. Discussions and conclusions
Here we have demonstrated that the amount of annually harvested cropland globally has been increasing far faster than the amount of total standing cropland, and has contributed significantly to the increase in global food production in recent decades.
Using historical agricultural statistics for each country from across the world, we estimated the Cropland Harvest Frequency (CHF) as the ratio of annually harvested cropland to the total standing cropland base for each country (figure 2). Globally, the average CHF was 0.9 in 2011, increasing from 0.8 in 1961, which means an extra crop harvest globally every ten year period compared to the 1960s. On a country-by-country basis, we have identified regions with significant increases in CHF (e.g., Brazil, India, and China) and regions where CHF has been declining (e.g., many countries in Africa, but also in some high-income countries such as South Korea) (figure 3).
Theoretically, CHF should be 1 in regions where a single annual crop is possible; it may be 2 or 3 in places where double- and triple-cropping is possible. Based on this concept, we estimated a potential 'harvest gap' for illustration purposes—the difference between cropland harvesting that is theoretically possible and what is currently harvested annually across the world. There are large harvest gaps in Latin America and Africa; globally the number is greater than 0.5, and closing them could theoretically boost global agricultural production by more than 44%, at least in the short run.
The presence of 'harvest gaps' signifies the presence of socioeconomic and/or biophysical factors limiting more frequent cultivation. Both socioeconomic and biophysical factors are also likely interconnected, and some of the same reasons that limits global crop yields and creates 'yield gaps' discussed in detail elsewhere [1, 15, 29, 85, 86, 17, 87] also create 'harvest gaps' in some regions. Socioeconomic conditions that appear to have favored the transition from single- to double-cropping are: building transportation networks, farmer access to credit [77] and even connections to the global supply chain [78].
Whether increasing the frequency of crop harvests is sustainable—given the potential degradation of soil and environmental conditions that may result—is also an open question. However, similar to methods that deploy agroecological intensification, wherein the management of ecosystem services is harnessed in agricultural practices, an environmentally friendly alternative [61, 88–90], it may be possible that harvest gaps could also be sustainably closed. Further research is needed to more precisely estimate harvest gaps and explore whether changing harvest frequency is sustainable and appropriate in different geographic, social and agronomic contexts, and how this may or may not contribute to boosting global crop production.
7. Materials and methods
7.1. Global trends
Total standing cropland refers to land area under temporary or permanent agriculture. Harvested land refers to actual land area harvested. Thus, if the cropland area were 1000 ha with two crops grown annually (double-cropping), the harvested land area would be twice that of cropland area, i.e. 2000 ha. To determine the global trends in total standing cropland and harvested areas since 1961 and the country specific rates from the start of this century and ending in 2011 we first computed the global harvested areas in each year by summing the total harvested area for each crop and for each country. We linearly regressed the country specific cropland and harvested area against year to determine the country specific CHF trends. All data were sourced from the UNFAO [37, 38].
7.2. Data
In some countries the harvested and/or cropland numbers reported to the FAO may have errors or reporting issues. There could be (1) errors in country estimates for one or more crops from underreporting, over-reporting, and inaccuracies. (2) Reporting errors between the country and FAO. FAO frequently keeps updating and correcting these numbers but there is unpredictability and time lag, even of several years; and (3) all crops are not reported to the FAO, or some of the minor crops grown are not tracked by FAO (FAO tracks only 177 crops). Most countries also do not report via their crop statistics reporting agencies their total cropland area and the number is consistently available only from the FAO [37]. Unfortunately, at this point without undertaking a major effort to correct the FAO harvested and cropland numbers for each individual crop-country combination, we are constrained to using the FAO numbers. For the important agricultural countries we can expect the reported numbers as accurate.
As an example, of the data related challenges to conduct global agricultural studies consider Mexico: statistics on planted and harvested areas for 349 crops are given officially [91] but the FAO reports statistics of harvested area for 171 crops for Mexico (out of the 177 it tracks globally) [38]. Further, the total Mexican cropland area statistic [37] was only available from the FAO. The total Mexican CHF computed with 349 crops versus 171 crops is slightly different: 0.71 versus 0.62 respectively, but the discrepancy is not 100% corresponding to the more than 100% difference in the number of crops reported between these two sources. This is because the non-FAO reported crops are minor crops. Thus, we do expect the numbers computed using FAO reports to be a close approximation of the actual CHF in most countries. An example of reporting errors between a country and FAO is exhibited in the case of Germany; the anomalously high CHF and its trend in Germany, is very likely due to erroneous harvested area data being reported by FAO at the time that we accessed the data.
7.3. Cropland harvest frequency (CHF), maximum potential CHF and harvest gaps
To determine CHF we used the country specific data on total standing cropland and harvested areas for each year. However, some of the countries underwent a reorganization/breakup of territory (i.e. the former Yugoslavia), which we did not include in this study for determining country specific numbers. Some smaller islands were also not included in this study. The list of countries studied is in the supplementary information table (available at stacks.iop.org/ERL/8/044041/mmedia).
The determination of the maximum potential CHF and thus the computed harvest gap are dependent on method chosen which in this case was the temperature threshold of 10 ° C (and sensitivity tests for thresholds between 7.5 and 12.5 ° C). For comparison we did an alternate study with the global maps of multiple cropping zones under rain fed conditions and irrigated croplands [53]. The results of the sensitivity tests and alternate analysis are given in the supplementary information (available at stacks.iop.org/ERL/8/044041/mmedia).
7.4. Global maps
The linearly regressed CHF values from 2000 to 2011 for each country was displayed only over those 5 min grid cells over the globe that grew crops circa 2000 [40]. Similarly, we show the change in CHF numbers, and harvest gap only over those grid cells that grew crops circa 2000 even though the numbers correspond to the entire country. We mapped in this fashion to prevent false impressions of relatively higher significance of countries with large spatial areas but small cropland land areas.
Acknowledgments
This letter greatly benefitted from discussions with Paul West, Peter Hawthorne, James Gerber and the Foley lab members, and with Navin Ramankutty of McGill University. We thank the board member and reviewers for comments and suggestions that greatly improved this letter. We thank James Gerber for help with the figures. Research support was provided by a grant from the Gordon and Betty Moore Foundation, and by the Institute on the Environment, along with previous funding from National Aeronautics and Space Administration's—NASA's—Interdisciplinary Earth Science program. This work also benefitted from contributions by General Mills, Mosaic, Cargill, Google, PepsiCo, and Kellogg to support stakeholder outreach and public engagement.