

Abstract
In this study, we review federal datasets to assess the impacts of once-through power plant cooling systems on summer freshwater temperatures in the United States from 1996 to 2005. We find that maximum reported temperature discharges averaged 37 ° C (1996–2005) and were 9.5 ° C (1996–2000) to 10 ° C (2001–2005) higher than maximum reported intake temperatures during the summer. More than half of all power plant cooling systems report maximum temperature discharges that exceed 32 ° C and increase water temperatures enough to potentially impact aquatic life. However, current federal data on thermal discharges from power plants are insufficient to adequately assess their impact on in stream temperatures, or their subsequent effects on aquatic ecosystems and biodiversity. A preliminary analysis indicates that certain watersheds, primarily in the Southeastern and Midwestern United States, are good candidates for more focused study of power plant temperature impacts.
Export citation and abstract BibTeX RIS

Content from this work may be used under the terms of the Creative Commons Attribution 3.0 licence. Any further distribution of this work must maintain attribution to the author(s) and the title of the work, journal citation and DOI.
1. Introduction
When river temperatures heat up during summer periods of low flow and high temperatures, staying within defined regulatory temperature limits can require power plants to shut down or curtail their power generation (Kimmell and Veil 2009, Sovacool and Sovacool 2009, Van Vliet et al 2012). Recent events such as elevated heat and drought across the United States in the summer of 2012 have required thermoelectric power plants to curtail operations or seek variances on thermal discharge regulations (Eaton 2012). In addition, concerns have been expressed that increased river temperatures from climate change could constrain energy production in the future (USGCRP 2009). On the federal level, it has been proposed that the emergency authority of the US Department of Energy (DOE) should be expanded to override environmental regulations on power plants during periods when grid reliability may be at risk (HR 4273 2012). However, the impacts of increased temperatures on electricity production and grid reliability have not been well studied (Mideska and Kallbekken 2010, Schaeffer et al 2012).
A handful of recent studies suggest that increased river temperatures from climate change could impact grid reliability by taking electricity production off-line during summer periods when high temperatures coincide with peak electricity production. The majority of these studies have focused on Europe (Koch and Vögele 2009, Förster and Lilliestam 2009, Koch et al 2011), although a recent study has been extended to the United States, finding that 4%–16% of the electricity grid could be impacted by increased temperatures by 2050 under various climate change scenarios (Van Vliet et al 2012).
In this study, we review federal datasets documenting water temperature at intakes and discharges from power plants during the summer in the United States between 1996 and 2005. Our study focuses on plants with once-through cooling systems, which withdraw and discharge the largest volumes of water compared to other thermoelectric power plant cooling technologies (Macknick et al 2012). These systems also have the largest associated heat load, and are the most likely to come into conflict with regulatory limits on thermal discharges (Koch and Vögele 2009). We examine the quality and completeness of this dataset for national assessment. In addition, we use spatial analysis to determine watersheds where more focused studies of thermal pollution may be appropriate. A case study of one of these basins, the Upper Catawba River, illustrates some of the issues with regulatory management of power plant thermal effluent.
2. Background
2.1. Once-through cooling and reporting of temperature data
In the United States, there are currently 425 power plants that use once-through cooling, comprising just under a third of total electricity generation (UCS 2012). Once-through cooling systems circulate water through a plant a single time to provide cooling during generation. These systems require large volumes of water, which is extracted from rivers, lakes, or the ocean, on the order of 20 000–60 000 gallon MWh−1 of electricity produced (Macknick et al 2012). This water is cycled through the cooling system and then is discharged, transferring waste heat from the power plant into the discharge body of water. The discharge water body is usually also the source of the cooling water, causing a local temperature increase. Typical discharge temperatures from once-through cooling systems are 8 to 12 °C above intake temperatures, with some systems raising temperatures as much as 15 °C (Langford 2001). This heated discharge water then mixes with the receiving water body, with temperature impacts dissipating downstream through radiant transfer or evaporation into the atmosphere (Edinger et al 1968). Variability between power plant discharge temperatures can be due to differences in local climates, plant efficiencies, or volumes of water withdrawn for cooling. Under the Federal Energy Administration Act of 1974 (Public Law 93-275), the US Department of Energy (DOE) energy information administration (EIA) is required to collect data on the operations, management, and ownership of electricity generators and distribution companies in the United States. Within this process, the EIA collects environmental data such as water withdrawals, discharges and associated temperatures at the request of the US Environmental Protection Agency. This data is nominally required for all thermoelectric power plants with nameplate capacities greater than 100 MW, although reporting is voluntary (Wirman 2012). Prior to 2010, only the maximum intake and discharge temperatures were collected for the summer and winter months with peak electrical generation (EIA Form 767).
2.2. Aquatic organism impacts
Due to the biological sensitivity of many aquatic organisms to water temperature, temperature increases caused by power plant discharges may have multiple impacts on aquatic ecosystems (Langford 2001, De Vries et al 2008, Hester and Doyle 2011). Aquatic organisms are highly dependent on specific thermal conditions in aquatic environments; water temperatures above or below optimal thermal regimes can cause stress or even death (Beitinger et al 1999, Caissie 2006). It has been concretely demonstrated that fish cannot survive at temperatures above a critical thermal maximum for a certain duration. This critical maximum rarely occurs naturally outside a power plant's effluent stream, and is high enough to kill many entrained larvae and animals (Beitinger et al 1999, Kelso and Milburn 1979). For example, a suitable habitat for rainbow trout (Oncorhynchus mykiss) has an optimal temperature range of 13–15 °C, with the lethal maximum of 24.3 °C (Bear et al 2007). Temperatures above the critical thermal maximum create uninhabitable conditions for the rainbow trout. Higher stream temperatures also decrease oxygen solubility while increasing respiration rates, both of which reduce the availability of dissolved oxygen. Lowered oxygen in aquatic environments can limit the distribution of fish and macro-invertebrates, reduce growth rates, and alter nutrient and carbon cycling (Langford 1990). Elevated temperatures can also stress organisms, increase the toxicity of chemicals, and inhibit biological processes. One review of 151 toxicology studies found that high temperatures typically increase aquatic organism vulnerability to chemicals such as ammonia, heavy metals, and pesticides (Heugens et al 2001). Another review of 48 studies found that on average, a 7 °C change in temperature (ΔT) reduced biological processes such as growth, development, and reproduction for aquatic organisms by 50%, with a 10% reduction in biological processes occurring with a temperature change of only 1 °C (Hester and Doyle 2011). While the thermal impacts of discharges dissipate downstream from power plants, the magnitude of temperature increases (ΔT) in effluent near the discharge point can be high enough to potentially impact aquatic life.
2.3. Regulation of thermal discharges
In the United States, discharges of thermal effluent are regulated by section 316(a) of the Clean Water Act, which requires states to set limits for power plant thermal effluent in order to 'assure the protection and propagation of a balanced, indigenous population of shellfish, fish, and wildlife in and on that body of water' (CWA 1972). The primary method of enforcing this law is through the National Pollution Discharge Elimination System (NPDES) permit program, which regulates point sources that discharge pollutants into waters of the United States. The NPDES program is usually administered by state environmental agencies to meet water quality standards, and is overseen at the federal level by the United States Environmental Protection Agency (EPA). In order to obtain permits to discharge heated water, power plants are either required to meet water quality temperature standards, or to obtain a temperature variance, by proving their thermal effluent does not have adverse environmental impacts. Water quality standards vary by state, but typically require surface water to remain under 32 °C (see supplementary data for further information available at stacks.iop.org/ERL/8/035006/mmedia). The duration of NPDES permits is limited by the Clean Water Act to five years, after which the permit must be renewed with the appropriate regulatory agency (EPA 2012). In practice, the stringency in enforcing the Clean Water Act varies on a case-to-case basis, and limits are not always adequately set or enforced to protect aquatic life (Duhigg 2009, GAO 2009). In 2011, the EPA found the North Carolina Division of Water Quality had issued temperature variances to power plants that did not provide enough information to determine whether the revised thermal limits harmed aquatic life (EPA 2011a).
3. Methods
3.1. Reported temperatures from once-through cooling systems
Datasets for power plant characteristics, summer peak intake temperature (Tpin), and outflow water temperature (Tpout) from once-through freshwater cooling systems were compiled from the US Energy Information Administration form 767 for the years 1996–2005 (EIA 1996–2005). The data required that maximum peak temperature be collected at the intake station and the outflow stations for each cooling system during the winter and summer season. Plants were allowed to estimate the water temperature when readings were unavailable and collected only one data point for each season over the given time period (EIA 2005). The temperature provided indicates the maximum cooling water temperature at the intake and outflow for the 'peak load month', the month of greatest electrical generation at the plant. The seasons are defined as winter, from October to March and summer from April to September. Our study focuses on temperature data from the summer season, when electricity generation peaks and causes the largest associated thermal impacts.
This data was vetted to select for power plants with primary cooling systems designated by the EIA as once-through and using freshwater, with five years of complete, non-zero records for the periods 1996–2000 and 2001–2005. The time periods 1996–2000 and 2001–2005 were analyzed separately as the EIA did not require nuclear power plants to report to the EIA after 2000. A number of power plants did not report their cooling technologies to the EIA, so we compared the plants in our dataset to a more complete and detailed database of United States power plants in 2008 (Averyt et al 2013, UCS 2012) to determine what percentage of total fleet of once-through cooled plants were reporting temperature data. The temperature data was averaged over 1996–2000 (n = 418) and 2001–2005 (n = 403) and converted from Fahrenheit to Celsius. We also calculated ΔTp, or the difference between peak intake and discharge temperatures, where ΔTp = Tpout − Tpin. We used histogram analysis to evaluate the distribution of ΔTp,Tpout, and Tpin, and gauge the normality of the data.
3.2. Spatial analysis of HUC-8 basins with potential ecological impacts
We outlined potential impacts of thermal discharges from power plants on aquatic species by comparing two indicators: peak discharge temperatures against counts of threatened and endangered aquatic obligate species at the watershed level. Along with temperature, power plants pose a number of adverse impacts to aquatic species, including impingement (when organisms are trapped against intake screens), entrainment (when organisms get drawn through the plant cooling system), and chemical pollution. However peak discharge temperatures are both reported nationally and regulated, making it an appropriate indicator for broad-scale analysis. While discharge temperatures do not necessarily affect endangered species counts, high discharge temperatures can lower the concentration of dissolved oxygen, inhibit biological processes, and stress sensitive aquatic species by exceeding thermal tolerances (Cairns et al 1975, Langford 1990, Heugens et al 2001, Hester and Doyle 2011). To protect aquatic ecosystems, states limit temperatures through their water quality standards, typically to 32 °C or lower (see supplementary data for further information available at stacks.iop.org/ERL/8/035006/mmedia).
Aquatic obligate species are defined as any species that belong to any taxonomic group that can be classified as aquatic in the absence of habitat data. These data were obtained from a dataset compiled from state-level natural heritage programs (NatureServe 2011) mapped at the USGS Hydrologic Unit Code-8 (HUC-8) level using a digitization of USGS watershed boundaries (Steves and Nebert 1994). Power plant locations were obtained using latitude and longitudes from the Union of Concerned Scientists Energy-Water Database (UCS 2012). At the location of each power plant, average Tpout (2001–2005) was mapped and projected onto HUC-8 watersheds with counts of aquatic obligate species that were either G1 (critically imperiled), G2 (imperiled) or federal status endangered species under the US Endangered Species Act (NatureServe 2011). We also identified watersheds where aquatic ecosystems with high aquatic biodiversity were potentially at risk from high discharge temperatures, defined as Tpout ≥ 32 °C. As a proxy for high aquatic biodiversity, we selected the 220 HUC-8 watersheds that had more than 10 G1, G2 or endangered aquatic obligate species, out of 1963 watersheds with data. To scope areas for more focused study, we identified and mapped watersheds that had both high discharge temperature and high aquatic biodiversity.
3.3. Case study of the Upper Catawba watershed
From the results of the spatial analysis, we selected one watershed, the Upper Catawba, for a more focused case study. The Upper Catawba was designated as a watershed where high biodiversity was potentially at risk from thermal pollution, as power plants in the Upper Catawba basin had peak discharge temperatures that exceeded regulatory temperature limits during the summer. The Upper Catawba also illustrates some of the regulatory issues that occur with enforcement of the Clean Water Act in regards to thermal effluent.
The Upper Catawba River basin spans both North and South Carolina, supplies millions of residents with drinking water and recreational areas, and provides five major (>100 MW) thermoelectric power plants with cooling water, generating over 30% of North Carolina's electricity (Milazi 2009, UCS 2012). Of these 5 power plants, 3 are coal-fired, 2 are nuclear, and all 5 utilize once-through cooling systems. The Upper Catawba provides aquatic habitats for numerous organisms, including thirty-nine separate species of fish (SCDNR 2008, NatureServe 2011).
In order to analyze the thermal impacts of the 5 power plants along this river, data were distilled from the EIA temperature dataset compiled from 1996–2005. Additionally, NPDES permits were obtained for each plant (NCDENR 2005, SCDHEC 2005, NCDENR 2011a, 2011b, 2011c, 2011d) in order to compare reported data with state and federal regulations for power plant thermal effluent (NCDENR 2007, SCDHEC 2008).
4. Results
4.1. Reported temperatures from once-through cooling systems
As table 1 indicates, average ΔTp is between 9.5° and 10 °C. While this was calculated specifically for peak discharge temperatures in the summer, these values are generally comparable to ΔT values found by other studies (Langford 2001, Hester and Doyle 2011). In 1996–2000, 233 out of 418, or 56% of cooling systems had Tpout values that were above the benchmark temperature of 32 °C in all years. In 2001–2005, 230 out of 403, or 57% of cooling systems had peak discharge temperatures that were above the benchmark temperature of 32 °C in all years.
Table 1. Average and standard deviations for peak intake, peak discharge, and ΔT during summer months, 1996–2000 and 2001–2005.
| Years | n | Average Tpin (° C) | Average Tpout (° C) | Average ΔTp (° C) |
|---|---|---|---|---|
| 1996–2000 | 418 | 27° (±5.9°) | 37° (±6.8°) | 9.5° (±4.8°) |
| 2001–2005 | 403 | 27° (±5.8°) | 37° (±6.5°) | 10° (±5.0°) |
We also looked at how completely plants reported temperature data, both on the scale of cooling systems and individual plants. Of the cooling systems that reported temperatures, we found that 68% of individual cooling systems and 61% of all power plants had complete, non-zero temperature records for the years in our study (see supplementary data for further information available at stacks.iop.org/ERL/8/035006/mmedia). Nuclear plants had the most incomplete temperature records. From 1996–2000, 66% of nuclear power plants reported complete, non-zero intake and discharge temperatures, and nuclear power plants did not report any temperature data to the EIA after 2000.
4.2. Spatial analysis of HUC-8 basins with potential ecological impacts
Mapping discharge temperatures against watershed counts of G1 and G2 aquatic obligate species (as an indicator of high aquatic biodiversity) allowed us to identify watersheds that where further analysis of potential ecological risks may be useful. Figure 1 shows that the majority of once-through freshwater cooling systems are located in the eastern half of the United States (GAO 2009). In the period 2001–2005, 220 HUC-8 watersheds had 10 or G1 and G2 aquatic obligate species and 136 HUC-8 watersheds had average Tpout equal to or greater than 32 °C. 33 basins had both high temperature discharges and high biodiversity, primarily located in the South-Atlantic Gulf, Tennessee, and Ohio River Watershed Resource Regions (figure 2). We selected one of the 33 basins, the Upper Catawba River Basin, for further analysis. The Upper Catawba watershed had 11 counts of G1+G2 aquatic obligate species and an average Tpout of 37 °C in 2001–2005.
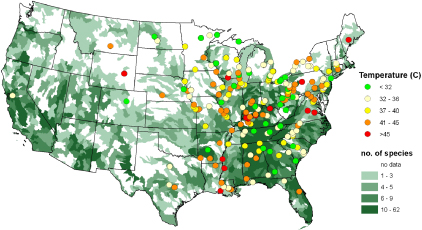
Figure 1. Average Tpout (°C) from once-through cooled plants in 2001–2005 mapped against counts of G1+G2 aquatic obligate species (NatureServe 2011).
Download figure:
Standard image High-resolution image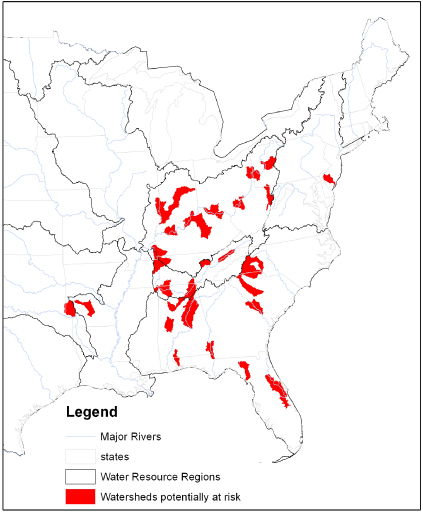
Figure 2. There are 33 HUC-8 watersheds (Steves and Nebert 1994) where high aquatic biodiversity (G1+G2 aquatic obligates ≥10) is potentially at risk from high temperature discharges (avg. Tpout ≥ 32 °C, 2001–2005) from once-through cooling systems.
Download figure:
Standard image High-resolution image4.3. Case study of temperature reporting on the Upper Catawba watershed
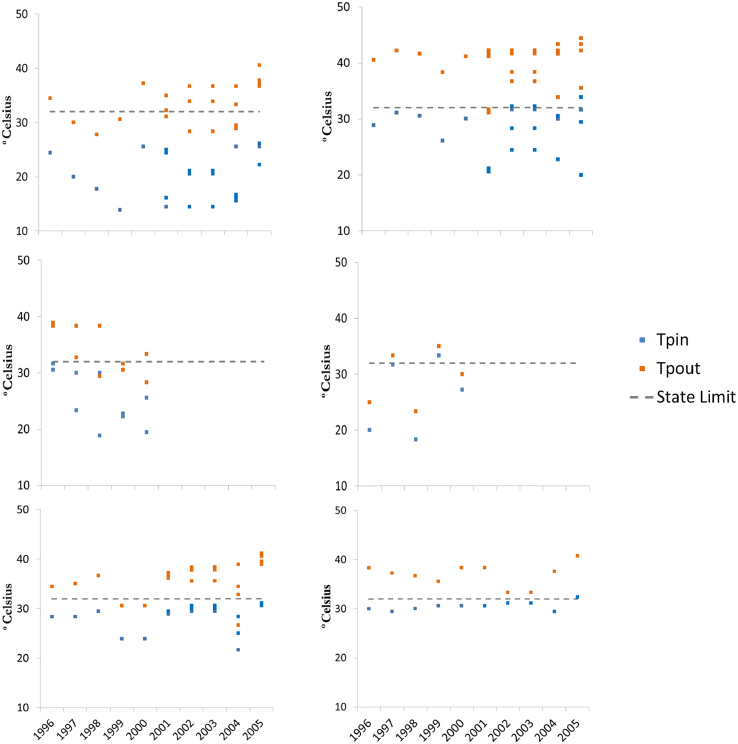
While EIA temperature data was available for all five major power plants from 1996 to 2000, the two nuclear plants (Catawba Nuclear Station and McGuire Nuclear Station) were not required to report temperature data from 2001–2005 (EIA 2010). Temperature data was reported only as summer peak intake and discharge temperatures for the highest month of electrical generation, disguising diurnal variations, sampling rates, and the frequency of thermal discharges above thermal limits. All power plants with available data reported discharging water that exceeded state limits on ΔT and maximum discharge temperatures during the summer (figure 3). However, their NPDES permits revealed that all five power plants had been granted thermal variances that allowed them to exceed state water quality limits, instead requiring power plants to keep thermal discharges below higher monthly averages and ΔT values (NCDENR 2005, 2011b, 2011c, 2011d, SCDHEC 2005). These variances may not be sufficient for Clean Water Act compliance. In the summer of 2007, the combined effects of drought and high temperatures caused Duke Energy to scale back power production at the GG Allen Steam Station and the Riverbend Steam Station when the discharge temperatures at these two plants exceeded their permit limits (Beshears 2007). As part of an ongoing corrective action, the NPDES permits at the Marshall and McGuire power plants have been targeted for direct review by the EPA (EPA 2011b).
Figure 3. Summer peak intake and peak discharge temperatures (°C) from power plant cooling systems versus state temperature limits in the Upper Catawba River basin, 1996–2005.
Download figure:
Standard image High-resolution image
5. Discussion
5.1. Power plant thermal discharges are high enough to potentially impact aquatic life
Our study found that once-through cooling plants discharged freshwater with peak temperatures of 9.5–10 °C above ambient stream temperatures during the summer from 1996–2005. Other studies have indicated that substantial aquatic ecosystem impacts can occur with temperature increases of 5 °C or higher (De Vries et al 2008, Hester and Doyle 2011), which suggests that the peak temperature discharges during the summer could affect aquatic ecosystems and the organisms that inhabit them. In addition, it appears that once-through cooling systems are currently facing ambient cooling water temperatures close to known regulatory limits and discharging waters that may exceed them. Our study indicated that high peak discharge temperatures most often intersected with the highest counts of imperiled aquatic obligate species in the South-Atlantic Gulf, Tennessee, and Ohio River basins, where aquatic biodiversity is generally high and once-through cooling is more common (figure 2). This corroborates the findings of Van Vliet et al (2012), which found that climate change will raise the likelihood of plants running into conflict with regulatory limits as ambient temperatures increase.
5.2. Current federal data is insufficient to assess the ecological impacts of thermal discharge
While thermal discharges from once-through cooling systems appear likely to impact aquatic ecosystems, the current datasets available from the EIA are insufficient to evaluate watershed-scale impacts to aquatic biodiversity and ecosystems. Given the inherent problems with the availability of data, the scope of our assessment has been limited. In order to assess the impact of thermal discharges on in stream temperatures, local information on power plant and river discharge rates, mixing regime, and spatially and temporally comprehensive records of temperatures are needed. The EIA collects data on power plant discharges but it has been found that power plant reporting on the volume of water consumed and discharged may be inaccurate (Averyt et al 2013). Data reporting to the EIA has improved as of 2010 to include average and peak temperatures on a monthly basis going forward (EIA 2010). While the new reporting requirements will provide more comprehensive data in the future, it will take several years before a time series is available to assess temperature trends in cooling source waters or thermal discharges. Although the federal datasets used in this study do not provide enough detail for a full assessment on the impact of once-through cooling systems on aquatic biodiversity, peak temperature data may be comprehensive enough to at least evaluate the risk of current and future regulatory violations. Almost two thirds of US power plants using once-through cooling who are required to report peak intake and discharge temperatures did so continuously from 1996–2005, and less than 1% of these cooling systems reported obviously erroneous data.
6. Conclusion
This study identifies a number of questions for future research. Firstly, the temperature data currently available from the EIA is insufficient to usefully evaluate the ecological impacts of thermal discharges from power plants. More robust analyses may be possible using the physics of heat exchange as a proxy for thermal loading, and some studies are beginning to incorporate this approach (Miara and Vorosmarty 2013, Stewart et al 2013). However, long-term datasets on the ambient intake and discharge water temperatures from power plants may be useful to help calibrate such models.
Climate change appears likely to exacerbate regulatory conflicts in rivers such as the Upper Catawba basin, where thermal discharge temperatures already exceed state limits. River temperatures in the United States are already facing a warming trend due to urbanization and higher air temperatures, the latter of which is expected to increase under climate change (Webb and Nobilis 2007, Kaushal et al 2010). Variations in precipitation from climate scenarios indicate that the impacts of climate change on rivers will not be homogeneous (Milly et al 2008). In particular, rivers experiencing decreases in flow will be more strongly affected by warmer air temperatures (Van Vliet et al 2011). There is a need for additional risk assessment to identify the specific regions and assess where conflicts between rising river temperatures and regulatory limits are most likely to occur.
In particular, the energy industry needs to prepare for problems related to power generation. Analysis of rising temperatures and the costs of meeting associated regulatory restrictions should be factored in to decisions extending the life of a once-through cooled power plant versus closing or updating its cooling system. For example, the Tennesee Valley Authority has modeled the impact of increased temperatures on power plant cooling and reservoir operations along the Tennessee River (Miller et al 1992). There is a need for more local studies of the ecosystem impacts of thermal discharges from power plants, under both current conditions and future warming scenarios. In the United States, it may be useful to focus these studies in the South-Atlantic Gulf, Tennessee, and Ohio River basins, particularly in those watersheds where aquatic biodiversity is high and thermal discharges have already reached regulatory limits.
More than half of power plant cooling systems are already reporting discharging water at maximum temperatures above typical regulatory limits. While the practice of granting thermal variances in NPDES permits offers some flexibility by allowing plants to circumvent existing water quality standards, it is unclear how this can protect aquatic ecosystems that are facing accelerated warming under climate change (Craig 2010). Force water quality standards and those who protect endangered species, as well as utilities and other stakeholders. It may also be valuable to consider how watershed management can best adapt to balance human needs for electricity with aquatic ecosystem health.
Acknowledgments
We gratefully acknowledge funding for this research from The Kresge Foundation, Wallace Research Foundation, and Roger and Vicki Sant, and the research oversight provided by the EW3 Scientific Advisory Committee—Peter Frumhoff (Union of Concerned Scientists), George Hornberger (Vanderbilt University), Robert Jackson (Duke University), Robin Newmark (NREL), Jonathan Overpeck (University of Arizona), Brad Udall (University of Colorado Boulder, NOAA Western Water Assessment), and Michael Webber (University of Texas at Austin). In addition, we are thankful for review and guidance from Kristen Averyt (University of Colorado Boulder), James Meldrum (University of Colorado Boulder), and Erika Spanger-Siegfried (Union of Concerned Scientists).