

Abstract
Biodiversity loss and climate change both result from tropical deforestation, yet strategies to address biodiversity loss have focused primarily on protected areas while strategies to address climate change have focused primarily on carbon payments. Conservation planning research has focused largely on where to prioritize protected areas to achieve the greatest representation of species at viable levels. Meanwhile research on reducing emissions from deforestation and forest degradation (REDD+) has focused largely on how to design payments to achieve the greatest additional reduction in greenhouse gases relative to baseline rates. This divergence of strategies and research agendas may be attributed to four factors: rare species are more heterogeneously distributed than carbon; species are more difficult to measure and monitor than carbon; species are more sensitive to ecological processes and human disturbance than carbon; and people's value for species diminishes beyond a threshold while their value for carbon storage does not. Conservation planning can achieve greater biodiversity benefits by adopting the concept of additionality from REDD+. REDD+ can achieve greater climate benefits by incorporating spatial prioritization from conservation planning. Climate and biodiversity benefits can best be jointly achieved from tropical forests by targeting the most additional actions to the most important places. These concepts are illustrated using data from the forests of Indonesia.
Export citation and abstract BibTeX RIS

Content from this work may be used under the terms of the Creative Commons Attribution 3.0 licence. Any further distribution of this work must maintain attribution to the author(s) and the title of the work, journal citation and DOI.
1. Introduction
Tropical deforestation contributes to two global environmental crises—biodiversity loss through the destruction of forest species' habitat, and climate change through emissions of greenhouse gases when forests are cleared or degraded [1, 2]. To address these crises, the 1992 Earth Summit in Rio de Janeiro produced two international environmental conventions—the Convention on Biological Diversity (CBD) and the United Nations Framework Convention on Climate Change (UNFCCC). Despite their common natural and political origins, the international policy responses to biodiversity loss and climate change have evolved largely in isolation and have diverged in a number of important aspects. The same countries that have used protected areas ('parks') to preserve their forests' stocks of biodiversity [3] are now preparing to receive carbon payments to reduce their forests' flows of greenhouse gas emissions to the atmosphere [4].
The scientific research agendas informing these two policy responses have diverged as well. A thirty-year-old literature on systematic conservation planning has focused predominantly on determining where protected area networks can be sited to achieve the greatest representation of species at viable levels [5]. Meanwhile an emerging literature on REDD+ (reducing emissions from deforestation and forest degradation, plus conservation, sustainable management and enhancement of forest carbon stocks) focuses on how to design carbon payments to incentivize the greatest additional emission reductions relative to baseline rates.
While the biophysical and policy links between climate change and biodiversity loss have been the focus of many studies [6–8], we are not aware of a systematic discussion of why the policy responses for addressing biodiversity loss and climate change from tropical forests diverged so markedly in the first place. Understanding the factors contributing to this divergence of policies leads to opportunities to improve strategies for both biodiversity conservation and climate change mitigation, and to better provide both services jointly. In this essay we explain the divergent evolution of parks for biodiversity conservation and carbon payments for climate change mitigation in terms of four biophysical and economic differences between species and carbon (sections 2–4, table A.1). We suggest that biodiversity conservation from forests can be improved be adopting the concept of 'additionality' from climate change mitigation (section 5), and that climate change mitigation from forests can be improved by incorporating spatial prioritization from conservation planning (section 6). And we show how the joint production of biodiversity conservation and climate change mitigation from tropical forests can be best achieved by targeting the most additional actions to the most important places (section 7). We illustrate these concepts using data on forests from Indonesia—a country with forests that are megadiverse [9], rich in carbon [10], and highly threatened.
2. Species versus carbon
The relevant units of analysis for biodiversity loss and climate change—species and carbon respectively—differ in the heterogeneity of their spatial distribution. Biodiversity encompasses the structural, functional and compositional attributes of genes, species, and ecosystems [11], but the most common unit of analysis is species. The relevant unit of analysis for climate change is tons of carbon or carbon dioxide equivalent. The spatial distribution of both species and carbon is heterogeneous—the most species-rich area within a 9 km2 grid of Indonesia provides habitat for three times as many forest-dependent mammal species as the median area (figure 1(a)); the area with the maximum carbon density observed in above-ground woody biomass has 1.5–2.3 times the carbon density of the median area (figure 1(b)) (see appendix for calculations). However, the distribution of rare species is far more heterogeneous—the area with the maximum rarity-weighted habitat (the sum of inverse range sizes across all mammal species) has 204 times the rarity-weighted habitat of the median area (figure 1(c)).

Figure 1. Distribution of species, carbon, rare species across Indonesia's forests. (a) Distribution of 528 mammal species across forest areas ordered by descending species richness; (b) distribution of carbon in above- and belowground woody biomass across forest areas ordered by descending carbon density; (c) distribution of 528 mammal species ordered by descending summed range-size rarity.
Download figure:
Standard image High-resolution image
Figure 2. Accumulation of species and carbon across Indonesia's forests. (a) Cumulative number of 528 mammal species for which habitat target area is achieved across forest areas ordered by descending summed range-size rarity; (b) cumulative carbon in above- and belowground woody biomass across forests ordered by descending carbon density.
Download figure:
Standard image High-resolution imagePeople value species and carbon differently. People often place the greatest value on maintaining a species' population or habitat size at a level that is sufficient to ensure the continued persistence of the species, with diminishing returns to increases above this threshold [12]. Thresholded value, combined with habitat overlap across multiple species, makes it possible to achieve habitat area protection targets for a large number of species within a relatively small total area—5% of Indonesia's forest area could provide a target level of 100 000 ha of forest habitat for 80% of Indonesia's forest-dependent mammal species, using a simple site selection criterion based on range-size rarity (figure 2(a)). Strategically selecting target areas that provide outsized habitat contributions has been at the core of species-based conservation strategies [13, 14]. By comparison, people value carbon in an essentially linear way; the first ton of carbon storage is as valuable for climate change mitigation as the millionth or billionth ton. So maintaining large-scale forest carbon storage requires actions over large areas of forest—5% of Indonesia's forest area stores no more than 6.2–7.3% of its carbon in above- and belowground biomass (figure 2(b)), and no more than 12.6–12.8% of its emittable greenhouse gases after including contributions from peat and non-peat soils [15–17].
Biodiversity is generally much more difficult to measure and monitor than carbon. The distribution of many species is unknown; it is estimated that 86% of existing terrestrial species and 91% of marine species still await description [18]. And many areas experience high turnover in species over space and time [19]. As a result, intensive monitoring of biodiversity is feasible only at small scales. Measurement of biodiversity over larger scales has necessarily relied on the assumption that specific groups such as vertebrate taxa, endemic, threatened, keystone or flagship species, or ecosystem types can be used as effective proxies for the status of species more generally [20]. In contrast, the carbon stored in trees and soil is relatively straightforward to measure and monitor over large areas [10, 15, 21, 22] because it is essentially stationary. Knowing the areas of forest loss and the carbon densities of the forest in these areas allows the calculation of greenhouse gas emissions from deforestation. Greenhouse gas emissions are measured in tons of carbon dioxide equivalent per year and can be directly compared with emissions from industrial sources.
Species are more sensitive to ecological processes and human activities than carbon. Species' persistence is heavily dependent upon spatial ecological processes, including habitat connectivity [23] and climate stability [6]. In contrast, spatial interactions in carbon storage are negligible over large distances, in the sense that the quantity of carbon stored in one forest has little to no impact on the quantity of carbon stored in forest elsewhere. The simplest tiers of carbon accounting are based on default carbon densities that disregard fluctuations due to ecological disturbance and succession [24]. Many species are sensitive to human activities, ranging from hunting to habitat disturbance to mere human presence in extreme cases. Meanwhile, carbon storage can be altered by large landscape modifications but is unaffected by many passive uses of forest.
The four differences between biodiversity and carbon discussed above lead logically to the policy responses commonly used to address biodiversity loss and climate change. Species' heterogeneous distribution and thresholded value allow policies for biodiversity to achieve success even while focusing on relatively small areas; the more even distribution and linear value of forest carbon necessitate policy actions over larger scales. The challenge of monitoring species, along with species' sensitivity to ecological processes and human disturbance, suggests the need for management interventions to address specific ecological and social issues; the relative ease of monitoring carbon and its compatibility with many human activities allows the use of policies that incentivize marginal changes in carbon provision that are flexible to the choice of land management. For biodiversity, parks aim to provide specific management within compact, contiguous areas. For carbon, payments aim to incentivize marginal changes in provision by land managers dispersed across larger areas.
3. Parks versus payments
The suitability of parks for biodiversity conservation has led them to be adopted by nearly every country on Earth [25]. As mainstream popular concern and scientific attention to biodiversity loss accelerated in the 1970s and 1980s [26, 27], governments responded by expanding protected areas from reserves for scenery or game animals to networks representative of biological diversity [25]. By 2011 these protected areas numbered more than 157 000 and covered over 16 million square kilometers (12.2% of Earth's land area) [28]. Half of the world's 821 terrestrial ecoregions are more than 10% protected by area [28], with at least some habitat protected for all but 12% of species and 20% of threatened species [29].
At its extreme the creation of protected areas takes a 'scorched earth' view of human activity: shelter sufficient habitat for species to persist within increasingly isolated protected areas under the assumption that any areas outside of protection would ultimately be lost to human threats [30]. In practice protected areas vary along a continuum in the extent to which they restrict access or economic activity, from strict nature reserves to more permissive multiple-use areas. Politically, the implementation of protected areas is supported by the CBD, which provides targets and guidelines for achieving representation [7, 8]. Biodiversity payments [31, 32] have faced challenges [33] achieving the same level of uptake.
Meanwhile, carbon management has focused on incentive policies—carbon payments from markets or funds [34]. International concern about climate change coalesced into policy action with the formation of the UNFCCC in 1992 and the negotiation of the Kyoto Protocol in 1997. Attention to forests was limited in the Kyoto Protocol to provisions on Land Use, Land-Use Change, and Forestry (LULUCF) for developed countries and Afforestation and Reforestation in the Clean Development Mechanism (CDM A/R) for developing countries. A major policy effort to address emissions from deforestation in tropical countries began with Costa Rica and Papua New Guinea's proposal in 2005 for reducing emissions from deforestation (RED) [35], which has since grown to include forest degradation, conservation, sustainable management of forests, and enhancement of forest carbon stocks (REDD+) [4].
Carbon payments are to be 'payments for performance', meaning that financial transfers are to be contingent upon the achievement of monitored, reported and verified emission reductions relative to baseline rates, or reference levels. Because of the UNFCCC principle of 'common but differentiated responsibilities', participation in REDD+ is voluntary rather than mandatory on the part of developing countries. This framework of voluntary actions in exchange for payments is consistent with a view of people as economically rational land-use decision makers with rights to the use of forested land. Incentive payments are intended to 'make forests worth more alive than dead'. That is, to tip the scales of land-use decision making in favor of forests by making conservation of forests more profitable than clearing for alternative land uses. Participation in the negotiation and development of REDD+ has been widespread—75 countries currently participate in the REDD+ Partnership, an interim platform for scaling up REDD+ actions and finance [36]. Although REDD+ is still in an incipient stage it is widely agreed that carbon payments have the potential to reduce emissions at a globally significant scale [37, 38]. While the CDM, voluntary carbon markets, and national payment-for-ecosystem-services (PES) programs [39–41] have all provided carbon payments at the site scale, it is anticipated that REDD+ will also incentivize other policy actions at the national scale, including but not limited to the monitoring and enforcement of moratoria [42] and protected areas.
4. Representation versus additionality: where to protect stocks versus how to reduce flows
The key technical challenge associated with the designation of protected areas is spatial prioritization—deciding where to locate protected areas to protect the most valuable stocks of biodiversity. Success is commonly measured in terms of 'representation'—the number of species or ecosystems for which the protected area network provides sufficient habitat area to ensure their persistence [43]. This challenge has been formalized by scientists as a constrained optimization problem: what configuration of protected areas can achieve the greatest representation given a fixed area or budget for the network, or alternatively, what configuration of protected areas can achieve a desired level of representation at the least cost [44]. The discipline of systematic conservation planning [5] has expanded from a reserve site selection problem based solely on biological values to spatial prioritizations that have included to varying degrees persistence, connectivity, cost, socioeconomic dynamics, ecosystem services, and biodiversity benefits in the unprotected matrix landscape [20, 44, 45]. In addition to site selection, the success of protected areas at conserving biodiversity also depends on the effectiveness of management [46–48].
The key technical challenge for REDD+ is designing policies that will slow, halt, and reverse the flow of greenhouse gas emissions to the atmosphere from deforestation [4]. Success is measured by how much policies, programs, or projects have reduced emissions relative to baseline levels (additionality). Because the amount of additional emission reductions achieved is the basis for financial compensation, much work has focused on how payments and policies can be designed to reduce the flow of emissions to the atmosphere most effectively, cost-efficiently and socially equitably [49–51]. A scientific and policy literature is emerging to address questions such as how different land-use activities should be monitored and included in the scope of payments [52, 53], how reference levels of emissions should be set [54, 55], how leakage of deforestation should be addressed [56] and how benefits and responsibilities should be shared within countries [17].
5. Improving conservation planning by considering additionality
Although the policy instruments for addressing biodiversity loss and climate change in tropical forests have diverged for the reasons described above, each can best achieve its goals when it adopts a concept most associated with the other. By considering additionality, systematic conservation planning can achieve greater reductions in biodiversity loss relative to what would otherwise occur. A growing literature has retrospectively evaluated the impact of protected areas [57–65], finding that the degree to which protection reduces deforestation varies spatially [66]. However, conservation planning models are only beginning to incorporate a probabilistic assessment of threat [67, 68], and even fewer studies have considered the other component of additionality [69]—the degree to which probable threat can be reduced between a without-policy scenario and a with-policy scenario as a result of an intervention (with one recent exception) [70]. A recent review of the reserve site selection literature found that only one of 71 peer-reviewed studies explicitly incorporated the difference in probable threat between reserved and non-reserved scenarios [69]. We are not aware of any jurisdiction where new protected areas have been sited on the basis of additionality—the current network of global protected areas remains skewed toward lands that are remote, unsuitable for agriculture, or otherwise facing little threat [66, 71]. The same review found that zero out of six conservation plans estimated the degree to which reserves could reduce threat [69].
The advantage of considering additionality in site selection is illustrated in figure 3. We compared two approaches for prioritizing the location of protected areas across sites. The first approach did not consider additionality. It selected sites for protection based solely on biological value (sites were ranked in descending order of their rarity-weighted habitat area; see appendix for calculations). This approach implicitly (and erroneously) assumes that habitat would be completely lost in the absence of protection and completely maintained with protection. The second approach considered additionality in addition to biological value when selecting sites (sites were ranked in descending order of the short-term potential for a protected area to reduce the probable loss of rarity-weighted habitat at the site relative to a non-protection scenario). The approach that considered additionality produced a protected area network with somewhat lower representation but far larger reduction in lost habitat as a result of protection (20% fewer species for which a 1000 000 ha target is met with 10 000 000 of forest, but 159% greater reduction in habitat loss as a percentage of species' initial range size, in the illustrative data from Indonesia) (figures 3(a) and (b)). Neither approach considered complementarity or connectivity between selected sites, which would be necessary considerations for a true spatial prioritization using conservation planning software [70]. However a simple approach is sufficient to illustrate the benefit of considering additionality.

Figure 3. Representation and additional habitat achieved through protected areas without and with consideration of additionality. (a) Number of species for which a representation target of 100 000 ha habitat within protected areas is achieved; (b) additional habitat area achieved as per cent of species' initial habitat, summed across 528 species.
Download figure:
Standard image High-resolution image6. Improving REDD+ by considering spatial prioritization
Likewise, REDD+ policies and programs can more effectively and cost-efficiently reduce emissions across heterogeneous landscapes by adopting spatial prioritization techniques from systematic conservation planning. Rules for REDD+ at the international and national levels are often designed with little consideration for where they will be put in place. In reality the effectiveness of incentive payments or other REDD+ policies and measures [72] will depend on where they are implemented. Strategic geographic prioritization of investments, advocated for PES programs [73, 74], will take on increased importance in an interim phase of REDD+ in which start-up costs are high, available finance is low, and programs are piloted regionally within selected countries preceding full national implementation across many countries.
The advantage of spatially prioritizing REDD+ interventions is illustrated in figure 4. Pilot REDD+ programs in Indonesia, for example, would be well targeted to provinces where carbon payments have the greatest potential to reduce emissions relative to expected emissions without a REDD+ program, such as Riau and Papua (see appendix for calculations). Spatial variation can be applied not only to interventions to reduce emissions but also to investments in monitoring, reporting and verifying carbon emissions (MRV) [52], programs to prevent leakage [56], and consideration of biodiversity and other co-benefits [75].
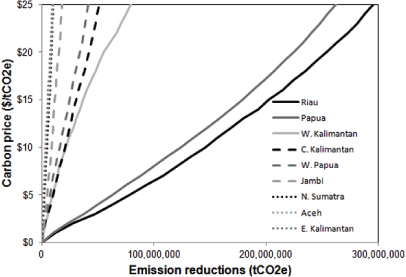
Figure 4. Reductions in emissions from deforestation at varying carbon prices by province of Indonesia.
Download figure:
Standard image High-resolution image7. The most effective actions in the most important places to achieve multiple benefits
Since tropical forests jointly provide both carbon storage and biodiversity habitat, it is logical to consider an integrated approach to climate change mitigation and biodiversity conservation. A sizable literature is emerging on the opportunities and tradeoffs of leveraging carbon payments for biodiversity conservation [75–80] and on the climate change mitigation benefits provided by protected areas [81–84]. However, neither REDD+ nor systematic conservation planning in isolation has been ideally designed for the integrated provision of carbon and biodiversity benefits from forests. For example, carbon payments may not automatically lead to forest conservation in the places with greatest biodiversity value [85]. And protected areas alone are unlikely to be sufficient to incentivize emission reductions across of the scale of land area required to address the climate crisis.
Future policies can achieve the greatest biodiversity and climate benefits from tropical forests by targeting the most effective actions to the most important places to achieve multiple benefits. Such an approach would draw upon both spatial prioritization and estimation of additionality. This approach would recognize the principle of using multiple instruments to achieve multiple policy objectives [86] while integratively assessing opportunities for and estimating impacts of biodiversity conservation and climate mitigation.
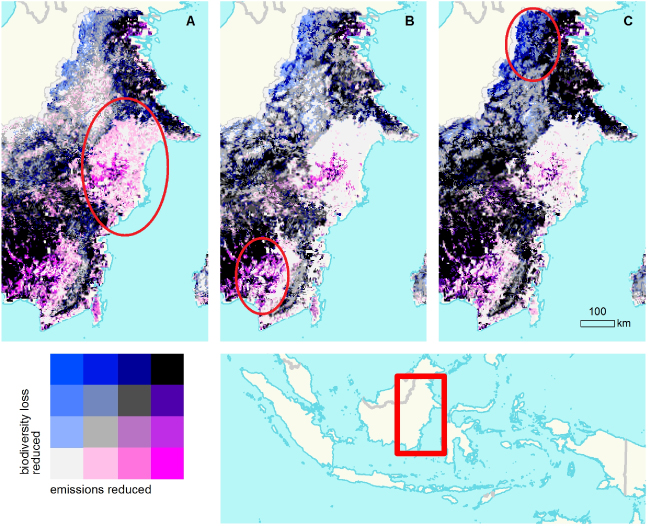
The benefit of considering the spatial variation in the impacts of multiple policies is illustrated in figure 5 with an example from eastern Kalimantan, Indonesia. Protected areas, carbon payments, and biodiversity payments would produce different spatial distribution of benefits for climate and biodiversity. Visual inspection shows illustrative regions where protected areas could reduce emissions by more than carbon payments or biodiversity payments (figure 5(A)), where carbon payments could reduce emissions by more than biodiversity payments (figure 5(B)), or where biodiversity payments could reduce biodiversity loss by more than carbon payments or protected areas (figure 5(C)).
Figure 5. Location of additional emission reductions and habitat value achieved using three policy instruments. (A) Protected areas. (B) Carbon payments. (C) Biodiversity payments.
Download figure:
Standard image High-resolution image
The concept of spatial variation in the additional impacts of policy instruments can be extended beyond incentive payments and protected areas to taxes on deforestation, moratoria on agriculture or timber concessions, or investments in agricultural improvements. And consideration of multiple benefits from tropical forests can be broadened beyond climate stabilization and biodiversity conservation to include poverty alleviation, food security, provision of fresh water, or other ecosystem services.
Acknowledgments
The authors thank two anonymous referees, Lina Barrera, Ruben Lubowski, Will Turner and James Watson for helpful comments. We are grateful to Frank Larsen and Carlo Rondinini for generously sharing data and to Kellee Koenig for maps.
Appendix:
The illustrative analyses provided in this study draw upon the OSIRIS-Indonesia database and spreadsheet tool for modeling the impacts of alternative policies for REDD+ [17]. This database includes spatial data from across Indonesia on forest cover in 2000 [87], deforestation from 2000–2005 [88, 89], carbon density (forest carbon in above- and belowground biomass per hectare) [10, 90], and emissions from peat soils [16]. This data was supplemented with additional data sets on carbon density [21] and modeled distribution of 528 mammal species [91]. These data were gridded and aggregated to 195 466 3 km × 3 km grid cells representing 96% of the forest area of Indonesia.
The species richness of each grid cell, si, was calculated as the sum of the number of species modeled to occur in cell i. Grid cells were ordered in descending species richness. The resulting distribution of richness across Indonesia's forest is presented in figure 1(a).
The summed range-size rarity of each grid cell, ri, was calculated as the sum across all species j of the fraction of the species' total forest habitat represented by the area of forest habitat in that grid cell, fij. That is, ri = ∑j(fij/∑ifij). Grid cells were then ordered in descending summed range-size rarity. The resulting distribution of summed range-size rarity across Indonesia's forest is presented in figure 1(c).
With grid cells ordered in descending summed range-size rarity, grid cells were added sequentially to a hypothetical network of forest areas. The accumulated number of mammals species for which a representation target was achieved was calculated for representation targets of 10 000, 100 000, and 1000 000 ha. The resulting species accumulation curves across Indonesia's forest are presented in figure 2(a).
Grid cells were ordered in descending carbon density, based on three data sets of above- and belowground biomass carbon. The resulting distribution of carbon density across Indonesia's forest is presented in figure 1(b).
With grid cells ordered in descending carbon density, grid cells were added sequentially to a hypothetical network of forest areas. The resulting carbon accumulation curves across Indonesia's forest are presented in figure 2(b).
The additional benefit of a policy intervention is defined as the difference in the benefit provided with and without the intervention (bw/intervention − bw/o intervention). For example, the additional forest cover associated with the presence of a protected area at site i is the difference in expected forest cover with or without the protected area,  . The expected forest cover at each site with and without the presence of a protected area (
 and
and  respectively) were calculated by subtracting expected deforestation from 2000–2005 at each site with and without the presence of a protected area [17] from forest cover in 2000. The additional summed range-size rarity associated with the presence of a protected area at a site is the product of the additional forest cover associated with the presence of a protected area, and the summed range-size rarity of the site. That is,
  . Grid cells were then ordered in descending additional summed range-size rarity, descending summed range-size rarity, and randomly. The accumulated number of mammal species for which a representation target of 100 000 ha was achieved was calculated for each ordering. The resulting species accumulation curves across Indonesia's forest are presented in figure 3(a). The accumulation curves for additional summed range-size rarity are presented in figure 3(b). (Note that the multivariate regression technique used above [17] to estimate expected deforestation likely overestimates the impact of protected areas in reducing deforestation, relative to more sophisticated matching techniques that could be used to compare protected sites only to unprotected sites with equal propensity to have been designated a protected area. Thus the results presented here are intended to be illustrative of the concept of additionality rather than exact estimates of the magnitude of protected areas' additionality.)
The additional emission reductions associated with the carbon payments for reduced emissions from deforestation at site i is the difference in emissions with or without carbon payments. That is,  , where ei represents the emissions associated with one hectare of deforestation at site i. Additional emission reductions were calculated for each province of Indonesia under varying carbon prices using OSIRIS v3.4 [17]. In the OSIRIS model, deforestation at every 3-km × 3-km site with REDD+ was modeled based on land-use decisions made by districts in response to a carbon price and other elements of an economic incentive structure set by the national government. The following parameter assumptions were applied: 'effective' price elasticity= 0.0 (no leakage); exogenous agricultural price increase= 0%; peat emission factor = 1474 tCO2e ha−1; social preference for agricultural revenue relative to carbon revenue = 1.0; start-up and transaction costs = $0; site-level accounting; national government share of revenue = 0%; national government share of responsibility for costs = 100%. Additional emission reductions by province are presented in figure 4.
Additional forest cover at a carbon price of $10/tCO2e was calculated using OSIRIS v3.4 with the same parameter assumptions as above. Additional forest cover at a biodiversity payment price of $200/species/hectare was calculated using OSIRIS v3.4 with the same parameter assumptions as above; this price was selected to achieve approximately the same level of total finance as a carbon price of $10/tCO2e. The additional biodiversity conservation value (summed range-size rarity) and the additional climate change mitigation value (emission reductions) of protected areas, carbon payments, and biodiversity payments are mapped in figures 5(a)–(c) respectively.
Table A.1. A side-by-side comparison of the systematic conservation planning for biodiversity and REDD+ carbon payments for climate.
| Approach | Systematic conservation planning | REDD+ |
|---|---|---|
| Motivating crisis | Biodiversity loss | Climate change |
| Vision | Ensure persistence of biodiversity | Stabilize atmospheric greenhouse gas concentrations |
| Biophysical characteristics | ||
| Primary natural feature | Species | Carbon |
| Secondary natural features | Ecosystems, genes | — |
| Unit | Number of species | tCO2e yr−1 |
| Spatial distribution of feature | Heterogeneous | Heterogeneous |
| Value placed on feature | Thresholded—high value on preventing extinction or extirpation | Linear—constant marginal value of emission reductions |
| Ease of measurement and monitoring | Difficult | Relatively straightforward |
| Policy characteristics | ||
| Consideration of human activity | 'Scorched earth'—people are threats or stewards | 'Make forests worth more alive than dead'—people are economically rational land-use decision makers |
| Primary policy mechanism | Protected areas | Carbon payments |
| Maturity of policy mechanism | Well established with decades of experience | Emerging |
| Policy institutions | CBD; international and local NGOs; national and state planning agencies | UNFCCC; multilateral readiness process; bilateral agreements; voluntary carbon markets |
| Finance | Public sector, bilateral and multilateral assistance, private donors | Public and private donors and markets |
| Rights | Governments can restrict geographic access rights or acquire land; private trusts can purchase land or access rights | Existing land and access rights can be maintained; government or private entities can purchase reduced usage; carbon rights often unclear |
| Social criticism | Geographical exclusion | Exclusion from benefits |
| Scientific characteristics | ||
| Objective | Preserve stock | Reduce flow |
| Challenge | Reserve site selection/spatial prioritization | Mechanism design |
| Question | 'Where?' | 'How?' |
| Primary measure of success | Representation | Additionality |
| Secondary measures of success | Persistence | Cost-effectiveness; equity |
| Relevant ecological processes | Fragmentation, dispersal | Disturbance, succession |
| Relevant spatial interactions (biophysical) | Connectivity; complementarity; 'irreplaceability' | — |
| Relevant spatial interactions (economic) | Crowding in/out | Leakage |