
Abstract
A number of recent studies present evidence of an increasing trend in Eurasian snow cover extent (SCE) in the October snow onset period based on analysis of the National Oceanic and Atmospheric Administration (NOAA) historical satellite record. These increases are inconsistent with fall season surface temperature warming trends across the region. Using four independent snow cover data sources (surface observations, two reanalyses, satellite passive microwave retrievals) we show that the increasing SCE is attributable to an internal trend in the NOAA CDR dataset to chart relatively more October snow cover extent over the dataset overlap period (1982–2005). Adjusting the series for this shift results in closer agreement with other independent datasets, stronger correlation with continentally-averaged air temperature anomalies, and a decrease in SCE over 1982–2011 consistent with surface air temperature warming trends over the same period.
Export citation and abstract BibTeX RIS

Content from this work may be used under the terms of the Creative Commons Attribution 3.0 licence. Any further distribution of this work must maintain attribution to the author(s) and the title of the work, journal citation and DOI.
1. Introduction
Recent assessments of Arctic snow cover extent (SCE) based on the NOAA satellite Climate Data Record (CDR; Robinson et al 1993, Brown and Robinson 2011) show evidence of marked seasonal asymmetry in snow cover onset versus disappearance over both the North American (NA) and Eurasian (EUR) sectors of the Arctic (Derksen and Brown 2011) with significant trends toward earlier continental-scale snow cover disappearance for the period since 1967 but relatively little change in snow cover onset. The NOAA record even shows evidence of significant increasing trends in October SCE over Eurasia over the past two decades (Cohen et al 2012). This is surprising because the in situ based air temperature record (CRUtem3v, Brohan et al 2006) suggests warming trends over Arctic land areas since 1980 have been higher in the September–October snow onset period (0.47 °C/decade) compared to the May–June melt period (0.34 °C/decade).
A priori one would expect closer coupling between snow cover and air temperature anomalies in the spring period because of the stronger potential for albedo feedbacks (e.g. Groisman et al 1994, Déry and Brown 2007, Fletcher et al 2009), and because (unlike snow melt) snow cover onset requires satisfying two conditions: air temperatures below freezing AND precipitation. There is evidence that declining sea ice extent in the Arctic is contributing to enhanced snow accumulation in some regions of the Arctic (Park et al 2012), however, the timing of snow cover onset should still be linked to air temperature through its influence on precipitation phase (Screen and Simmonds 2012).
Improvements in the frequency and resolution of satellite data (and the native resolution of the NOAA snow charts themselves; see section 2) over time may also contribute to the observed seasonal asymmetry in the NOAA SCE trends. Since 1966, there have been notable improvements in the quantity (more diverse sources of imagery) and quality (higher spatial resolution; more frequent temporal revisit) of the satellite data sources utilized to produce the NOAA snow analysis (Helfrich et al 2007). Intuitively, this should contribute to mapping relatively more snow in the snow onset period (increased potential to detect snow onset), and relatively less snow in the spring melt period (increased potential to detect snow disappearance). Charting snow cover in the snow onset period over northern latitudes with visible satellite imagery is particularly challenging because of a relatively shorter daylight period and increases in cloud cover that accompany snow cover onset (Groisman and Davies 2001). Brown et al (2010) evaluated the NOAA dataset over the Arctic during the May–June snow melt period and found large inconsistencies in some years but no evidence of any systematic change over time compared to other sources of information. To date, there has not been any detailed evaluation of the NOAA data record time series homogeneity during the snow cover onset period.
The objective of this letter is to examine the robustness of the observed increasing trend in October SCE trend in the NOAA dataset cited in a number of recent studies (e.g. Liu et al 2012, Cohen et al 2012) using multi-dataset estimates of SCE obtained from independent sources of snow cover information derived from in situ observations, satellite data, and reanalyses.
2. Data sets
Eurasian October SCE series were obtained from five independent data sources over the land area north of 50°N: (1) the NOAA chart Climate Data Record (NOAA, Brown and Robinson 2011), (2) reconstructed daily snow depths from a temperature index snowpack model (Brown et al 2003) driven by 6 h temperature and 12 h total precipitation from ERA-interim reanalysis (ERAint, Dee et al 2011); (3) daily snow mass from the MERRA reanalysis (MERRA, Rienecker et al 2011); (4) daily snow water equivalent estimates from Scanning Multichannel Microwave Radiometer (SMMR) and Special Sensor Microwave/Imager (SSM/I) passive microwave satellite data (PMW, Savoie et al 2009); and (5) daily in situ snow depth observations from the Global Surface Summary of the Day Version 8 dataset archived at the National Climate Data Center (GSOD, ftp://ftp.ncdc.noaa.gov/pub/data/gsod).
The NOAA CDR dataset has been used extensively in climate studies and model evaluations (e.g. Déry and Brown 2007, Frei et al 2005, Roesch 2006, Brown and Mote 2009). It combines NOAA weekly snow cover extent charts (derived manually by trained analysts from primarily optical satellite imagery) digitized to a 190.5 km polar stereographic grid covering the period 1966–1999 (Robinson et al 1993) with a pseudo-weekly chart aggregated from the 24 km resolution Interactive Multi-Sensor (IMS) daily snow product (Ramsay 1998, Helfrich et al 2007) from 1999 to present. There are no published studies specifically addressing the homogeneity of the NOAA dataset although in previous melt season evaluations over the Arctic (Wang et al 2005, Brown et al 2007, 2010) the NOAA dataset exhibited some discrepancies with other data sources related to inconsistent charting of patchy snow in the early period of record that has been addressed in the current CDR version of the NOAA product (Robinson 2010). SCE was computed from the gridded monthly snow cover database maintained at Rutgers University (http://climate.rutgers.edu/snowcover/) which gives the per cent of days in the month that a grid cell was more than 50% snow covered (henceforth referred to as the monthly snow cover fraction or SCF). Monthly SCF was computed for the other four datasets and interpolated to the NOAA grid for constructing Eurasian SCE series over common grid points.
Reconstruction of snow depths with ERA-interim temperature and precipitation fields was carried out using the temperature-index model of Brown et al (2003) that takes account of rain/snow separation, rain induced melt, snowpack aging, and melt rate as a function of air temperature and snow density. Reconstruction was necessary because the snow depth values included in the reanalysis were found to be inconsistent due to various problems with the in situ data ingestion and snow analysis scheme (see www.ecmwf.int/research/era/do/get/index/QualityIssues and www.ecmwf.int/newsevents/training/meteorological_presentations/2012/DA2012/deRosnay/surface_analysis_2012_part1.pdf). Monthly SCF values were computed from simulated daily snow depths over the 0.75° latitude/longitude ERA-interim grid assuming snow cover was present for daily snow depths ≥2 cm. This threshold was previously found to generate in situ snow cover estimates that agreed well with the NOAA product (Brown 2000).
Daily values of diagnosed snow water equivalent (SWE) from the MERRA Reanalysis (Rienecker et al 2011) were used to estimate monthly SCF assuming snow cover was present for daily SWE ≥4 mm (approximates the 2 cm depth threshold used in ERAint assuming a snowpack density of 200 kg m−3). Snow cover in MERRA is diagnosed with a multi-layer physical snowpack model (Stieglitz et al 2001). Reichle et al (2011) show that the MERRA SWE fields agree closely with values estimated from the Canadian Meteorological Centre operational daily snow depth analysis.
Evaluation of the homogeneity of the ERA-interim and MERRA October air temperatures against CRUtem3v revealed evidence of a warm bias of more than 1 °C after 2005 which was not present earlier in the time series (not shown). The precise reasons for this are unclear, but the timing coincides with the introduction of GPS radio occultation measurements into the reanalyses (Poli et al 2010).
Passive microwave-derived snow cover data covering the 1979–2007 period were generated from daily SWE estimates provided by the National Snow and Ice Data Center (NSIDC; Version NSIDC_S11_SWE) (Savoie et al 2009). The dataset is described in detail in Brown et al (2010) and includes corrections to take account of the shift in brightness temperatures between the SMMR (1978–1987) and the SSM/I (1987–2007). A minimum SWE cut-off of 7.5 mm was applied by NSIDC to remove noise in the dataset. Monthly SCF values were obtained assuming snow cover was present for SWE values exceeding this minimum retrieval. The SWE estimates within the NSIDC dataset can be highly uncertain (Takala et al 2011) but converting SWE to SCE was previously shown to provide realistic estimates of snow cover variability in the spring (Brown et al 2007).
The estimation of monthly SCF from in situ daily snow depth observations in the GSOD dataset requires care as the number of observations varies from year to year in response to snow cover conditions (null observations are not reported). The period from 1982 to 2010 was determined to have consistent numbers of snow depth observations for this purpose. Daily snow depth observations from stations north of 50°N for the month of October were interpolated to the same 190.5 km polar stereographic grid used for the NOAA snow charts using inverse distance weighting and a search radius of 200 km around each grid cell. A grid cell was assumed to be snow covered if the interpolated depth was ≥2 cm. The difference between station elevation and the mean grid cell elevation was taken into account by applying an empirical adjustment derived from analysis of SCF elevation dependence in the NOAA IMS-4 km snow cover product.
After interpolation to the NOAA grid (inverse distance method) monthly SCF data for the five datasets were obtained at 304 common grid cells over Eurasia north of 50°N shown in figure 1. This represents 55% of the total number of NOAA snow-covered land grid cells over Eurasia north of 50°N but captures the variability in the continental snow line e.g. SCE series from the NOAA snow charts over the common grid are highly correlated (r > 0.95) with SCE series obtained from the complete grid. There was insufficient overlapping data to extend the analysis over North America.

Figure 1. Mean (1982–2005) October snow cover fraction (%) for five independent datasets at the common grid points shown in the GSOD panel. The standard deviation of the five datasets is shown in the last panel.
Download figure:
Standard image3. Dataset intercomparison and NOAA evaluation
The mean 1982–2005 October SCF for each dataset and the five dataset standard deviation are presented in figure 1 (note that years after 2005 were not used in the NOAA evaluation because of the warm bias in the two reanalyses noted in section 2). The standard deviation was less than 15% over much of the area (average of 11.4% over all grid points) with the largest between-dataset variability over northern Scandinavia and the mountainous areas in southern Siberia.
MERRA and ERAint exhibited significant positive correlations with GSOD at 79% and 78% of grid points respectively over the Eurasian domain compared to significant correlations at only 46% of grid points for both NOAA and PMW. The better agreement between the reanalyses and the surface observations may be partly due to similar definitions of snow cover i.e. snow cover is defined by the number of days with surface snow depth exceeding a relatively shallow threshold. Conversely, NOAA snow cover is controlled by the presence/absence of snow cover based on an areal threshold (at least 50% of a grid cell must be snow covered), and vegetation and cloud cover influences the discrimination of the snow-covered area. Likewise, PMW mapping of snow cover is affected by a number of factors including terrain, vegetation, background soil conditions, and snow properties (Langlois et al 2012, Takala et al 2011).
Standardized SCE anomaly time series for 1982 through 2011 (relative to a 1982–2005 reference period) for the five data sets are shown in figure 2. The influence of the warm bias in the two reanalyses is clearly visible after 2005. Detrended correlation analysis of the series over the 1982–2011 period (table 1) revealed significant correlations between all series except PMW and GSOD. Both reanalyses were highly correlated to NOAA, and the satellite and reanalysis series were more strongly correlated to each other compared to correlations with GSOD. Analysis of the SCE difference series between NOAA and each of the four independent evaluation datasets (figure 3) over the 1982–2005 period shows a strikingly consistent relative increasing trend in NOAA SCE that averages close to 1.0 × 10⁶ km2/decade over the four datasets. That the same trend in the difference between NOAA and each reference dataset is observed in observations, passive microwave satellite data, and two reanalyses makes a strong case for suspecting that October snow cover has not been consistently mapped over Eurasia in the NOAA dataset.
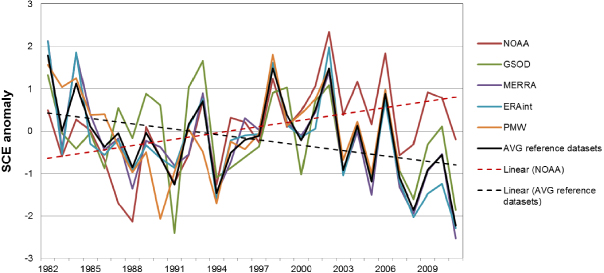
Figure 2. Standardized anomaly series (1982–2005 reference period) of Eurasian October SCE for the five datasets over the 1982–2011 period and the average of the reference datasets. The PMW series ends in 2007. The linear trend for NOAA and the reference dataset average are shown as dashed lines.
Download figure:
Standard imageTable 1. Between-dataset detrended correlations for SCE series derived over the common grid (1982–2011).
| GSOD | NOAA | ERAint | MERRA | |
|---|---|---|---|---|
| NOAA | 0.59a | — | — | — |
| ERAint | 0.65a | 0.83a | — | — |
| MERRA | 0.66a | 0.87a | 0.95a | — |
| PMW (1982–2007) | 0.41 | 0.76a | 0.76a | 0.76a |
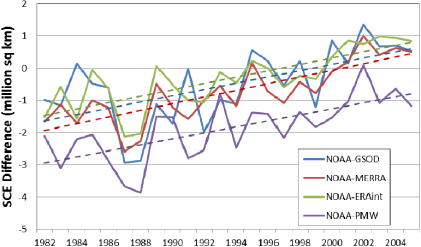
Figure 3. Difference in October Eurasian SCE (106 km2) between NOAA and four independent datasets computed over common grid points. Dashed lines are the least-squares linear trend.
Download figure:
Standard imageThe NOAA SCE series shows a statistically significant (0.05 level) increase in Eurasian October SCE of 0.58 × 10⁶ km2/decade over the 1982–2011 period compared to a statistically significant decreasing trend over the 1982–2011 period of −0.26 × 10⁶ km2/decade from the average of the four evaluation datasets (figure 2). The later conclusion is consistent with Peng et al (2013) who observe widespread trends to later dates of snow cover onset over NH land areas over the 1980–2006 period from in situ daily snow depth observations. Adjusting the NOAA series for the observed internal trend significantly improves the correlation between NOAA October SCE series and air temperature anomalies averaged over 50–70°N from CRUTem3v from r =− 0.32 (not significant at 0.05 level) to r =− 0.68 (significant at 0.05 level) over the 1982–2011 period. It also increases the computed temperature sensitivity of Eurasian October SCE from −0.41 × 10⁶ to −0.80 × 10⁶ km2 °C−1 which is comparable to the Arctic spring SCE-temperature sensitivity of between −0.8 and −1.0 × 10⁶ km2 °C−1 determined by Brown et al (2010). Analysis of Arctic SCE-temperature sensitivity for the eight CMIP5 models used in Derksen and Brown (2012) over the 1967–2011 period revealed similar SCE-temperature sensitivities for the main Arctic snow onset (October −0.70 × 10⁶ km2 °C−1) and melt (June −0.81 × 10⁶ km2 °C−1) periods.
The linear trend in the difference series (NOAA minus each evaluation dataset) over the 1980–2005 period was plotted at common grid points where snow cover varied between 0 and 100% to examine the consistency of the spatial patterns between datasets. The results (figure 4) are similar for all four evaluation datasets and show widespread relative increases in NOAA SCF of 1–2% yr−1 over northeastern Europe and large regions of the Siberian boreal forest. From a visual comparison of the results in figure 4, forest density and surface elevation do not appear to play a major role in the observed difference patterns.
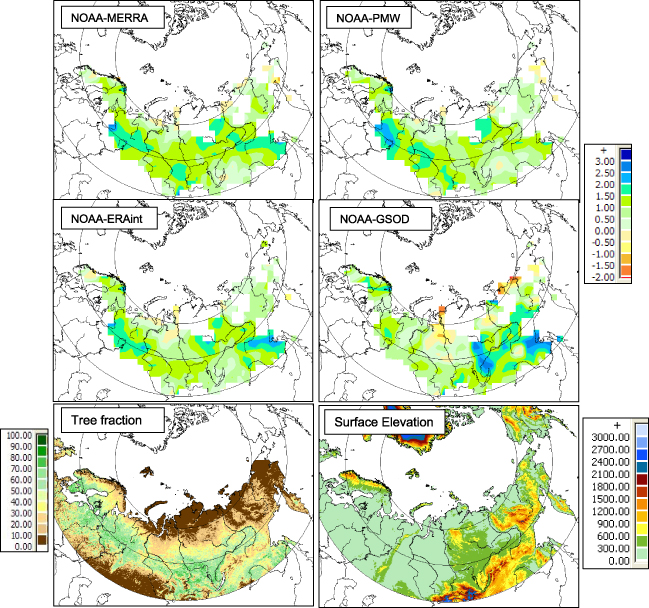
Figure 4. Top four panels: local linear trend in grid point difference series of October SCF (%) between NOAA and the four evaluation data sets over the 1982–2005 period. Units are % yr−1. Bottom left panel: average tree fraction (%) from 500 m resolution MODIS Vegetation Continuous Field product (Hansen et al 2003). Bottom right panel: surface elevation (m) from ETOPO2v2 dataset.
Download figure:
Standard image4. Conclusions
We show evidence from four independent data sources that the NOAA CDR SCE dataset is mapping relatively more SCE over Eurasia in October over the period from 1982 to 2005. We are unable to provide precise reasons for this trend, but it is consistent with the improved mapping of snow cover over time in the NOAA product documented in Helfrich et al (2007). A multi-dataset average from four independent data sources suggests that Eurasian October SCE has decreased significantly over the 1982–2011 period in agreement with trends toward later snow cover onset observed at surface stations (Radionov et al 2004, Peng et al 2013). Removing the internal trend from the NOAA October SCE series increases the correlation with the multi-dataset average, significantly increases the correlation between Eurasian October SCE and corresponding continental-averaged air temperature anomalies, and results in snow cover extent-temperature sensitivities similar in magnitude to values observed in the spring melt period. These results highlight the need to exercise caution when using the NOAA dataset in shoulder seasons (e.g. June–October) when changes in satellite information and mapping procedures have a potentially greater impact on SCE.
The conclusion that October SCE has not experienced significant increases over Eurasia in recent years does not undermine the arguments presented in Cohen et al (2012) linking Arctic moistening, Eurasian snow anomalies and extratropical winter cooling. This process depends on snow cover anomalies (not trends) and the physical processes involved in generating a strong surface cooling anomaly (albedo and surface temperature) depend on the areal extent and the depth of snow cover (Cohen and Entekhabi 2001). We did not look at variability and trends in snow albedo or depth, but there is evidence of increasing precipitation and winter snow accumulation over large regions of Russia (Bulygina et al 2009, Borzenkova and Shmakin 2012, Callaghan et al 2011, Park et al 2012) consistent with increased moisture availability in the Arctic region (Serreze et al 2012). It is plausible that cold temperature anomalies early in the snow season in a moister Arctic atmosphere have the potential to create snow cover anomalies with deeper snow accumulations (and associated higher albedo and lower surface temperatures). The GSOD data used in this analysis show decreasing trends in October snow depths over Eurasia over the 1982–2011 period but this is potentially misleading as the monthly averaging may be masking (or missing) snow depth changes in the specific windows where a Eurasian cold anomaly is operating.
Acknowledgments
The authors gratefully acknowledge Dr David Robinson for his work maintaining the NOAA CDR snow cover dataset. The National Climate Data Center is acknowledged for providing the Global Summary of the Day dataset, and the Climatic Research Unit—University of East Anglia for the CRUtem3v gridded air temperature data. The European Centre for Medium-Range Weather Forecasts (ECMWF) is acknowledged for providing the ERA-interim data used in this study through the ECMWF data server (http://data.ecmwf.int/data/). The MERRA data used in this study have been provided by the Global Modeling and Assimilation Office (GMAO) at NASA Goddard Space Flight Center through the NASA GES DISC online archive. Colleagues Drs Libo Wang and David Huard are acknowledged for providing helpful advice and comments on the draft manuscript. Comments from three anonymous external reviewers are gratefully acknowledged.
© Canadian Crown copyright 2013. Published under exclusive licence by IOP Publishing Ltd.