
Abstract
The potential for altered ecosystems and extreme weather events in the context of climate change has raised questions concerning the role that migration plays in either increasing or reducing risks to society. Using modeled data on net migration over three decades from 1970 to 2000, we identify sensitive ecosystems and regions at high risk of climate hazards that have seen high levels of net in-migration and out-migration over the time period. This paper provides a literature review on migration related to ecosystems, briefly describes the methodology used to develop the estimates of net migration, then uses those data to describe the patterns of net migration for various ecosystems and high risk regions. The study finds that negative net migration generally occurs over large areas, reflecting its largely rural character, whereas areas of positive net migration are typically smaller, reflecting its largely urban character. The countries with largest population such as China and India tend to drive global results for all the ecosystems found in those countries. Results suggest that from 1970 to 2000, migrants in developing countries have tended to move out of marginal dryland and mountain ecosystems and out of drought-prone areas, and have moved towards coastal ecosystems and areas that are prone to floods and cyclones. For North America results are reversed for dryland and mountain ecosystems, which saw large net influxes of population in the period of record. Uncertainties and potential sources of error in these estimates are addressed.
Export citation and abstract BibTeX RIS

Content from this work may be used under the terms of the Creative Commons Attribution-NonCommercial-ShareAlike 3.0 licence. Any further distribution of this work must maintain attribution to the author(s) and the title of the work, journal citation and DOI.
1. Introduction
Recent research and policy attention has focused on the potential for climate change and other environmental change processes to become significant drivers of migration (Foresight 2011, Black et al 2011a, 2011b, de Sherbinin et al 2011a, Adamo and de Sherbinin 2011, Warner et al 2009). Black et al (2011a), drawing on extensive research compiled for the UK Government's Foresight Project on Global Environmental Change and Migration (hereafter referred to as the Foresight Project), find that while migration decision-making in the past was mostly driven by economic or other concerns, there is good reason to believe that environmental factors will increasingly influence migration. Furthermore, the authors argue that 'people are as likely to migrate into places of environmental vulnerability as away from them—a point that has been insufficiently acknowledged' (p 448). The IPCC Special Report on Climate Extremes (SREX) concluded that 'increasing exposure of people and economic assets has been the major cause of long-term increases in economic losses' (Field et al 2012, p 9), which means that exposure is linked more to increases in population and economic activity in exposed areas than to changes in the geographic distribution of extreme events.
There has been little quantitative research on past patterns of net migration with respect to environmental conditions. Findlay (2011) examined likely future migration destination areas under a changing climate based on migration theory, but did not review past migration destination areas. Although there has been research on migration to and from sensitive ecosystems, and these are reviewed in this paper, the research on migration patterns has generally been hampered by the lack of consistent and comparable time series data on net migration and other indicators.
Here we utilize the results of a modeling exercise that created a gridded net migration surface at an approximately one square kilometer resolution over four decades (CIESIN 2011), and then use these results to examine the patterns of net migration with respect to ecosystems, coastlines and natural hazards for the decades of the 1970s, 1980s and 1990s. Net migration is the balance between in- and out-migration in any given location (in this case a 1 sq. km grid cell), and the modeling work did not distinguish between internal or international migration. The paper is divided into the following sections: literature review, data and methods, results and conclusions. We hypothesize, consistent with the available literature, that out-migration was highest in marginal environments such as mountain areas and drylands, and that in-migration was highest in more urbanized ecosystems such as coastal zones and inland waters. We also hypothesize that globally there was a net in-migration into hazardous areas. With the available data we are unable to test the hypothesis that climate change, climate variability or other environmental changes, such as land degradation, have contributed to the patterns of migration found in this study. But our interest in the topic is driven by a number of factors, including the potential for future climate change to affect population distribution and movements (de Sherbinin et al 2011a, Adamo and de Sherbinin 2011), the likelihood that some of the most dramatic changes (e.g., sea level rise and more intense cyclones) will occur in areas experiencing high levels of in-migration (Field et al 2012), and the need to consider assisted relocation (de Sherbinin et al 2011b, de Sherbinin and Oliver-Smith 2012) in areas where poor populations are 'trapped' (Black et al 2011a) by rapidly changing environmental conditions.
2. Literature review
Although land cover change and habitat fragmentation have had the greatest impacts on ecosystem services globally, and have even contributed to the increased risk of floods and other natural disasters (UNEP and SRC 2008, Reid et al 2005), climate change impacts are likely to play an increasingly important role in altering ecosystems (Schellnhuber et al 2006). With a probable warming in the neighborhood of 2–4 °C this century, changing temperature and precipitation patterns and sea level rise will significantly alter ecosystems (New et al 2011), perhaps even causing the disappearance of some climate types and the emergence of altogether new ones (Williams et al 2007). This will have major effects on human populations as ecosystem services—especially the provisioning and regulating services—are key providers of life's basic needs (Reid et al 2005). Any change in their characteristics has the potential of affecting livelihoods, income, and migration trends (Corvalan et al 2005:2, Warner et al 2009, Adamo and de Sherbinin 2011), and may also lead to civil or interstate conflict, which itself is a precursor to population displacements (WBGU 2007, Campbell et al 2007).
In 1990, the IPCC's First Assessment Report already suggested that the greatest effect of climate change on society could be human migration, meaning involuntary forms of displacement and relocation (OSCE 2005). In 2007, the IPCC's Fourth Assessment Report highlighted the significance of already established migrant networks and patterns as part of the inventory of adaptation practices, options and capacities available to face climate change impacts (Adger et al 2007:736).
Climate change and ecosystem impacts will create different kinds of migration responses. Studies have shown that environmental displacements take place mostly within national boundaries (e.g. Adamo and de Sherbinin 2011, EACH-FOR 2009). Nevertheless, climate change will likely cause an increase in international migration not only for those countries most often cited (e.g., small island states) but also for those that will experience increasing frequency in climate hazards such as drought and floods (Hugo 1996, Brown 2007, ADB 2011). There is a growing realization that, in some cases, resettlement may be required for those too vulnerable to migrate on their own (de Sherbinin et al 2011b).
The existing literature on the environmental aspects of migration focuses primarily on migration associated with processes such as land use/land cover change, land degradation, or loss of ecosystem function, which in turn are driven by processes of agricultural expansion, economic development, and globalization. Suitability for cultivation or development are the primary factors associated with high in-migration, whereas lack of suitability or isolation from markets tends to fuel out-migration (e.g., Keys and McConnell 2005). There are fewer studies that systematically examine migration and displacement in relation to exposure to natural hazards. In the remainder of this section we briefly summarize the literature on migration to and from marginal/sensitive ecosystems and hazardous regions. We pick these categories because they represent areas where populations are known to be vulnerable, either because of intrinsic factors (in the case of marginal/sensitive ecosystems; Levy et al 2005, Kasperson et al 2005), or extrinsic factors such as the regular occurrence of hazard events (UNISDR 2009, Füssel 2009).
2.1. Drylands
Drylands (arid, semiarid, and dry sub-humid areas) cover about 40% of the Earth's land surface and house more than 2 billion people, 90% of them in developing countries (IIED 2008). Overall, population growth through natural increase tends to be higher and human well-being lower among drylands populations (Levy et al 2005, IIED 2008, Safriel and Adeel 2005). Rainfall variability and drought are significant contributors to low levels of economic development, poverty, and food insecurity in drylands (Brown 2012, de Sherbinin 2009). Drylands tend to be less urbanized than coastal ecosystems, with approximately 45% of the population living in urban areas, though their urban populations are increasing (Balk et al 2009).
Population mobility in drylands is a very common household livelihood strategy, composed of different types of movements (permanent, temporary and seasonal) into, outside and within arid lands (Brown 2007, de Sherbinin et al 2008, Rain 1999). The Millennium Ecosystem Assessment concluded (with medium certainty) that droughts and land degradation (particularly losses in productivity) were key factors behind migration from drylands (Safriel and Adeel 2005).
Climate change threats to drylands include increasing water shortages (especially in semiarid and dry sub-humid areas) and frequency of droughts, and declining flows in rivers depending on glacier melt (IIED 2008, Adamo and de Sherbinin 2011). Other areas may witness an increase in rainfall, although it is expected that increases in temperature will increase evapotranspiration, which will offset the benefits (Safriel and Adeel 2005). Inter- and intra-annual changes in water availability due to climate change are expected to have an effect on migration patterns (e.g. Barbieri et al 2010, Feng et al 2010).
2.2. Mountains
Apart from amenity migration to some selected mountain zones of the developed world (Riebsame et al 1996, Shumway and Otterstrom 2001, Hidalgo et al 2009, Gonzalez et al 2009), most mountain regions have experienced out-migration owing to economic stagnation, lack of market penetration, poor infrastructure, and, in some cases, land degradation (André 1998, Xu et al 2008, Körner and Ohsawa 2005, Valdivia et al 2010). For these reasons, many mountain regions can be characterized as 'spatial poverty traps' (Scott 2006). The primary climate-related hazards experienced in mountain zones are flooding, precipitation triggered land slides and drought, and populations residing in these mountain areas are exposed to them to varying degrees. Yet it is unclear that these risks serve either as deterrents to in-migration or causes of out-migration.
2.3. Coastal areas
Many climate-related hazards such as cyclones, high wind events, flooding and storm surges are concentrated in coastal zones (de Sherbinin et al 2007). At 65% urban, populations residing in coastal ecosystems are more urbanized than for other ecosystems (McGranahan et al 2005), and 11% of world population currently lives within 10 km of the coast (CIESIN 2012, WRI 2011). Because coastal areas are well situated for trade, the urban growth in these ecosystems is particularly pronounced (Curran 2002, Balk et al 2009) and in some countries (Vietnam, Bangladesh, Egypt, Mauritania, Cambodia) a large proportion of the rural population also lives in coastal areas (McGranahan et al 2007).
A large part of this accelerated population growth in coastal areas is attributed to in-migration (Curran 2002, Agardy and Alder 2005). Population mobility in coastal areas includes permanent migration, seasonal and temporary labor migration, and tourists. This attraction or 'pull' effect of coastal areas derives from their endowment of natural resources (for example natural amenities, exploitation of mangroves, fishing), communication and transportation facilities, and diversity of work opportunities. On the other hand, rural communities in coastal areas, particularly those heavily dependent on natural resources, have also witnessed out-migration due to changes in the original conditions such as depletion of fisheries (e.g. Hamilton and Butler 2001).
Low elevation coastal zones are particularly vulnerable to storms, storm surges and sea level rise (McGranahan et al 2007), and population growth in coastal areas places more people potentially at risk from natural hazards, which could mean that post-disaster displacement and migration out of the near coastal areas will likely increase in the future (Balk et al 2009, Wheeler 2011). This already occurred in the wake of hurricane Katrina (e.g., Cutter 2011, Hori et al 2009). Yet, in the absence of calamity, the draw of coastal locations is likely to continue.
3. Data and methods
In order to measure the net migration occurring in marginal ecosystems and hazardous areas, we use data derived from a modeling exercise conducted for the Foresight Project (CIESIN 2011). Here we summarize the data and methods found in CIESIN (2011); table 1 provides a brief outline of the steps followed, while readers desiring more details may consult the full report4.
The absence of globally accurate data on migration flows at the subnational level means that indirect estimation methods are necessary in order to estimate the number of net migrants for any given ecosystem over any given time period. Given the lack of direct measurements, our task was to develop estimates of net migration using the data that are currently available—time series population distribution grids combined with UN and other data on birth and death rates. We began with a high spatial resolution gridded population data set for the year 2000 and backcast this grid using consistent rates so as to obtain population grids for the years 1970, 1980 and 1990. We then calculated the change in population per decade per grid cell by subtracting the decadal grid at the beginning of each decade from the decadal grid at the end of each decade. The result was a decadal population change grid. We then applied decadal rates of natural increase (birth rates minus death rates) to the population grids at the beginning of each decade to create estimates of natural increase per grid cell over the decade. Finally, we subtracted the natural increase grid from the population change grid for each decade, which yields a residual which we termed 'net migration' (in reality it is net migration plus an error term). This method does not distinguish between internal and international migration.
Table 1. Summary of data and methods .
| Our basic methods can be summarized as follows, with details presented in the report prepared for the Foresight Project (CIESIN 2011). |
| (1) We utilized the HYDE (History Database of the Global Environment) population grids for the years 1970, 1980, 1990 and 2000 to create one degree grids representing the rates of change in population for each decade (Klein Goldewijk et al 2010). This makes optimal use of the HYDE data set, which is produced to provide a consistent decadal time series of population distribution over several centuries. |
| (2) We applied those rates to the Global Rural–Urban Mapping Project (GRUMP) (CIESIN et al 2011) population grids for 2000, producing 'backcast' grids to 1970, 1975, 1980, 1985, 1990 and 1995. This ensured that the global population data set with the greatest number of census inputsa was utilized to spatially allocate population in one time slice, and also enabled the analysis to be conducted at the higher resolution of the GRUMP product (30 arc-second resolution for GRUMP versus 5 arc-minute resolution for HYDE). |
| (3) We adjusted the global grids to match country totals from the UN population estimates for the given year (UN 2009). This was done proportionally by calculating the ratio of the backcast and forecast grids summed by country for each time slice to the UN estimate for each country for that time slice and then applying that ratio to the population count grids for each year. |
| (4) In order to estimate that portion of population growth that is due to natural increase (births minus deaths) for each grid cell in each decadal period, we applied subnational observed and imputed rates of natural increase (crude birth rates minus crude death rates) to the population grid at the beginning of each time to come up with decadal estimated natural increase. Similar to step 3 above, we adjusted the natural increase grids to match the UN estimates of natural increase at the country level. |
| (5) Next, for each decade, we subtracted the population in time 1 (e.g., 1970) from the population in time 2 (e.g., 1980) in order to come up with the change in population in that grid cell, and then subtracted the natural increase in that grid cell (from step 4) in order to come up with an estimate of net migration for that grid cell in that decade. This is based on the demographic balancing equation: |
| Population change = (births − deaths) + (net migration) |
| which, when net migration is unknown, can be solved as follows: |
| Net migration = population change − (births − deaths). |
aGRUMP is built on a total of 399, 747 census input units worldwide. See appendix E of CIESIN et al (2011) for a discussion of census inputs by region. For a fuller discussion of the methods used to create CIESIN's gridded population products, see Balk et al (2010).
We sought to reduce the error term in the results as much as possible by applying differential rates of natural increase (RNIs) across an urban-to-rural population density gradient based on a combination of observed and imputed data on urban and rural crude birth rates (CBRs) and crude death rates (CDRs). We assumed a predictable relationship between population density and RNIs, and tested this assumption using county-level data on RNIs for two countries, China and the United States. We found that for China, there is a decrease in the rates of natural increase with increasing population density, and for the United States there is an increase. This, together with the fact that ratios of urban-to-rural rates of natural increase for a set of 5016 country-year observations vary considerably, suggested to us that using this information on subnational variability would be important for increasing the accuracy of our net migration estimates.
Since data on urban and rural crude birth rates and crude death rates (the components of rates of natural increase) are not available across all countries and for all time periods, a major subcomponent of the modeling effort involved imputing data on rates of natural increase (RNIs) for urban and rural areas. We first compiled data on crude birth and death rates from the UN Demographic Yearbooks from 1972–2008.5 To impute missing values (more than 32 000 country-year urban and rural CBRs and CDRs), we combined 5016 observed values with as many auxiliary variables as we could obtain that might help explain patterns of urban and rural birth and death rates (CIESIN 2011, table C1). We used two statistical packages in the original analysis, Multiple Imputation (mi) and Amelia, but, for consistency, and because the mi imputations used a greater number of auxiliary variables, in this paper we only use outputs from the mi package. The mi package produced eight sets of imputations.
Once we had completed the imputations, we began a series of processing steps to develop spatial estimates of net migration (NM) on a 30 arc-second grid. We estimated net migration for each decade for each grid cell based on the eight imputation runs. We further processed these runs in order to remove rounding errors by ecosystem, so that the global NM totals for each decade summed to less than ±1 persons. With eight runs, we were able to develop an average and a standard deviation of the model runs for net migration (NM) for each grid cell, which represents a 'pseudo' error bar for our estimates—though we must caution that the actual error term could be larger or smaller owing to factors such as the assumed relationship between RNIs and population density, the number of observed urban/rural CBRs/CDRS, and the accuracy of other input data (see CIESIN 2011, appendix E). We were able to evaluate results using county-level data for China and the US, and the results showed a reasonably good correlation between the modeled NM and the NM derived from these alternate sources when results were summed to the ecosystem level. Because of the methodology we followed for this work, the sum of net migration of all grid cells in any given country equals the total net migration per country according to the World Population Prospects 2008. We have validated that the sum of net migration on a country level is consistent with the UN estimates; so the only difference in spatial distribution in net migration at the subnational level is due to the differences in slopes and intercepts generated by the urban and rural RNIs from the imputation runs.
Using zonal statistics in ArcGIS 10, we summed NM by ecosystem and by hazard zone. The ecosystem categories used in this analysis were drawn from the Millennium Ecosystem Assessment (MA), which developed a global map of ecosystems based on categories such as drylands, mountains, cultivated areas and coastal, each with different numbers of subcategories (Hassan et al 2005, De Fries and Pagiola 2005). The categories were not mutually exclusive, so net migration to a coastal dryland would count in both drylands and coastal categories. Drylands are broken down into a number of subcategories, all of which were used with the exception of the hyperarid category, which is sparsely populated.
For the climate hazard analysis we used drought and cyclone data from the World Bank Natural Disaster Hotspots Report (Dilley et al 2005, CHRR et al 2005a, 2005b), and flood data from the UNEP Global Assessment Report (UN 2009). We also summed NM in the low elevation coastal zone (LECZ) of 0–10 m above sea level based on NASA Shuttle Radar Topography Mission (SRTM) data (McGranahan et al 2007), and assessed NM in multi-hazard 'hotspots'. The latter was generated by creating a mask for droughts and cyclones representing the top three risk deciles, and for floods representing the top two risk quintiles. These were then combined into a global multi-hazard grid indicating the presence of one, two or all three climate hazards (figure 1). We retained country identifiers so that analyses can be performed for any country–ecosystem combination (e.g. drylands of Brazil). For each hazard analysis we also classified countries by income classes according to the World Bank's definitions of low, low-medium, high-medium, and high income6, so that we are able to assess NM in risk-prone areas by income class.
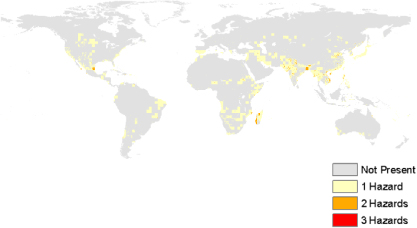
Figure 1. Multi-hazard grid.
Download figure:
Standard imageBefore proceeding to the results, it is worth noting that there are a number of uncertainties in our approach to modeling net migration, the biggest of which relate to the imputation results, the assumed relationship between population density and natural increase, and the census inputs. A full consideration of the limitations in data and methods for the NM modeling is found in CIESIN (2011). Beyond this, it is worth noting that our method will not easily capture population movements as a result of sudden onset hazards, in which those affected are typically displaced for a few months or at most a year before moving back, since such moves are likely to occur during the intercensal period and therefore would not be registered by the censuses. There are also uncertainties in the spatial accuracy of the ecosystem and natural hazard data sets used in the zonal analysis. Finally we assumed that the spatial extents of ecosystems and hazards (the hazards represent a cumulative risk over roughly two decades from 1980) were unvarying over time, and we used income classifications for 2011 and not for the earlier decades.
4. Results
We report results for the 1970s, 1980s and 1990s, leaving aside results for the 2000s owing to the lack of census-based observed population distributions for the year 2010, which makes the NM estimates far more uncertain. For ecosystems we report results with 95% confidence intervals based on the standard deviation of the results across the eight NM scenarios.
Results for all ecosystems are found in figure 2. As expected, patterns of net migration by decade show regional variations following the classical developed/developing divide. Europe, Oceania and North America show a positive balance over the time period (1970–2010), while Africa, Asia and Latin America and the Caribbean have a negative balance. There are internal variations within regions: Southern Africa and Western Asia, not shown in the diagram, have positive balances.
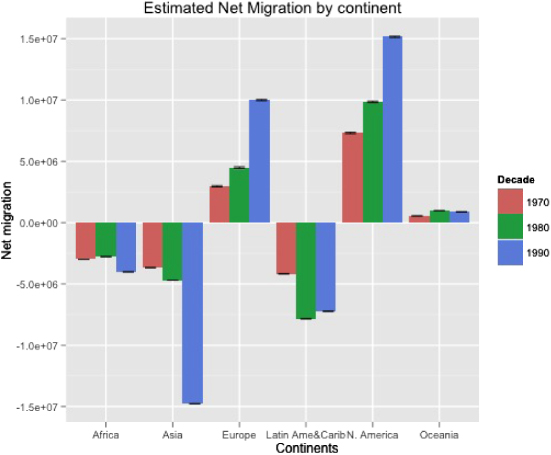
Figure 2. Estimated net migration for all ecosystems.
Download figure:
Standard image4.1. Drylands
Perhaps the most marginal ecosystem is drylands. The map in figure 3 demonstrates how the dryland mask was applied to the NM grid for 1990 to generate net migration results by ecosystem. As can be seen, net in-migration tends to be concentrated around cities, such as Delhi or Beijing, whereas net out-migration is generally a rural phenomenon spread out over much larger areas.

Figure 3. Map of estimated net migration in dryland ecosystems for the 1990s.
Download figure:
Standard imageFigure 4(a) shows that apart from North America, Europe in the 1990s, and Asia in the 1980s, there is a consistent negative NM in most dryland regions, with approximately −5 m to −15 m net migrants across most developing countries in most decades. This is consistent with empirical evidence showing that people have tended to leave the low productivity and climatically variable dryland areas for more climatically suitable regions (Stafford Smith et al 2011). The North American migration, by contrast, bucks this trend, reflecting the widely reported movement from the northeastern United States to the Sunbelt of the Southwest. Figure 4(b) shows that per unit population, dryland out-migration is highest in Latin America and the Caribbean (LAC) followed by Africa, and that North America's NM into drylands is high relative to the pre-existing population, reaching 2.5 migrants per 100 population in the 1990s. Figures 4(a) and (c) shows that per unit area, Asia's and LAC's total out-migration and per unit area were very high in the 1990s.
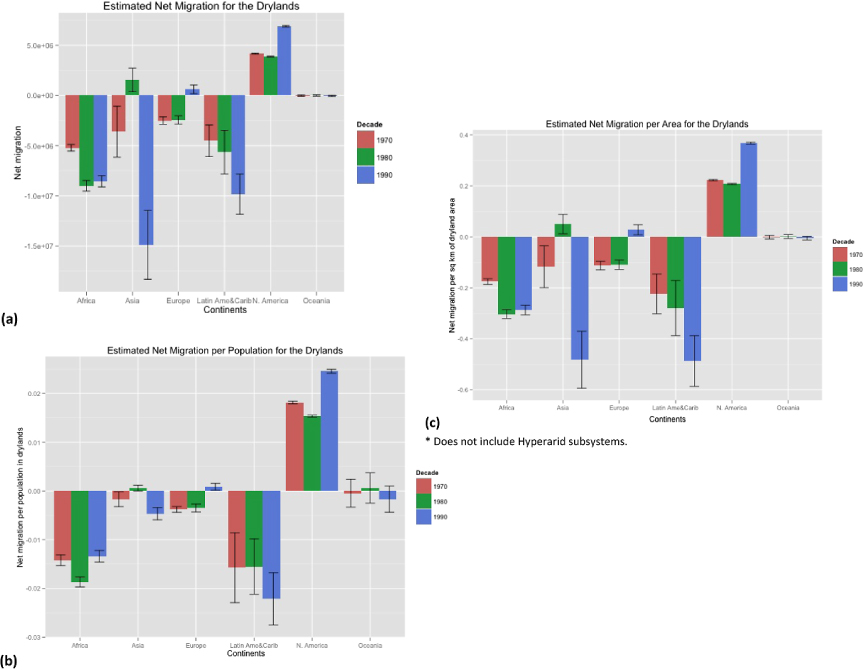
Figure 4. Estimated net migration for drylands7 (whiskers represent the 95% confidence interval across the eight NM model runs).
Download figure:
Standard imageThe broader picture is one of people in developing countries leaving areas of high rainfall variability (e.g. Barbieri et al 2010), and particularly regions that are at higher risk of climate change impacts, contrasted with a movement towards more climatically vulnerable areas in the United States, where conditions are expected to get drier (Christensen et al 2007).
4.2. Mountains
Mountain ecosystems are often marginal environments from an agricultural and economic perspective, and can also be characterized by climate variability and climate risks, such as flooding and landslides triggered by high precipitation. The picture here (figures 5(a)–(c)) is similar to that of drylands: all regions except North America have experienced high levels of out-migration, with it being particularly pronounced in Asia (with highest levels in East Asia, followed by Southeast Asia and South Asia), reaching more than −30 m people in the 1990s. Broadly speaking, the results support the notion that migrants in most of the world are leaving areas that are often characterized by poor market access and economic stagnation—so-called 'poverty traps' (Scott 2006). North America's in-migration is a completely different dynamic that is largely attributable to amenity migration of mostly high income populations to the Rocky Mountain states of the US.

Figure 5. Estimated net migration for mountain ecosystems (whiskers represent the 95% confidence interval across the eight NM model runs).
Download figure:
Standard image4.3. Coastal ecosystems
Coastal ecosystems are not generally marginal, in the sense of being unproductive or isolated from trade, but they are exposed to a number of climate impacts, including cyclones, high winds, storm surge and sea level rise. Almost all coastal ecosystems saw net in-migration (figure 6(a)). Asia eclipsed all other regions with >18 m net migrants in all decades, and >60 m net migrants in the 1990s. This corresponds to the period of economic liberalization in China, which saw massive migration to the coasts, where the country's most vibrant industrial cities are located. Per unit area (figure 6(c)), NM is still notably high in Asia, but per unit population Oceania has the highest per capita NM (figure 6(b)).
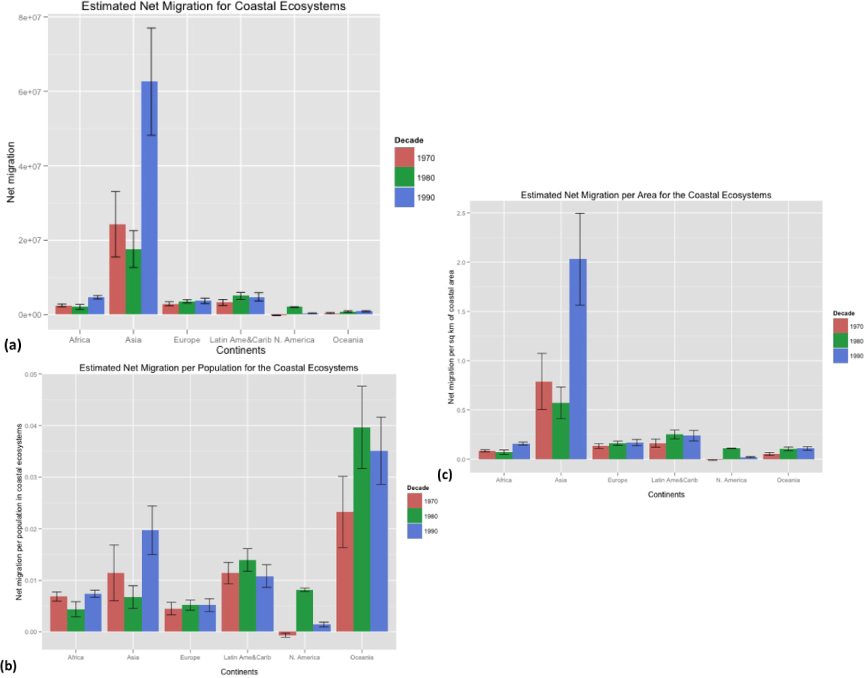
Figure 6. Estimated net migration for coastal ecosystems (whiskers represent the 95% confidence interval across the eight NM model runs).
Download figure:
Standard imageTo zoom in even closer to vulnerabilities in the near coastal zone, we calculated net migration in the LECZ defined as 0–10m above sea level (figures 7(a)–(c)). Here the patterns are similar to the coastal migration, only the magnitudes are slightly lower. Asia still stands out as the region with the highest net migration into this highly vulnerable environment, especially in the 1990s. Its NM per unit population and per area is also relatively high (figures 7(b) and (c)). North America has also had relatively high per capita NM (figure 7(b)), meaning that people are moving into relatively thinly settled areas.
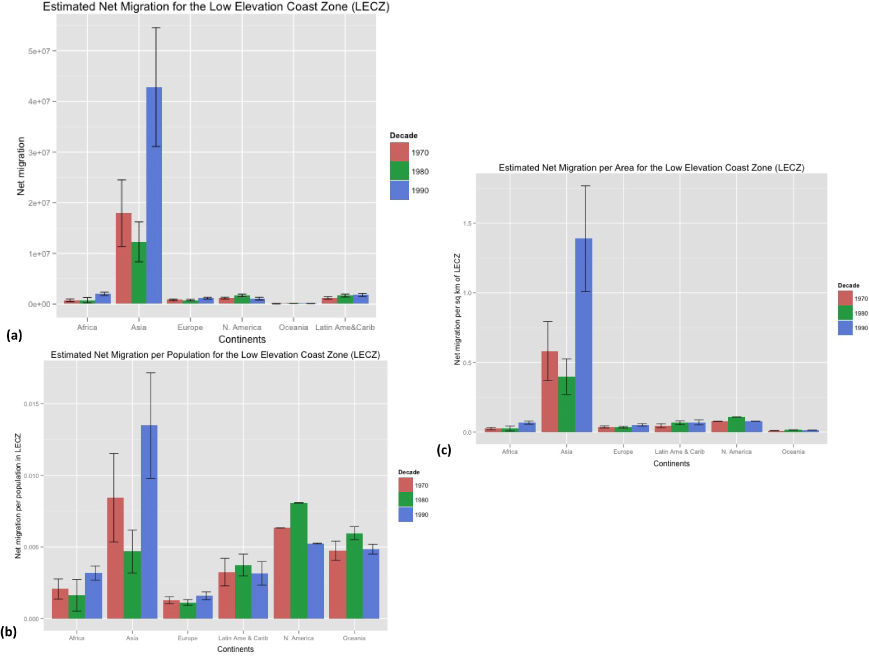
Figure 7. Estimated net migration for the low elevation coast zone (LECZ) (whiskers represent the 95% confidence interval across the eight NM model runs).
Download figure:
Standard image4.4. Hazardous areas
We now turn to our analysis of NM in areas characterized by hazard risk. For our multi-hazard analysis—using the highest risk categories for droughts, cyclones and floods (figure 1)—most of the area is found to have one risk present, with smaller areas with two risks, and very limited areas with all three risks present. Our focus is on areas with two or three risks present, since the single risk areas are dealt with on a per-hazard basis below. We tabulated population at the beginning of each decade in the same zones in order to determine where NM may be occurring at high rates relative to the baseline population.
Our hypothesis is that high levels of net in-migration in multi-hazard hotspots that are also in low income areas could lead to a compounding of vulnerability. We combined the low and low-mid income categories (labeling them 'low'), along with the high-mid and high income categories (labeling them 'high'), and summarized the results for the two and three risk multi-hazard hotspots by region (figure 8). The results at the global level suggest that net migration is positive in these hotspots, with results being driven heavily by net migration into high risk zones in Asia. The global results, as well as the results for Asia and Latin America, suggested that positive net migration is highest in the higher income regions for each decade. In North America these multi-hazard hotspots appear to be migration source rather than destination areas.
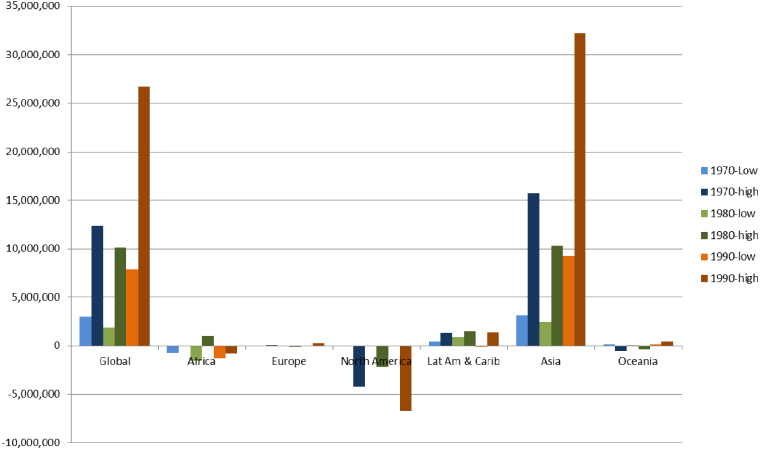
Figure 8. Estimated net migration in high risk multi-hazard areas by income.
Download figure:
Standard imageRecognizing that NM levels could be low relative to pre-existing populations in these high risk zones, we calculated the net migration as a percentage of the population at the beginning of the decade, retaining the sign of the migration (figure 9). The result is that Asia's NM into high risk zones no longer appears to be so significant, at between 2 and 6% of the population per decade. On the other hand, Africa's mid to high income regions (North and South Africa) had NM representing 12% of the population in the 1980s, and North America had an equally high proportional out-migration from high risk zones during the 1990s. Africa, North America and Oceania appear to be regions with significant net out-migration from these high risk areas. Europe has relatively little exposure to high risk areas, and Latin America and the Caribbean and Asia show high positive NM into risk-prone areas as percentage of the population across income groups.
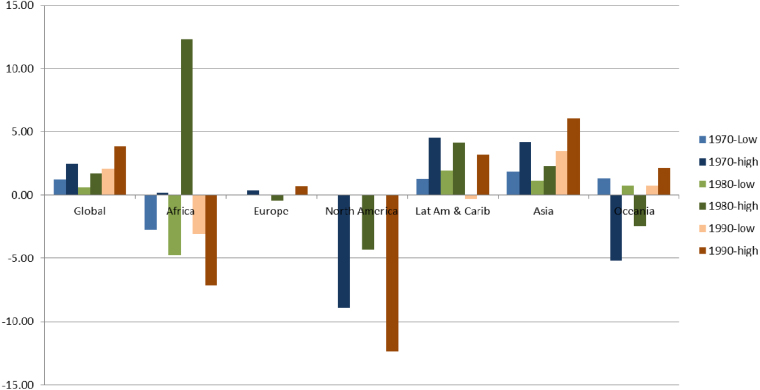
Figure 9. Estimated net migration as a % of population in high risk multi-hazard areas by income.
Download figure:
Standard imageFor droughts, cyclones and floods we looked at NM in the high risk zones (the aforementioned top deciles/quintiles). Here we will focus on average decadal NM (1970s–1990s) into these high risk zones in the low income countries by sub-region—both total numbers and as a per cent of the 1970 population. For drought, the trend is one of out-migration (table 2). We find that the global average decadal NM in the highest risk areas is approximately −5.1 m people, with the largest out-migration being in South-Central Asia (−2.3 m), followed by approximately −1.1 m each in Western and Eastern Africa. The highest NM as a percentage of the 1970 population is in the Caribbean (−5%), followed by Western Africa (−3.6%). For cyclones, the numbers are substantially smaller, but they are also largely positive, meaning people in low income countries are moving towards cyclone-prone areas (table 3), possibly driven by urbanization, amenities or tourism jobs. Globally there was a decadal average of approximately 150 000 migrants moving into such zones, with the highest numbers in Eastern Africa and the Caribbean (representing a decadal average of 29% of the 1970 population in these zones). Asia's low income countries experienced modest out-migration in cyclone affected areas over the three decades.
Table 2. Average decadal net migration (1970–90) in high drought risk zones of low income countries: total and as a per cent of 1970 population.
| 1970–90 | ||
|---|---|---|
| Average | %1970 pop | |
| Global | −5 074 526 | −1.64 |
| Middle Africa | −145 543 | −0.56 |
| Western Africa | −1 078 682 | −3.61 |
| Eastern Africa | −1 069 192 | −1.05 |
| Caribbean | −237 210 | −5.03 |
| South-Central Asia | −2 375 190 | −2.40 |
| Eastern Asia | −8 | 0.00 |
| South-Eastern Asia | −168 702 | −0.51 |
Table 3. Average decadal net migration (1970–90) in high cyclone risk zones of low income countries: total and as a per cent of 1970 population.
| 1970–90 | ||
|---|---|---|
| Average | %1970 pop | |
| Global | 147 458 | 1.20 |
| Eastern Africa | 84 042 | 1.06 |
| Caribbean | 96 623 | 29.54 |
| South-Central Asia | −21 124 | −14.08 |
| Eastern Asia | −8618 | −0.22 |
| South-Eastern Asia | −3466 | −6.77 |
Table 4. Average decadal net migration (1970–90) in high flood risk zones of low income countries: total and as a per cent of 1970 population.
| 1970–90 | ||
|---|---|---|
| Average | % 1970 pop | |
| Global | 6 785 705 | 6.46 |
| Middle Africa | 2 444 021 | 121.49 |
| Western Africa | 543 831 | 15.02 |
| Eastern Africa | 1 339 659 | 15.94 |
| Caribbean | 90 682 | 8.53 |
| South-Central Asia | 645 326 | 0.92 |
| Eastern Asia | 271 004 | 5.79 |
| South-Eastern Asia | 1 451 182 | 9.69 |
Areas at high risk of flooding were, in comparison with drought and cyclone affected areas, characterized by the largest net in-migration (table 4). Globally, an average of 7 m people per decade are migrating into flood-prone areas, with the greatest number (2.4 m) in Middle Africa, followed by Eastern Africa (1.3 m) and South-Eastern Asia (1.4 m). As a per cent of the population, Middle Africa has experienced the greatest NM, with NM over the three decades representing some 121% of the 1970 population. In general the percentages in Africa are high, suggesting that people have moved into areas of high flood risk that were previously thinly populated.
Overall, it appears that in many low income countries, people have moved in large numbers out of drought-prone areas, and that the same or different migrants are moving into high flood risk areas.
5. Conclusions
The results presented above suggest a varied picture of NM in relation to sensitive ecosystems and high hazard risk regions in the developing world. On the one hand, low income regions have seen a large net migration out of marginal environments such as drylands and mountains, as well as out of drought-prone areas, confirming our hypothesis that people are leaving marginal environments. From a development and adaptation perspective, these can be seen as positive developments, since economic development opportunities and potential adaptive responses are fewer in these areas, and vulnerability to drought and other hazards is high. On the other hand, there has been a large net influx of migrants to coastal ecosystems and the LECZ, and in what is probably a related phenomenon, net migration has been moderately high in cyclone affected areas and very high in flood-prone areas, confirming our hypothesis of positive net migration in coastal areas and hazardous areas. The huge scale of coastal net migration in the face of the growing risk of climate hazards such as more intense cyclones and sea level rise is an issue that has been addressed elsewhere (de Sherbinin et al 2007, McGranahan et al 2007) and which remains a signal challenge for climate adaptation. The only silver lining is that in all the developing countries, it is the higher income countries that are seeing the highest net migration into multi-hazard hotspots. This is good news, in the respect that low income areas have been found to be less resilient to climate shocks (UNDP 2008).
Although these results cannot be categorized as definitive, they can be said to broadly confirm evidence that out-migration is a response to lack of economic activity and marginal environmental conditions (Foresight 2011, Adamo and de Sherbinin 2011, EACH-FOR 2009), and that people move to areas that are better connected economically, but which may be impacted by other kinds of hazard risks (Findlay 2011). This presents some interesting policy challenges. Efforts to stimulate or limit migration have generally met with failure (de Haas 2006, Castles 2004). Thus, people will tend to continue to move to areas with greater economic opportunities regardless of the risks inherent in those areas. In our results we see North Americans moving to drought-prone drylands and mountain ecosystems, whereas in developing countries people are moving to high flood and cyclone risk areas. In both contexts, migrants may bring with them expectations that are not consistent with life in their new environments. In the US Southwest, many migrants from temperate humid climates desire green lawns that use scarce water resources in an inappropriate way. In Brazil, migrants from the drought-prone northeast have moved to regions like Rio De Janeiro, and built houses on mudslide-prone hillsides owing to the cost of land in less risk-prone areas (de Sherbinin et al 2007).
Refinements to this analysis such as those detailed in CIESIN (2011) could certainly improve the accuracy of results, though the general direction and magnitude of our NM modeling results would seem to be largely consistent with available empirical evidence. We simply add our voices to the general call for improved migration data (Black and Skeldon 2009), recognizing that migration is likely to be one of the most significant societal responses to a changing planet (Foresight 2011).
Acknowledgment
The net migration modeling work was funded under the UK Government's Foresight Project on Global Environmental Change and Migration.
Footnotes
- 4
There are two major differences in the data and results we use here: first, we only included 8 of 13 net migration scenarios, and we do not include the decadal net migration values for 2000–10 owing to the lack of observed, census-based population grids for 2010.
- 5
The United States represented a special case of a demographically significant country with no observed urban/rural rates, so we used different methods to derive estimated decadal rates of natural increase across urban and rural areas using county-level data from the US Census Bureau.
- 6
The cut offs for these groupings, according to 2011 GNI per capita, are as follows: low income, $1025 or less; lower middle income, $1026–$4035; upper middle income, $4036–$12 475; and high income, $12 476 or more (World Bank 2012).
- 7
Does not include hyperarid ecosystems.