

Abstract
We present an updated analysis of monthly means of daily mean, minimum and maximum surface air temperature (SAT) data from Greenland coastal weather stations and from a long-running site on the Greenland ice sheet, and analyse these data for evidence of climate change, especially focusing on the last 20 years but using the whole periods of available records (some since 1873). We demonstrate very strong recent warming along the west coast of Greenland, especially during winter (locally >10 °C since 1991), and rather weaker warming on the east Greenland coast, which is influenced by different oceanographic/sea-ice and meteorological synoptic forcing conditions to the rest of Greenland. Coastal Greenland seasonal mean SAT trends were generally 2–6 °C, strongest in winter (5.7 °C) and least in summer and autumn (both 2.2 °C), during 1981–2011/12. Since 2001 Greenland mean coastal SAT increased significantly by 2.9 °C in winter and 0.8 °C in summer but decreased insignificantly by 1.1 °C in autumn and 0.2 °C in spring, during a period when there was little net change (≤ ± 0.1 °C) in northern hemisphere temperatures. SAT means for the latest 2001–11/12 decade were significantly in excess of those for peak decadal periods during the Early Twentieth Century Warm Period only in summer and winter, and not significantly greater in spring and autumn. Summer SAT increases in southern Greenland for the last 20 years were generally greater for maximum than minimum temperatures. By contrast, in winter, the recent warming was greater for minimum than maximum temperatures. The greatest SAT changes in all seasons are seen on Greenland's west coast. SAT changes on the ice sheet and a key marginal glacier closely followed nearby coastal temperatures over the last 20 years.
Export citation and abstract BibTeX RIS
1. Introduction
Much attention has recently focused on the ongoing denudation and likely future demise of the Greenland Ice Sheet (GrIS) under conditions of sustained anthropogenic global warming (e.g. Gregory et al 2004, Gregory and Huybrechts 2006, Velicogna 2009, Rignot et al 2011). Uncertainties surrounding this question depend to a large extent on changes in regional Greenland climate, which vary significantly from Northern Hemisphere mean temperature change (e.g. Hanna and Cappelen 2003, Hanna et al 2008, 2012). Here in part 1 of this paper we analyse mean, minimum and maximum surface air temperature records from long-term near-coastal and inland Greenland weather stations, for various climatological normal and recent periods, for evidence of climate change and variability affecting surface air temperature (SAT) at these sites. In part 2 (to be published elsewhere), we will present an updated, and more detailed than previously published, analysis of the relationship between Greenland temperature changes and variations in atmospheric circulation patterns—specifically the North Atlantic Oscillation (NAO) and Greenland Blocking Index (GBI)—which have already been established to affect Greenland climate (Hanna and Cappelen 2003, Hanna et al 2008, 2012).
This kind of analysis is relevant not only to climatologists but also to glaciologists and many other environmental scientists—and many members of the wider public interested in Greenland climatology, its causes and impacts on ice-sheet and glacier mass balance (e.g. Hanna et al 2005, 2011, Box et al 2006, Fettweis et al 2008, van den Broeke et al 2009, Mernild and Liston 2012). Although annual reports of Greenland climate and ice-sheet mass balance are published online each autumn by the US National Oceanographic and Atmospheric Administration (NOAA) in its Arctic Report Card series (e.g. Hanna et al 2007, Box et al 2011), the climatological analysis therein is mainly restricted to anomalies of the preceding year. The last comprehensive formal review of Greenland surface air temperature (and wider climatological) data based on meteorological station data for the whole country was published by Box (2002). Given rapid changes in Greenland climatology (Hanna et al 2008, 2009) and ice-sheet mass balance (Rignot et al 2008, 2011) over the past decade, we consider it highly timely for an updated analysis and review.
2. Climate datasets and analysis
Here our primary dataset is monthly mean daily and mean daily maximum and daily minimum surface air temperature (SAT) data from Greenland coastal (or near-coastal) synoptic weather stations operated by the Danish Meteorological Institute (DMI) (Cappelen 2011). Details of location and time period of the DMI stations used here are given in figure 1 and table 1. Updated data to include winter 2011–12 (i.e. until February 2012) were used in the analysis. All these temperature data have been homogenized using the standard normal homogeneity test, including comparisons with neighbouring stations' records where available (Cappelen et al 2001, Cappelen 2011). Notably five sites, 04211 Upernavik, 04221 Ilulissat, 04250 Nuuk, 04270 Narsarsuaq and 04360 Tasiilaq, have SAT records extending back before 1900—giving a reasonable distribution around the ice-sheet margin—whereas many other sites commence records in about 1960 (table 1). We take means of data from nine stations asterisked in table 1 to construct a Composite Greenland Temperature 2 (CGT2) seasonal SAT time series from 1961, following Hanna et al (2012), but here updated to 2011/12. In addition we construct a Composite Greenland Temperature 3 (CGT3) seasonal series based on means of SAT data from the following stations: 04211 Upernavik, 04221 Ilulissat, 04250 Nuuk, 34262 Ivituut/04270 Narsarsuaq (sometimes regarded by DMI as a single merged temperature series), and 04360 Tasiilaq. CGT3 has the advantage of summarizing coastal temperature changes since 1895.

Figure 1. Location map of Greenland climate stations used in this study.
Download figure:
Standard imageTable 1. Details of Greenland meteorological stations used in this study (sources: Cappelen 2011, Cappelen et al 2001, Steffen and Box 2001, Mernild et al 2008). All DMI stations are within ∼100 m of sea-level. Neighbouring DMI stations 34262 Ivittuut and 04270 Narsarsuaq are combined to provide a long south Greenland temperature time series.
| Station name | Data source | World Meteorological Organization (WMO) code | Latitude (°N) | Longitude (°W) | Available data period |
|---|---|---|---|---|---|
| Upernavika | DMI | 34210/04210/04211 | 72°47' | 56°08' | Sep 1873–present |
| Aasiaata | DMI | 04220 | 68°42' | 52°45' | Jan 1958–present |
| Ilulissata | DMI | 34216/04216/04221 | 69°14' | 51°04' | Jul 1873–present |
| Sisimiuta | DMI | 04230/04234 | 66°55' | 53°40' | Jan 1961–present |
| Kangerlussuaq | DMI | 04231 | 67°1' | 50°42' | May 1973–present |
| Nuuka | DMI | 34250/04250 | 64°10' | 51°45' | Jan 1874–present |
| Paamiuta | DMI | 04260 | 62°0' | 49°40' | Jan 1958–present |
| Ivittuut | DMI | 34262 | 61°12' | 48°11' | Jan 1875–Dec 1966 |
| Narsarsuaqa | DMI | 04270 | 61°10' | 45°25' | Jan 1961–present |
| Qaqortoqa | DMI | 04272 | 60°43' | 46°03' | Jan 1961–present |
| Danmarkshavn | DMI | 04320 | 76°46' | 18°40' | Jan 1949–present |
| Ittoqqortoormiit | DMI | 34339/04339 | 70°29' | 21°57' | Jan 1924–present |
| Aputiteeq | DMI | 04351 | 67°47' | 32°18' | Jan 1958–present |
| Tasiilaqa | DMI | 34360/04360 | 65°36' | 37°38' | Oct 1894–present |
| Ikermiuarsuk | DMI | 04382 | 61°56' | 42°04' | Jan 1958–present |
| Ikerasassuaq | DMI | 04390 | 60°03' | 43°09' | Jan 1958–present |
| Swiss Camp | GC-Net | 04458 | 69°34' | 49°20' | May 1991–April 2011 |
| Mittivakkat Gletscher Nunatak | University of Copenhagen/Dept. of Geography and Geology | 65°42' | 37°48' | Jul 1993–Jul 2011 |
aStations are used in our CGT2 series, updated from Hanna et al (2012).
In addition, we use selected automatic weather station (AWS) data from the extensive inland ice-sheet region, which is not directly sampled by the DMI stations, and although the data span is much shorter (since at best the early 1990s) it does enable a meaningful direct comparison of Greenland coastal and inland climates for the last 1–2 decades. First, in this study we focus on evaluating a newly updated 21-year record from the Swiss Camp Greenland Climate Network (GC-Net) site on the western flank of the ice sheet at 1176-m elevation (Steffen and Box 2001, Hanna et al 2008); all other GC-Net sites start in 1995 or later, and most have gaps in their records, so are not used here. Second, we analyse AWS data from Sermilik and adjacent to Mittivakkat Gletscher on Ammassalik Island, south-east Greenland (Mernild et al 2008).
We use standard descriptive statistics (mean, standard deviation), linear least-squares and regression line trend analysis to evaluate evidence of climate variability and change for various climatological normal periods overlapping by 10 years and extending as far back as datasets allow, as well as evaluating shorter recent periods of particular interest 1991–2011 and 2001–11/12, when global warming is generally acknowledged to have influenced Greenland climate (Box et al 2011, Hanna et al 2008). Temperature trends are generally acknowledged to be significant when they exceed the standard deviation (1σ) of the respective dataset, and—following Box (2002)—are given for their respective time periods rather than temperature change per fixed unit time. In addition we use running mean analysis to pinpoint different periods of peak high/low temperature, e.g. to compare the Early Twentieth Century Warming in Greenland (Box 2002) with the contemporary 2000s and since warming. In all the results reported below we use standard three-month meteorological seasons: DJF (winter), MAM (spring), JJA (summer), SON (autumn).
3. Results
3.1. DMI coastal station surface air temperature series
The key (representative and longer-running, CGT2 and CGT3) seasonal mean SAT series are shown in figures 2(a)–(d); their means and standard deviations are shown in table 2, and trends in table 3. Corresponding figures and tables are also shown for seasonal mean daily maximum SAT (tables S1, S2 and figure S1 available at stacks.iop.org/ERL/7/045404/mmedia) and mean daily minimum SAT (tables S3, S4 and figure S2 in the supplementary materials available at stacks.iop.org/ERL/7/045404/mmedia).

Figure 2. Greenland mean surface air temperatures from DMI stations for (a) spring (MAM) 1873–2011, (b) summer (JJA) 1873–2011, (c) autumn (SON) 1873–2011 and (d) winter (DJF) 1873–2012.
Download figure:
Standard imageTable 2. Spring (MAM) (a), summer (JJA) (b), autumn (SON) (c) and winter (DJF, where year is year of the January) (d) daily mean surface air temperature means and standard deviations (latter in brackets) (°C) at (near-)coastal DMI Greenland climate stations for climatological normal and shorter recent periods.
| Upernavik | Aasiaat | Ilulissat | Sisimiut | Kangerlussuaq | Nuuk | Paamiut | Narsarsuaq | Qaqortoq | Danmarkshavn | Ittoqqortoormiit | Aputiteeq | Tasiilaq | Ikermiuarsuk | Ikerasassuaq | CGT2 | CGT3 | |
|---|---|---|---|---|---|---|---|---|---|---|---|---|---|---|---|---|---|
| (a) | |||||||||||||||||
| 2001–11 | −10.6 | −5.6 | −6.2 | −4.4 | −6.0 | −2.6 | −0.8 | 1.5 | 0.4 | −14.7 | −8.2 | −5.7 | −2.0 | −3.1 | 0.0 | −3.4 | −4.0 |
| (1.7) | (2.5) | (2.1) | (1.8) | (2.8) | (1.7) | (2.2) | (1.8) | (1.6) | (1.9) | (1.6) | (1.2) | (1.2) | (3.0) | (1.0) | (1.6) | (1.5) | |
| 1991–2011 | −11.6 | −7.7 | −7.6 | −5.8 | −6.7 | −3.3 | −1.6 | 0.7 | −0.1 | −14.7 | −8.1 | −5.8 | −2.5 | −2.7 | −0.4 | −4.4 | −4.9 |
| (2.0) | (3.1) | (2.7) | (2.2) | (3.0) | (1.8) | (2.2) | (2.1) | (1.7) | (1.6) | (1.6) | (1.2) | (1.1) | (2.1) | (1.0) | (1.9) | (1.8) | |
| 1981–2011 | −12.0 | −8.5 | −8.0 | −6.5 | −7.2 | −3.7 | −2.1 | 0.1 | −0.6 | −15.1 | −8.6 | −6.3 | −3.1 | −3.0 | −0.6 | −4.9 | −5.3 |
| (2.0) | (3.2) | (2.7) | (2.2) | (2.9) | (1.8) | 2.1 | (2.4) | (1.9) | (1.5) | (1.7) | (1.5) | (1.5) | (1.8) | (1.0) | (2.0) | (1.9) | |
| 1971–2000 | −12.6 | −9.6 | −8.3 | −7.3 | −7.7 | −4.0 | −2.6 | −0.4 | −0.9 | −15.3 | −9.2 | −6.4 | −3.5 | −2.9 | −1.0 | −5.5 | −5.8 |
| (1.6) | (2.2) | (2.4) | (1.6) | (2.9) | (1.5) | (1.6) | (2.2) | (1.7) | (1.3) | (1.8) | (1.5) | (1.3) | (1.0) | (0.7) | (1.6) | (1.6) | |
| 1961–90 | −12.5 | −9.2 | −7.7 | −7.1 | × | −3.7 | −2.3 | −0.0 | −0.6 | −15.7 | −10.4 | −6.8 | −3.8 | −3.2 | −0.9 | −5.2 | −5.5 |
| (1.9) | (2.2) | (2.3) | (1.6) | (1.5) | (1.4) | (2.3) | (1.8) | (1.2) | (1.7) | (1.5) | (1.3) | (0.9) | (0.7) | (1.6) | (1.5) | ||
| 1951–80 | −12.2 | × | −7.3 | × | × | −3.0 | × | 0.9 | × | −15.7 | −11.1 | × | −3.0 | × | × | × | −4.9 |
| (2.0) | (1.9) | (1.2) | (1.7) | (1.3) | (1.9) | (1.4) | (1.2) | ||||||||||
| 1941–70 | −11.7 | × | −7.4 | × | × | −2.9 | × | 1.1 | × | × | −10.8 | × | −2.7 | × | × | × | −4.7 |
| (2.0) | (1.9) | (1.4) | (1.5) | (2.2) | (1.5) | (1.3) | |||||||||||
| 1931–60 | −10.7 | × | −7.0 | × | × | −2.5 | × | 0.9 | × | × | −9.5 | × | −2.0 | × | × | × | −4.3 |
| (1.9) | (2.0) | (1.5) | (1.4) | (2.5) | (1.2) | (1.3) | |||||||||||
| 1921–50 | −10.3 | × | −6.4 | × | × | −2.4 | × | 0.7 | × | × | −8.4 | × | −2.0 | × | × | × | −4.1 |
| (1.8) | (2.2) | (1.7) | (1.6) | (2.1) | (1.5) | (1.6) | |||||||||||
| 1911–40 | −10.7 | × | −6.8 | × | × | −2.6 | × | 0.5 | × | × | × | × | −2.5 | × | × | × | −4.4 |
| (2.1) | (2.6) | (1.7) | (1.8) | (1.7) | (1.8) | ||||||||||||
| 1901–30 | −11.3 | × | −7.6 | × | × | −3.2 | × | 0.0 | × | × | × | × | −3.3 | × | × | × | −5.1 |
| (2.1) | (2.8) | (1.9) | (1.9) | (1.8) | (1.9) | ||||||||||||
| 1891–1920 | −12.2 | × | −8.9 | × | × | −4.0 | × | −0.3 | × | × | × | × | −4.0 | × | × | × | −5.8 |
| (2.2) | (2.8) | (1.6) | (1.8) | (1.2) | (1.6) | ||||||||||||
| 1881–1910 | −12.6 | × | −9.3 | × | × | × | × | −0.4 | × | × | × | × | × | × | × | × | × |
| (2.3) | (2.9) | (1.7) | |||||||||||||||
| (b) | |||||||||||||||||
| 2001–11 | 5.9 | 6.3 | 7.4 | 7.5 | 10.3 | 6.8 | 6.3 | 10.4 | 7.8 | 3.2 | 5.0 (0.5) | 2.6 | 6.8 | 4.4 | 7.0 (0.7) | 7.2 | 7.4 |
| (1.0) | (0.5) | (0.7) | (0.5) | (0.6) | (0.8) | (0.8) | (0.6) | (0.7) | (0.8) | (0.6) | (0.6) | (0.8) | (0.6) | (0.6) | |||
| 1991–2011 | 5.0 | 5.6 | 6.9 | 6.4 | 9.8 | 6.1 | 5.8 | 10.1 | 7.5 | 2.8 | 4.7 (0.7) | 2.1 | 6.2 | 4.2 | 6.4 (0.9) | 6.6 | 6.9 |
| (1.5) | (1.0) | (1.0) | (1.3) | (0.8) | (1.1) | (0.9) | (0.7) | (0.8) | (0.8) | (0.6) | (0.8) | (0.8) | (0.9) | (0.9) | |||
| 1981–2011 | 4.7 | 5.2 | 6.8 | 6.0 | 9.5 | 5.8 | 5.4 | 9.8 | 7.1 | 2.6 | 4.5 (0.7) | 2.0 | 5.9 | 4.0 | 6.3 (0.9) | 6.3 | 6.6 |
| (1.3) | (1.1) | (1.0) | (1.2) | (0.9) | (1.1) | (1.1) | (0.8) | (1.0) | (0.8) | (0.5) | (0.9) | (0.8) | (0.9) | (0.9) | |||
| 1971–2000 | 4.0 | 4.6 | 6.3 | 5.3 | 9.3 | 5.4 | 4.9 | 9.4 | 6.7 | 2.3 | 3.5 (1.2) | 1.9 | 5.5 | 4.0 | 5.8 (0.5) | 5.8 | 6.1 |
| (1.0) | (0.8) | (0.9) | (0.7) | (0.9) | (0.9) | (0.8) | (0.8) | (0.9) | (0.5) | (0.5) | (0.6) | (0.7) | (0.7) | (0.7) | |||
| 1961–90 | 4.0 | 4.6 | 6.2 | 5.3 | × | 5.5 | 4.9 | 9.3 | 6.5 | 2.3 | 2.7 (1.0) | 1.9 | 5.5 | 4.3 | 5.9 (0.6) | 5.8 | 6.1 |
| (0.9) | (0.7) | (0.9) | (0.7) | (0.8) | (0.8) | (0.7) | (0.8) | (0.5) | (0.5) | (0.6) | (0.9) | (0.7) | (0.7) | ||||
| 1951–80 | 4.1 | × | 6.1 | × | × | 5.8 | × | 9.4 | × | 2.3 | 1.7(0.7) | × | 5.9 | × | × | × | 6.3 |
| (1.0) | (1.0) | (0.8) | (0.7) | (0.5) | (0.6) | (0.7) | |||||||||||
| 1941–70 | 4.0 | × | 6.1 | × | × | 6.1 | × | 9.6 | × | × | 3.0 (2.3) | × | 6.2 | × | × | × | 6.4 |
| (1.0) | (1.0) | (0.8) | (0.6) | (0.6) | (0.6) | ||||||||||||
| 1931–60 | 4.2 | × | 6.2 | × | × | 6.4 | × | 9.7 | × | × | 4.2(2.5) | × | 6.6 | × | × | × | 6.6 |
| (1.0) | (1.0) | (0.8) | (0.7) | (0.6) | (0.6) | ||||||||||||
| 1921–50 | 4.0 | × | 6.1 | × | × | 6.4 | × | 9.6 | × | × | 5.5 (1.4) | × | 6.5 | × | × | × | 6.5 |
| (1.0) | (0.9) | (0.9) | (0.8) | (0.7) | (0.7) | ||||||||||||
| 1911–40 | 3.7 | × | 5.9 | × | × | 6.0 | × | 9.4 | × | × | × | × | 6.3 | × | × | × | 6.3 |
| (1.2) | (1.0) | (1.1) | (1.0) | (0.7) | (0.9) | ||||||||||||
| 1901–30 | 3.4 | × | 5.9 | × | × | 5.7 | × | 9.1 | × | × | × | × | 5.9 | × | × | × | 6.0 |
| (1.0) | (0.9) | (0.9) | (1.0) | (0.6) | (0.8) | ||||||||||||
| 1891–1920 | 3.2 | × | 5.8 | × | × | 5.5 | × | 9.0 | × | × | × | × | 5.8 | × | × | × | 5.9 |
| (0.8) | (0.9) | (0.8) | (0.9) | (0.6) | (0.6) | ||||||||||||
| 1881–1910 | 3.3 | × | 5.7 | × | × | × | × | 8.6 | × | × | × | × | × | × | × | × | × |
| (0.8) | (0.8) | (0.8) | |||||||||||||||
| (c) | |||||||||||||||||
| 2001–11 | −2.9 | −0.7 | −2.1 | 0.2 | −3.9 | 0.7 | 1.4 | 1.8 | 2.6 | −10.7 | −4.1 | −1.2 | 0.6 | 1.4 | 2.9 | 0.2 | −0.4 |
| (1.3) | (1.1) | (1.5) | (1.3) | (1.9) | (1.3) | (1.2) | (1.7) | (1.4) | (1.0) | (1.4) | (0.8) | (1.0) | (0.7) | (0.8) | (1.1) | (1.1) | |
| 1991–2011 | −3.3 | −1.2 | −2.4 | −0.6 | −4.1 | 0.3 | 0.8 | 1.3 | 2.2 | −11.2 | −4.3 | −1.7 | 0.3 | 1.0 | 2.3 | −0.3 | −0.8 |
| (1.5) | (1.1) | (1.3) | (1.4) | (1.7) | (1.1) | (1.2) | (1.4) | (1.2) | (1.1) | (1.3) | (0.8) | (0.9) | (0.7) | (0.9) | (1.0) | (1.0) | |
| 1981–2011 | −3.7 | −1.5 | −2.6 | −1.0 | −4.4 | 0.0 | 0.6 | 1.2 | 1.9 | −11.7 | −4.8 | −2.1 | −0.1 | 0.6 | 2.1 | −0.6 | −1.0 |
| (1.7) | (1.1) | (1.4) | (1.4) | (1.7) | (1.2) | (1.2) | (1.4) | (1.2) | (1.3) | (1.4) | (1.0) | (0.9) | (0.9) | (1.0) | (1.1) | (1.1) | |
| 1971–2000 | −4.1 | −2.0 | −3.0 | −1.6 | −4.8 | −0.4 | 0.2 | 0.9 | 1.4 | −12.4 | −5.6 | −2.7 | −0.5 | 0.0 | 1.5 | −1.0 | −1.4 |
| (1.4) | (0.8) | (1.1) | (0.8) | (1.5) | (0.8) | (0.9) | (1.0) | (0.9) | (1.4) | (1.6) | (1.1) | (0.9) | (0.9) | (0.7) | (0.8) | (0.8) | |
| 1961–90 | −4.1 | −2.0 | −3.0 | −1.5 | × | −0.3 | 0.3 | 0.9 | 1.4 | −12.7 | −6.3 | −3.1 | −0.9 | −0.4 | 1.4 | −1.0 | −1.5 |
| (1.3) | (0.8) | (1.1) | (0.8) | (0.9) | (1.0) | (1.3) | (1.1) | (1.4) | (1.4) | (1.0) | (0.8) | (0.8) | (0.7) | (0.9) | (0.9) | ||
| 1951–80 | −3.9 | × | −2.8 | × | × | 0.0 | × | 1.1 | × | −12.2 | −6.4 | × | −0.4 | × | × | × | −1.2 |
| (1.2) | (1.3) | (0.9) | (1.3) | (1.7) | (1.7) | (1.1) | (0.9) | ||||||||||
| 1941–70 | −3.6 | × | −2.8 | × | × | 0.0 | × | 1.2 | × | × | −5.7 | × | 0.0 | × | × | × | −1.0 |
| (1.3) | (1.4) | (0.9) | (1.3) | (1.7) | (1.2) | (1.0) | |||||||||||
| 1931–60 | −3.3 | × | −2.9 | × | × | 0.1 | × | 1.4 | × | × | −5.0 | × | 0.4 | × | × | × | −0.9 |
| (1.2) | (1.3) | (0.8) | (1.0) | (2.0) | (1.0) | (0.9) | |||||||||||
| 1921–50 | −3.1 | × | −2.8 | × | × | 0.1 | × | 1.3 | × | × | −4.7 | × | −0.1 | × | × | × | −0.9 |
| (0.9) | (1.1) | (0.7) | (0.9) | (2.3) | (1.3) | (0.8) | |||||||||||
| 1911–40 | −3.6 | × | −2.9 | × | × | −0.2 | × | 1.1 | × | × | × | × | −0.4 | × | × | × | −1.2 |
| (1.6) | (1.4) | 1.6 | (1.1) | (1.3) | (1.2) | ||||||||||||
| 1901–30 | −4.0 | × | −3.1 | × | × | −0.5 | × | 0.9 | × | × | × | × | −0.9 | × | × | × | −1.5 |
| (1.5) | (1.4) | (1.6) | (1.1) | (1.3) | (1.2) | ||||||||||||
| 1891–1920 | −4.5 | × | −3.5 | × | × | −0.9 | × | 0.5 | × | × | × | × | −1.1 | × | × | × | −1.9 |
| (1.4) | (1.4) | (1.6) | (1.1) | (1.3) | (1.1) | ||||||||||||
| 1881–1910 | −4.7 | × | −3.8 | × | × | × | × | 0.1 | × | × | × | × | × | × | × | × | × |
| (1.1) | (1.1) | (0.9) | |||||||||||||||
| (d) | |||||||||||||||||
| 2001–12 | −13.2 | −9.3 | −10.4 | −8.8 | −16.1 | −5.7 | −4.9 | −4.5 | −3.3 | −20.9 | −12.5 | −7.4 | −5.0 | −3.6 | −2.2 | −7.2 | −7.8 |
| (2.3) | (2.5) | (2.5) | (2.4) | (3.0) | (2.1) | (2.0) | (2.4) | (2.2) | (1.7) | (1.9) | (1.6) | (1.4) | (1.5) | (1.0) | (2.0) | (1.9) | |
| 1991–2012 | −15.7 | −11.8 | −12.4 | −11.3 | −17.6 | −7.2 | −6.3 | −6.3 | −4.8 | −21.8 | −13.1 | −9.0 | −5.9 | −4.3 | −3.3 | −9.1 | −9.5 |
| (3.6) | (3.8) | (3.5) | (3.9) | (3.7) | (2.5) | (2.4) | (3.1) | (2.6) | (1.7) | (1.7) | (1.7) | (1.6) | (1.5) | (1.6) | (2.9) | (2.7) | |
| 1981–2011 | −17.2 | −13.0 | −13.4 | −12.5 | −18.7 | −7.7 | −6.7 | −6.8 | −5.3 | −22.1 | −13.9 | −9.8 | −6.6 | −4.8 | −3.5 | −9.9 | −10.3 |
| (4.3) | (4.4) | (4.1) | (4.2) | (4.2) | (3.0) | (2.5) | (3.3) | (2.7) | (1.8) | (2.1) | (1.8) | (1.7) | (1.5) | (1.5) | (3.2) | (3.1) | |
| 1971–2000 | −18.5 | −14.1 | −14.2 | −13.6 | −19.1 | −8.2 | −7.2 | −7.6 | −6.0 | −22.8 | −15.0 | −10.4 | −7.3 | −5.8 | −4.2 | −10.7 | −11.1 |
| (3.6) | (4.2) | (4.0) | (3.9) | (4.6) | (2.9) | (2.4) | (3.4) | (2.6) | (1.6) | (2.1) | (1.4) | (1.5) | (1.4) | (1.3) | (3.0) | (2.9) | |
| 1961–90 | −17.4 | −12.9 | −13.1 | −12.3 | × | −7.1 | −6.1 | −6.3 | −5.0 | −23.1 | −16.0 | −10.7 | −7.5 | −6.1 | −3.6 | −9.7 | −10.3 |
| (4.0) | (4.3) | (4.1) | (4.1) | (2.9) | (2.5) | (3.5) | (2.7) | (1.8) | (2.4) | (1.7) | (1.7) | (1.4) | (1.2) | (3.1) | (2.9) | ||
| 1951–80 | −16.7 | × | −12.7 | × | × | −6.7 | × | −6.1 | × | −23.0 | −16.3 | × | −7.2 | × | × | × | −9.9 |
| (2.6) | (2.9) | (2.0) | (2.7) | (1.8) | (2.2) | (1.7) | (2.0) | ||||||||||
| 1941–70 | −15.8 | × | −12.5 | × | × | −6.5 | × | −5.6 | × | × | −15.7 | × | −6.8 | × | × | × | −9.4 |
| (3.0) | (2.9) | (1.9) | (1.9) | (2.9) | (1.8) | (1.9) | |||||||||||
| 1931–60 | −16.2 | × | −12.9 | × | × | −7.1 | × | −6.2 | × | × | −14.5 | × | −6.5 | × | × | × | −9.8 |
| (2.9) | (2.7) | (2.0) | (2.1) | (2.8) | (1.5) | (1.9) | |||||||||||
| 1921–50 | −16.3 | × | −12.8 | × | × | −7.3 | × | −6.3 | × | × | −13.6 | × | −6.2 | × | × | × | −9.8 |
| (3.7) | (3.4) | (2.3) | (2.5) | (2.7) | (1.5) | (2.4) | |||||||||||
| 1911–40 | −17.7 | × | −14.1 | × | × | −7.8 | × | −7.0 | × | × | × | × | −7.0 | × | × | × | −10.8 |
| (3.8) | (3.7) | (2.3) | (2.4) | (2.0) | (2.6) | ||||||||||||
| 1901–30 | −19.4 | × | −15.5 | × | × | −8.7 | × | −7.8 | × | × | × | × | −7.8 | × | × | × | −11.9 |
| (3.7) | (3.8) | (2.3) | (2.3) | (2.4) | (2.6) | ||||||||||||
| 1891–1920 | −20.4 | × | −17.0 | × | × | −9.2 | × | −8.4 | × | × | × | × | × | × | × | −12.8 | |
| (3.2) | (3.3) | (2.1) | (2.0) | (2.2) | |||||||||||||
| 1881–1910 | −21.0 | × | −17.4 | × | × | × | × | −8.9 | × | × | × | × | × | × | × | × | × |
| (2.7) | (3.2) | (2.2) | |||||||||||||||
Table 3. Greenland daily mean surface air temperature spring (MAM) (a), summer (JJA) (b), autumn (SON) (c) and winter (DJF, where year is year of the January) (d) trends (°C per time period) for climatological normal and shorter recent periods. The Northern Hemisphere temperature trends from HadCRUT3V (Jones et al 2012) are also included for comparison. Significant trends (>1σ) are highlighted in bold type.
| Upernavik | Aasiaat | Ilulissat | Sisimiut | Kangerlussuaq | Nuuk | Paamiut | Narsarsuaq | Qaqortoq | Danmarkshavn | Ittoqqortoormiit | Tasiilaq | Ikermiuarsuk | Ikerasassuaq | CGT2 | CGT3 | HadCRUT3v | |
|---|---|---|---|---|---|---|---|---|---|---|---|---|---|---|---|---|---|
| (a) | |||||||||||||||||
| 2001–11 | 0.4 | 1.7 | −0.3 | 0.0 | −0.2 | −0.8 | −0.8 | 0.0 | −1.1 | 1.0 | 0.5 | −0.6 | × | −0.6 | −0.2 | −0.3 | −0.0 |
| 1991–2011 | 4.2 | 7.9 | 5.4 | 4.8 | 3.5 | 2.6 | 3.0 | 3.1 | 1.9 | 0.9 | −0.3 | 1.5 | × | 1.4 | 3.8 | 3.4 | 0.4 |
| 1981–2011 | 4.0 | 7.8 | 4.4 | 5.2 | 5.1 | 3.4 | 3.8 | 4.5 | 3.3 | 1.6 | 1.8 | 3.3 | × | × | 4.4 | 3.9 | 0.6 |
| 1971–2000 | −0.3 | −0.8 | −1.9 | −0.4 | × | −0.4 | −0.2 | −0.4 | −0.1 | 1.5 | 3.0 | 0.5 | × | × | −0.4 | −0.5 | 0.6 |
| 1961–90 | −0.5 | −1.9 | −1.8 | −1.3 | × | −2.0 | −2.0 | −3.5 | −2.9 | 0.5 | 2.3 | −0.8 | × | × | −1.9 | −1.7 | 0.3 |
| 1951–80 | −0.6 | × | 1.2 | × | × | −1.2 | × | −1.3 | × | 0.6 | 2.71 | −1.7 | × | × | × | −0.7 | 0.1 |
| 1941–70 | −2.9 | × | −0.5 | × | × | −0.5 | × | 0.1 | × | × | −2.7 | −2.6 | × | × | × | −1.3 | −0.0 |
| 1931–60 | −3.7 | × | −2.6 | × | × | −0.8 | × | 0.5 | × | × | −4.9 | −0.2 | × | × | × | −1.4 | −0.0 |
| 1921–50 | −0.0 | × | −1.2 | × | × | −1.0 | × | 0.4 | × | × | × | −0.3 | × | × | × | −0.4 | 0.3 |
| 1911–40 | 3.6 | × | 3.4 | × | × | 2.3 | × | 1.0 | × | × | × | × | × | × | × | 2.7 | 0.5 |
| 1901–30 | 1.9 | × | 3.9 | × | × | 3.2 | × | 2.3 | × | × | × | × | × | × | × | 2.9 | 0.2 |
| 1891–1920 | 1.9 | × | 2.7 | × | × | 1.1 | × | 0.8 | × | × | × | × | × | × | × | × | −0.1 |
| 1881–1910 | 2.5 | × | 1.8 | × | × | × | × | −0.1 | × | × | × | × | × | × | × | × | −0.2 |
| (b) | |||||||||||||||||
| 2001–11 | 2.0 | 1.1 | 0.8 | 1.0 | 0.8 | 1.1 | 0.1 | 0.9 | 0.3 | −0.4 | −0.6 | 0.4 | × | 0.8 | 0.8 | 1.0 | 0.1 |
| 1991–2011 | 3.8 | 2.8 | 2.1 | 3.7 | 1.9 | 2.5 | 1.7 | 1.2 | 1.0 | 0.9 | 0.4 | 1.9 | × | 2.2 | 2.3 | 2.3 | 0.5 |
| 1981–2011 | 2.3 | 2.6 | 1.4 | 3.1 | 1.9 | 2.4 | 2.5 | 1.5 | 2.1 | × | × | 2.3 | × | × | 2.2 | 2.0 | 0.7 |
| 1971–2000 | 0.4 | 0.7 | 0.9 | 0.1 | × | −0.0 | 0.6 | 0.8 | 1.1 | × | × | 0.1 | × | × | 0.5 | 0.4 | 0.6 |
| 1961–90 | 0.5 | −0.2 | 1.1 | −0.1 | × | −0.6 | −0.6 | −0.1 | −0.7 | × | × | −0.8 | × | × | −0.2 | 0.0 | 0.2 |
| 1951–80 | −0.2 | × | −0.0 | × | × | −0.7 | × | −0.5 | × | × | × | −1.1 | × | × | × | −0.5 | −0.1 |
| 1941–70 | 0.2 | × | 0.1 | × | × | −1.2 | × | −0.8 | × | × | −4.6 | −1.3 | × | × | × | −0.6 | −0.1 |
| 1931–60 | −0.1 | × | 0.2 | × | × | −0.6 | × | −0.2 | × | × | −6.4 | −0.6 | × | × | × | −0.3 | −0.1 |
| 1921–50 | 0.2 | × | 0.2 | × | × | 0.7 | × | 0.9 | × | × | × | 0.8 | × | × | × | 0.6 | 0.2 |
| 1911–40 | 2.4 | × | 0.7 | × | × | 1.7 | × | 0.3 | × | × | × | × | × | × | × | 1.2 | 0.6 |
| 1901–30 | 0.4 | × | −0.2 | × | × | 0.9 | × | 0.9 | × | × | × | × | × | × | × | 0.6 | 0.3 |
| 1891–1920 | −0.8 | × | −0.6 | × | × | −0.5 | × | 0.5 | × | × | × | × | × | × | × | × | −0.2 |
| 1881–1910 | 1.0 | × | 1.6 | × | × | × | × | 1.0 | × | × | × | × | × | × | × | × | −0.2 |
| (c) | |||||||||||||||||
| 2001–11 | −1.2 | −1.1 | −1.7 | −1.0 | −2.1 | −1.0 | −0.3 | −1.3 | −1.1 | −1.7 | −2.1 | −1.5 | × | −0.4 | −1.1 | −1.3 | −0.0 |
| 1991–2011 | 1.3 | 1.4 | 0.5 | 2.2 | 0.2 | 1.4 | 1.6 | 1.2 | 1.2 | 0.9 | 0.0 | 0.6 | × | 1.7 | 1.3 | 1.0 | 0.6 |
| 1981–2011 | 2.2 | 2.2 | 1.9 | 2.8 | 2.5 | 2.4 | 2.4 | 1.9 | 2.3 | × | × | 1.7 | × | × | 2.2 | 2.0 | 0.8 |
| 1971–2000 | 0.7 | 0.5 | 0.6 | 0.6 | × | 0.2 | 0.2 | 0.1 | 0.6 | × | × | 1.7 | × | × | 0.6 | 0.6 | 0.5 |
| 1961–90 | −0.7 | −0.3 | −0.4 | −0.5 | × | −0.6 | −0.5 | 0.1 | −0.2 | × | × | 0.8 | × | × | −0.3 | −0.2 | 0.2 |
| 1951–80 | −0.1 | × | −0.2 | × | × | −0.5 | × | −0.9 | × | −1.9 | −0.5 | −1.8 | × | × | × | −0.7 | −0.0 |
| 1941–70 | −0.3 | × | 0.6 | × | × | 0.0 | × | −0.8 | × | × | −2.0 | −2.0 | × | × | × | −0.5 | −0.1 |
| 1931–60 | −1.3 | × | 0.4 | × | × | 0.1 | × | 0.4 | × | × | × | 0.6 | × | × | × | 0.0 | −0.2 |
| 1921–50 | −0.3 | × | −0.6 | × | × | −0.5 | × | −0.3 | × | × | × | 1.9 | × | × | × | 0.0 | 0.2 |
| 1911–40 | 2.4 | × | 0.2 | × | × | 1.2 | × | 0.6 | × | × | × | 1.2 | × | × | × | 1.1 | 0.7 |
| 1901–30 | 1.3 | × | 0.6 | × | × | 0.7 | × | 1.2 | × | × | × | × | × | × | × | 0.9 | 0.4 |
| 1891–1920 | −0.3 | × | 0.4 | × | × | −0.8 | × | 0.2 | × | × | × | × | × | × | × | × | −0.1 |
| 1881–1910 | 1.5 | × | 0.9 | × | × | × | × | 1.0 | × | × | × | × | × | × | × | × | 0.0 |
| (d) | |||||||||||||||||
| 2001–12 | 4.8 | 3.4 | 4.1 | 4.3 | 5.3 | 1.7 | 3.3 | 1.8 | 1.5 | 1.2 | 1.7 | 1.4 | 0.4 | 1.4 | 2.9 | 2.8 | −0.1 |
| 1991–2012 | 10.4 | 10.1 | 8.4 | 10.5 | 7.4 | 5.8 | 6.2 | 6.7 | 5.8 | 3.3 | 2.0 | 3.2 | 2.7 | 4.1 | 7.5 | 6.9 | 0.2 |
| 1981–2011 | 8.6 | 8.3 | 6.8 | 8.0 | 6.1 | 4.2 | 3.5 | 4.2 | 3.9 | 2.3 | 3.2 | 3.5 | × | × | 5.7 | 5.5 | 0.5 |
| 1971–2000 | 0.4 | −0.2 | 0.1 | −0.2 | × | −0.7 | −0.6 | −0.5 | −0.3 | 0.3 | 2.8 | 1.6 | × | × | −0.0 | 0.2 | 0.7 |
| 1961–90 | −4.8 | −4.4 | −3.6 | −4.3 | × | −3.0 | −2.6 | −2.9 | −2.6 | 1.9 | 2.2 | −0.2 | × | × | −3.2 | −2.9 | 0.2 |
| 1951–80 | 0.2 | × | 1.7 | × | × | 0.8 | × | 0.6 | × | × | −0.6 | −1.1 | × | × | × | 0.4 | −0.1 |
| 1941–70 | −0.3 | × | 0.9 | × | × | 1.0 | × | 0.6 | × | × | −3.4 | −1.8 | × | × | × | 0.1 | −0.1 |
| 1931–60 | −1.8 | × | −1.9 | × | × | −0.2 | × | −0.6 | × | × | −3.4 | −0.5 | × | × | × | −1.0 | 0.1 |
| 1921–50 | 3.7 | × | 1.3 | × | × | 1.7 | × | 2.3 | × | × | × | 0.2 | × | × | × | 1.9 | 0.3 |
| 1911–40 | 5.0 | × | 5.3 | × | × | 2.1 | × | 2.4 | × | × | × | × | × | × | × | 3.8 | 0.5 |
| 1901–30 | 5.3 | × | 4.5 | × | × | 2.8 | × | 2.7 | × | × | × | × | × | × | × | 4.0 | 0.2 |
| 1891–1920 | 1.1 | × | 0.5 | × | × | 1.2 | × | 1.0 | × | × | × | × | × | × | × | × | −0.0 |
| 1881–1910 | −0.8 | × | −0.1 | × | × | × | × | −0.2 | × | × | × | × | × | × | × | × | −0.0 |
3.1.1. Spring.
Mean SAT. Mean SAT for the most recent 2001–11 period ranges from −14.7 °C at 04320 Danmarkshavn, on the icy north-east Greenland coast where seasonal sea-ice cover is near its maximum extent (NSIDC 2012) to 1.5 °C at 04270 Narsarsuaq in the far south (table 2(a)). Mean SAT at the latter location has crept significantly above the freezing point from a low value of −0.4 °C in 1971–2000, which like many other sites was similar to 1881–1910 or 1891–1920 mean SAT (table 2(a)), and station 04260 Paamiut has recently been not far from the melt threshold (−0.8 °C for 2001–11). Mean SAT for the latest decade is also generally slightly, but not significantly, ∼0.1–0.4 °C, above the 1930s/40s warm peak depicted by the 1921–50 and 1931–60 normal periods. Indeed, analysis of CGT3 11 year running means representing 1895–2011 yields the highest means of −3.2 °C for 1926–36 and 1927–37, compared with −3.8 °C for 2000–10. However, a Related Samples Wilcoxon Signed Ranks Test shows no significant difference at the p = 0.10 level. The lowest running mean CGT3 is −6.9 °C for 1983–93, compared with the early record low of −6.1 °C for 1896–1906 and 1897–1907, suggesting particularly pronounced spring cooling—compared as we shall see with the other seasons—during the 1980s and early 1990s prior to the recent warming. CGT3 for the latest decade is 1.8 °C above the 1891–1920 and 1971–2000 values, and CGT2 for 2001–11 is 2.1 °C above 1971–2000 mean CGT2. The greatest overall increase in mean SAT is observed for 04221 Ilulissat, which shows a 3.1 °C positive difference between 1881–1910 and 2001–11.
Turning now to mean SAT trends, these are most significant, showing striking strong warming, during the 1981–2011 and 1991–2011 periods, of typically 3–5 °C for these respective time periods but up to nearly 8 °C at 04220 Aasiaat (table 3(a)). This is generally greater than the earlier 1911–40 and 1901–30 warming trends of 2.3–3.9 °C for those time periods for several sites. Aasiaat is also the hotspot of the more recent 2001–11 spring warming (1.7 °C) for the whole Greenland coast; the reason for this is unknown but merits attention. More modest warmings of 1–2 °C since 1981 are seen along the north-east Greenland coastline; perhaps lingering sea-ice is muting the spring warming signal in this region. It is also noteworthy that most stations show a strong 1–3 °C spring cooling for 1961–90 that was greatest in the south (3.5 °C at 04270 Narsarsuaq), in line with previous reports of Greenland cooling for this time period (Hanna and Cappelen 2003). Daily maximum and minimum SAT. The available data show greater recent (1981–2011 and 1991–2011) warming in mean daily minimum, than daily maximum, air temperatures at 04231 Kangerlussuaq, but an opposite pattern at 04270 Narsarsuaq, with rather similar warmings for minimum and maximum temperatures at 04360 Tasiilaq (tables S2(a) and S4(a) in the supplementary materials available at stacks.iop.org/ERL/7/045404/mmedia). Warmings for the last 30 years are generally between 3 and 5 °C except for 04220 Aasiaat which experienced much stronger 7–8 °C mean daily minimum temperature increases over the last 20 and 30 years (table S4(a)). The Greenland coastal averaged CGT3 early mid 20th century warming is much more pronounced for the daily minimum temperatures but the subsequent (1941–1970) cooling is much greater in the CGT3 daily maximum temperatures. Both the mean daily minimum and daily maximum temperatures in spring had little change or even declined slightly, but not significantly, over the last decade.
3.1.2. Summer.
Mean SAT. The warmest sites during 2001–11 are 04270 Narsarsuaq and 04231 Kangerlussuaq, with mean SAT both slightly above 10 °C for this time period, and the coldest site is 04351 Aputiteeq at only 2.6 °C, affected by its location on a promontory and proximity to the cold East Greenland Current (table 2(b)). In general, mean SAT was ∼1–2 °C warmer than during the 1971–2000 cold period. The 2001–11 mean SAT values are clearly above 1931–60 mean values at all sites, by an average of 0.8 °C for CGT3 but 1.7 °C warmer for 04211 Upernavik and only 0.2 °C warmer for 04360 Tasiilaq. This is confirmed by analysis of running means of CGT3, which reached or exceeded 7.0 °C for five successive summer periods since 1997–2007, whereas there was only one previous comparable 11-year period, 1926–36, that averaged as high as 7.0 °C. Indeed the last two 11-year periods 2000–10 and 2001–11 averaged 7.4 °C. A related samples Wilcoxon signed ranks test indicates a 91% probability that CGT3 2001–11 (or 2000–10) mean temperature is statistically warmer than the previous 1926–36 warm peak. The lowest 11-year running mean was 5.6 °C for 1912–22 and 1913–23, which was closely approached (5.8 °C) during the later cold peak in 1963–73.
Tasiilaq experienced 1.0 °C warming in its mean SAT between 1891–1920 and 2001–11, but the difference between the same time periods was much greater at 2.7 °C for 04211 Upernavik. Some of the greatest warming of recent times was seen at 04230/34 Sisimiut, which has a 1.5 °C difference in its 2001–11 and 1981–2011 mean SAT (table 2(b)).
Summer warming trends are generally highly significant, although at generally 2–4 °C, less than spring trends, for 1981–2011 and 1991–2011. The hotspot of warming was, once again, 04230/34 Sisimiut at 3.1 °C for 1981–2011 and 3.7 °C for 1991–2011, although 04211 Upernavik also warmed particularly strongly (3.8 °C) during the later period (table 3(b)). The available data for 04339 Ittoqqortoormiit show no significant change for 1991–2011, and even significant summer cooling in its mean SAT for 2001–11; there is also (insignificant) cooling for the same time period at 04320 Danmarkshavn (table 3(b)). CGT2 and CGT3 warming trends of 2.0–2.3 °C for 1981–2011 and 1991–2011 are much in excess of HadCRUT3v northern hemisphere temperature increases of ∼0.6 °C for the same time periods (table 3(b)). These CGT3 trends are also well above the CGT3 warming of 1.2 °C for 1911–40 (table 3(b)). Daily maximum and minimum SAT. Here significant warmings of ∼1.0 °C are evident even for the shorter latest period of 2001–11 (tables S2(b) and S4(b) available at stacks.iop.org/ERL/7/045404/mmedia). The hotspot of warming for the last decade was 04211 Upernavik which has increases of 2.0 (1.7) °C in its mean maximum (minimum) temperatures. The cool spot was 04339 Ittoqqortoormiit which experienced slight, non-significant coolings. Temperature increases in southern Greenland for the 1981–2011 and 1991–2011 period were generally greater for maximum than minimum temperatures (tables S2(b) and S4(b) available at stacks.iop.org/ERL/7/045404/mmedia).
3.1.3. Autumn.
Mean SAT. Mean temperatures for 2001–11 range from −10.7 °C at 04320 Danmarkshavn to +2.9 °C at 04390 Ikerasassuaq (table 2(c)), both locations being on the eastern side of Greenland but the latter in the extreme south (figure 1). Four sites (04230 Sisimiut, 04250 Nuuk, 04360 Tasiilaq and 04382 Ikermiuarsuk) have mean SATs that have risen above the freezing threshold since 1961–90, reflecting the lengthening of the melt season for adjacent zones of the ice sheet and nearby marginal glaciers. The site with the greatest mean SAT increase (2.2 °C) between the 1961–90 and 2001–11 periods is 04339 Ittoqqortoormiit, and the sites with the least change (0.9 °C) are 04221 Ilulissat and 04270 Narsarsuaq. Mean SAT for 2001–11 was generally 0.2–0.7 °C above the earlier, 1921–50 warm peak at most sites, although there is only 0.1 °C difference between 1991–2011 and 1921–50 or 1931–60 in CGT3. Running mean analysis of CGT3 shows the warmest 11 year period of −0.3 °C during 2000–10, compared with the previous warm peak of −0.6 °C for 1927–37; the temperature difference between the two periods is statistically insignificant. Like Spring, autumn running mean CGT3 temperatures dipped almost to early twentieth century values: −1.8 °C for 1977–87, just prior to the recent strong warming, compared with −2.1 °C for 1896–1906, 1897–1907 and 1898–1908.
Long-running stations 04211 Upernavik, 04221 Ilulissat and 04270 Narsarsuaq indicate ∼1.7–1.8 °C of warming since 1881–1920. The trend analysis shows generally significant warming trends of ∼2–3 °C for 1981–2011 focused on, and inland of, Greenland's mid-west and south-west coasts, and slightly lower but still significant warming of 1.7 °C at 04360 Tasiilaq in the east (table 3(c)). However, over the last 12 years 2001–11, autumn temperatures actually declined by typically just over 1 °C, with statistically significant declines for CGT3 (−1.3 °C) and quite a number of stations on Greenland's west and east coasts: most notably −2.1 °C at 04231 Kangerlussuaq and 04339 Ittoqqortoormiit. Unlike for other seasons, none of the (for autumn slight) cooling trends of 1961–90 are statistically significant. Daily maximum and minimum SAT. As noted above, and in contrast to other seasons, autumn temperatures underwent often significant decreases during the latest 2001–11 period: this is true of both the minimum and maximum temperatures, with little to distinguish between them (tables S2(c) and S4(c) available at stacks.iop.org/ERL/7/045404/mmedia). However, overall, there was typically 1–2 °C warming—generally significant—for the overall 1981–2011 period.
3.1.4. Winter.
Mean SAT. This is the season with the greatest temperature changes and trends. The difference in mean SAT between 1881–1910 and 2001–12 is as much as 7.8 °C for 04211 Upernavik but 'only' 4.4 °C for 04270 Narsarsuaq and also a relatively small 3.5 °C difference at 04250 Nuuk between 1891–1920 and 2001–12 (table 2(d)). Mean SAT was typically 3–5 °C higher for 2001–12 than 1971–2000 (e.g. 5.3 °C higher at 04211 Upernavik), which represents a large increase in mean temperatures for this relatively short time period. Mean 2001–12 temperatures are also evidently 1–3 °C above the warmest normal periods during the early mid 20th Century (table 2(d)). Running mean analysis reveals −7.8 °C for CGT3 for 2001–11 and 2002–12 compared with a whole degree lower at −8.8 °C during two peaks marking the Early Twentieth Century Warming, i.e. 1926–36 and 1938–48. The 2001–11 winter temperature peak is significantly higher than 1938–48 (98% confidence) but not significantly higher than 1926–36, due to relatively high temperature variability during this season.
Mean SAT trends for 1991–2012 are in excess of 10 °C along Greenland's west and north-west coastline at 04211 Upernavik, 04220 Aasiaat and 04230/34 Sisimiut, although trends are much lower on the east side of Greenland: only 2.0 °C at 04339 Ittoqqortoormiit (table 3(d)). A similar pattern is seen with the 1981–2011 warming trends: now 8–9 °C in places along the west coast but only 2–3.5 °C in east Greenland. However, it is important to note that for both time periods, the east coast warmings are still significant. Mean SAT trends for the latest 2001–12 period were greatest (5.3 °C) at 04231 Kangerlussuaq (an inland west Greenland site near the ice-sheet margin at Sondre Stromfjord), and 3–4 °C and significantly high at most other west coast stations, and positive but not significant in the east (table 3(d)). The overall CGT3 trend of 5.5 °C for 1981–2010 is well in excess of trends for all climatological standard normal periods during the early mid 20th century, and exceeds contemporaneous northern hemisphere warming by an order of magnitude. The 1960s–80s cooling was clearly focused along the west and north-west coasts (−4 to −5 °C trends at several stations), whereas at the same time several east coast stations saw either significant warmings or not much change (table 3(d)). Daily maximum and minimum SAT. The recent warming is greater for minimum than maximum temperatures, at 6.0 and 5.0 °C, respectively, for CGT2 for 1991–2012 (tables S2(d) and S4(d) available at stacks.iop.org/ERL/7/045404/mmedia). This is also true of the early 20th Century warming: i.e. 4.5 and 3.7 °C for 1901–30 and 1911–40 for daily minimum temperatures, compared with 3.5 and 2.9 °C for the same periods for daily maximum temperatures. The mid-late 20th century cooling, e.g. for the period 1941–70, is also far more marked and significant in the minimum than maximum temperatures. Minimum temperature trends since 1981 reach 9–10 °C for 04220 Aasiaat (table S4(d) available at stacks.iop.org/ERL/7/045404/mmedia). Mean winter daily maximum temperatures have recently reached within 1 °C of freezing at 04270 Narsarsuaq and 04272 Qaqortoq during 2001–12, although mean winter daily minimum temperatures remain at >6 °C below freezing. Mean winter daily minimum temperature increased only 1.6 °C between 1891–1920 and 2001–12 at 04270 Narsarsuaq, compared with a 7.6 °C increase at 04211 Upernavik (table S3(d)). Compared with mean daily maximum temperatures, mean daily minimum temperatures tended to be greater for 2001–12 in relation to equivalent data from the early mid 20th century.
3.2. GC-Net Swiss Camp (west Greenland ice sheet) surface air temperature series
We combine data from the Swiss Camp Research Tower and AWS—which are very strongly correlated and have a mean difference of just 0.15 °C between their monthly means—to provide a monthly SAT record extending from May 1991 to April 2011; only ten months during the 21 years had insufficiently complete data to calculate monthly means. Although solar radiation can cause warm biases of up to 5 °C for short time periods at Swiss Camp, and has caused larger biases with Antarctic AWS (Genthon et al 2011), this effect is generally mitigated by natural ventilation of the thermometers from the katabatic wind for most of the year, with mean monthly wind speeds all above 5 m s−1; a comparison of ventilated and non-ventilated AWS thermocouples indicates that the standard unventilated GC-Net AWS annual mean air temperature is accurate to within 0.2 °C (Steffen and Box 2001). The updated Swiss Camp SAT series is shown in figure 3. Trend analysis of standard seasonal averages of these data reveals the following trends for 1991–2011: 7.3 °C in winter, 2.5 °C in spring, 2.6 °C in summer and 2.1 °C in autumn, which are all statistically significant at the 1σ level; indeed the winter and summer trends are both significant at the 2σ level. This is the same pattern as seen above with relatively nearby DMI stations along/inland from Greenland's west coast, i.e. much stronger winter warming over the last 20 years and similar order of magnitude of warming for coastal and inland for this part of west Greenland for most seasons. The major exception is that the spring warming trend at Swiss Camp is relatively modest compared with that at 04220 Aasiaat (7.9 °C), 04221 Ilulissat (5.4 °C) and 04230 Sisimiut (4.8 °C) for the same time period.
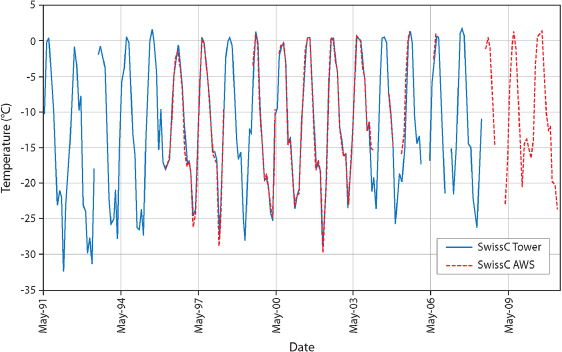
Figure 3. Updated GC-Net Swiss Camp Research Tower/AWS (west Greenland) monthly surface air temperature record 1991–2011.
Download figure:
Standard image3.3. South-east Greenland surface air temperature series
SAT data from two stations, Station Coast located next to the Sermilik Research Station at 25 m above sea-level (asl) and Station Nunatak adjacent to Mittivakkat Gletscher at 515 m asl, were merged together using regression fitting. The primary data series is Station Nunatak, which has data running from July 1993 through July 2011 but with gaps from January–May 2006 and June–December 2007. These gaps were largely infilled using regression fitting with Station Coast (r2 = 0.91) except for the three months June–August 2007, when no Station Coast data were available, and the combined SAT series is shown in figure 4. Trend analysis of standard seasonal averages of these data reveals the following trends for 1993–2011: 2.9 °C in winter, 0.9 °C in spring, 2.6 °C in summer and 1.0 °C in autumn. Only the spring trend is statistically insignificant, while the autumn and winter (summer) trends are significant at the 1σ (2σ) level. These trends are comparable with trends in mean SAT for 06360 Tasiilaq for a similar period, but much less than SAT trends generally seen on the western side of Greenland for the same time period.
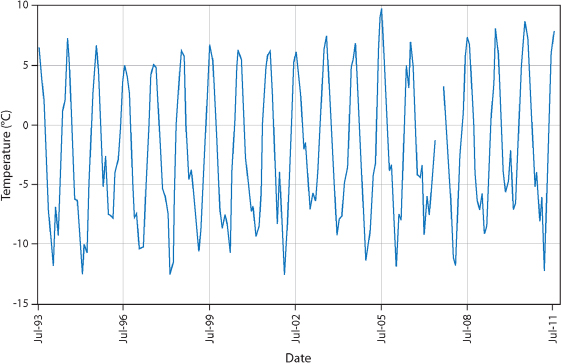
Figure 4. Monthly surface air temperature record for Mittivakkat Gletscher 'Nunatak' (Ammassalik Island, south-east Greenland) weather station, 1993–2011, infilled for several missing months with nearby coastal weather station data.
Download figure:
Standard image4. Discussion and conclusions
Quite clearly there are striking regional and seasonal differences in Greenland SAT changes, most notably during (but not confined to) the last 10–20 years of generally strong warming in Greenland. Warming was much greater on the western side than the east—although still significant in the latter—and in winter than in other seasons. The recent (1991–2011) warming locally exceeds 10 °C along the west Greenland coast in winter. The 1930s warming trend was much more modest in comparison but was also strongest, at ∼5 °C, for west Greenland in winter for 1901–30 and 1911–40. Greenland coastal mean SAT was ∼1.6/0.1/0.8/0.5 °C above its early 20th Century peak during the most recent 2001–12 period in winter/spring/summer/autumn, although only the winter and summer differences are statistically significant. Summer SAT increases in southern Greenland for the last 20 years were generally greater for maximum than minimum temperatures. By contrast, in winter, the recent warming was greater for minimum than maximum temperatures.
The recent (last 20–30 years') significant warming in summer and winter, particularly focused up the west coast and near-ice sheet areas in winter, is very likely related to NAO and GBI (Greenland anticyclonicity, which is generally strongly negatively correlated to NAO) changes that induce a greater frequency of relatively mild southerly (meridional) airflows along the western flank of the Greenland Ice Sheet (as found for summer by Hanna et al 2012); these same airflows may sometimes miss east Greenland, which also often comes under the influence of the cold East Greenland Current, and both of these factors most likely reduce the warming there. As NAO has tended to become more negative since ∼2000, GBI and Greenland anticyclonicity have increased (Hanna et al 2012).
Part 2 of this study will systematically analyse the atmospheric circulation/jet stream dynamics affecting Greenland climate systematically for all seasons, which can help explain some of the SAT anomalies highlighted above. It will be especially valuable to analyse the atmospheric circulation regimes and anomalies, e.g. using geopotential height data from Twentieth Century Reanalysis (Compo et al 2011), to gain a better insight into and understanding of the previous, early Twentieth Century Greenland warming, which peaked around 1940, and so help set the more recent (last ∼20 years') warming in a dynamical context of previous (pre-anthropogenic) more 'natural' circulation patterns. The better understanding thus acquired should ultimately help refine future predictions of Greenland regional climate (and ice-sheet mass balance) change.
Acknowledgments
We thank the Climatic Research Unit for provision of the HadCRUT3v global temperature dataset used in this study. EH thanks Paul Coles for help producing several figures.