
Abstract
Conversion of natural to urban land forms imparts influence on local and regional hydroclimate via modification of the surface energy and water balance, and consideration of such effects due to rapidly expanding megapolitan areas is necessary in light of the growing global share of urban inhabitants. Based on a suite of ensemble-based, multi-year simulations using the Weather Research and Forecasting (WRF) model, we quantify seasonally varying hydroclimatic impacts of the most rapidly expanding megapolitan area in the US: Arizona's Sun Corridor, centered upon the Greater Phoenix metropolitan area. Using a scenario-based urban expansion approach that accounts for the full range of Sun Corridor growth uncertainty through 2050, we show that built environment induced warming for the maximum development scenario is greatest during the summer season (regionally averaged warming over AZ exceeds 1 °C). Warming remains significant during the spring and fall seasons (regionally averaged warming over AZ approaches 0.9 °C during both seasons), and is least during the winter season (regionally averaged warming over AZ of 0.5 °C). Impacts from a minimum expansion scenario are reduced, with regionally averaged warming ranging between 0.1 and 0.3 °C for all seasons except winter, when no warming impacts are diagnosed. Integration of highly reflective cool roofs within the built environment, increasingly recognized as a cost-effective option intended to offset the warming influence of urban complexes, reduces urban-induced warming considerably. However, impacts on the hydrologic cycle are aggravated via enhanced evapotranspiration reduction, leading to a 4% total accumulated precipitation decrease relative to the non-adaptive maximum expansion scenario. Our results highlight potentially unintended consequences of this adaptation approach within rapidly expanding megapolitan areas, and emphasize the need for undeniably sustainable development paths that account for hydrologic impacts in addition to continued focus on mean temperature effects.
Export citation and abstract BibTeX RIS

Content from this work may be used under the terms of the Creative Commons Attribution-NonCommercial-ShareAlike 3.0 licence. Any further distribution of this work must maintain attribution to the author(s) and the title of the work, journal citation and DOI.
1. Introduction
Although an overall world population increase of 2.3 billion is projected by 2050 relative to 2011, urban growth is estimated at 2.6 billion, as urban complexes, in addition to absorbing all of the world's additional inhabitants, are expected to draw in 0.3 billion rural residents [1]. To meet the ever-increasing population-driven demand of urban infrastructure during the next few decades, substantial conversion of natural landscapes to urban land forms is anticipated [2]. The landscape modification associated with emergence and expansion of large urban agglomerations will necessarily modify the surface radiation and moisture balance, with implications for local and regional hydroclimate. Considering the likely prospects of future urban growth, research addressing hydroclimatic consequences of emerging and expanding megapolitan areas is essential to provide guidance for city planners, and energy and water providers, focused on undeniably sustainable development paths with minimum environmental consequences.
The most documented mechanism whereby urban complexes modify their own and that of surrounding environments is the urban heat island (UHI) [3–10]. Defined as a thermal difference between urban and nearby rural areas, the characterization of the UHI depends on the biome in which the urban complex resides [9, 11], with considerable sustainability implications (e.g., timing of peak energy demand and delivery for air conditioning use associated with maximum UHI-induced warming impacts) for the placement of newly emerging and rapidly expanding megapolitan areas. In addition to their thermal influence, mounting evidence also suggests that urban agglomerations modify local to regional-scale precipitation [12–16]. While much of this work has fundamentally advanced our understanding of hydroclimatic impacts of urban regions, there has been relatively less research addressing consequences arising from rapidly expanding megapolitan areas [17]. Since projected global urban expansion is expected to dwarf urbanization witnessed thus far [2], likely hydroclimatic effects of urban development (e.g., rapidly expanding megapolitan areas) should be expected to exceed similar impacts studied to date.
Within the US, Arizona's Sun Corridor is the fastest growing megapolitan area, a designation for a housing and urban land-use corridor anchored by two or more large cities at its geographical termini [18]. The state of Arizona is projected to reach a top ten national ranking as one of the most populous in the US by 2030 [19], with mid-century population estimates ranging between 8 and 16 million people [20]. Since precise forecasts of Sun Corridor growth through mid-century are unlikely to produce accurate placement of urban land forms, scenario-based projections that account for the full range of growth uncertainty are required to evaluate hydroclimatic impacts resulting from urban-induced landscape modification.
The Greater Phoenix area, at the heart of the emerging Sun Corridor and the largest metropolitan area within the Colorado River Basin, has undergone substantial landscape modification throughout the 20th century [21]. During the second half of the century, shifting economic priorities directed the region away from a mostly agrarian lifestyle to a major metropolitan area. The outcome was considerable urban land-use development at the expense of agricultural plots and native semi-desert landscapes [21]. Recent work indicates that projected Sun Corridor expansion through mid-century could induce summer season local- to regional-scale near-surface temperature impacts at least as important as those owing to large-scale climate change [22]. In addition to locally simulated summertime warming approaching 4 °C for a maximum expansion scenario, the vast conversion of natural to impermeable surfaces was shown to lower summertime evapotranspiration (ET) by 1–2 mm day−1 over newly urbanizing urban areas.
Here we extend previous scenario-based Sun Corridor expansion work by emphasizing seasonally varying hydroclimatic consequences, and fully characterize impacts on near-surface temperature and precipitation throughout the calendar year. Our numerical simulations, using the Weather Research and Forecasting (WRF) modeling system, account for a maximum and minimum Sun Corridor expansion scenario, as well as integration of highly reflective cool roofs within the built environment to assess the alleviation potential of UHI-induced warming. In evaluating impacts on accumulated precipitation we also hope to shed light on potential consequences for renewable water resources. For example, the Salt River watershed, a highly managed system of dams and reservoirs provides nearly half of the annual water supply for the Phoenix metropolitan area [23], and evaluation of regional-scale precipitation change is justified given the combined effects of urban-induced and large-scale climate change impacts on this semi-arid urban region [22].
Finally, although our focus is on the rapidly expanding Sun Corridor, we hope our scenario-based approach, accounting for the full range of urban expansion uncertainty, will be extended to other rapidly expanding megapolitan areas, particularly in the developing world where the large share of future (urban-related) population rise is expected [2].
2. Methods
We have used version 3.2.1 of the WRF modeling system [24, 25] to conduct sensitivity experiments assessing hydroclimatic consequences of Sun Corridor expansion. A detailed summary (e.g., parameterization options, forcing data) of the modeling approach has been presented in preceding work [22]; therefore we provide only an overview here.
We performed three-year (2006–8) continental-scale, ensemble-based simulations at 20 km resolution, for both a modern-day Sun Corridor representation and scenario-based expansion (figure 1). The domain utilized includes portions of the Atlantic and Pacific Oceans, northern Mexico and Southern Canada [22]. Each numerical experiment consists of four independent realizations (realization 1 has a start time of October 2005; realization 2 has a start time of November 2005; realization 3 has a start time of December 2005; realization 4 has a start time of January 2006; all analysis consists of the period January 2006 through December 2008), with variable spin-up times, an invaluable approach for reduction of internal model noise and sensitivity to initial conditions.
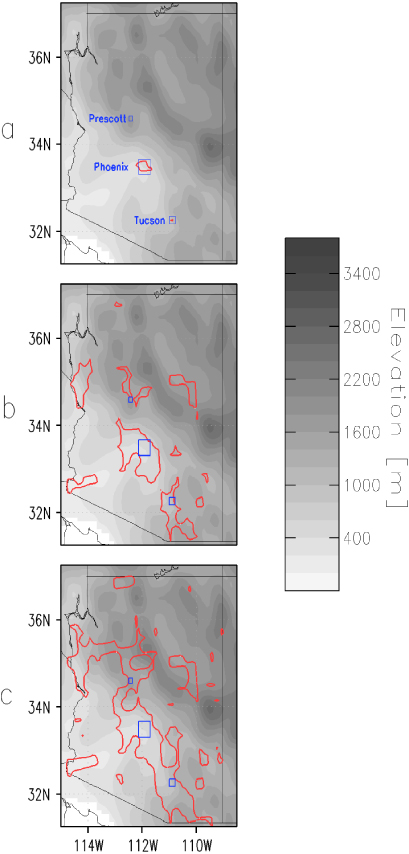
Figure 1. Representation of Sun Corridor urban landscape extent used within (a) Control, (b) SUNCORR_Low, and (c) SUNCORR_High WRF simulations. Urban land-use is bounded by red contours. Approximate geographic extent of the cities of Prescott (north-central AZ), Tucson (southeast AZ), and the Phoenix metropolitan area (central AZ) are denoted by blue squares. Topography is overlaid in meters with higher altitudes appearing darker.
Download figure:
Standard imageSince each scenario comprises of 12 years of numerical experiments (three years of model integration times four independent realizations), all model simulations are averaged to produce a corresponding scenario mean.
We account for urban expansion by incorporating Maricopa Association of Governments (MAG)-projected high and low development mid-century Sun Corridor growth scenarios. MAG, serving as the regional agency for metropolitan Phoenix (www.azmag.gov/) and dedicated to long-range and strategic planning, conducted statewide growth analyses based on land ownership patterns. Military lands, forests, parks and national monument lands, and Native American residential lands, were deemed slowly or non-developing, leaving privately owned land and state trust lands as areas where conversion to urban land-use was projected to occur. A maximum geographical expansion scenario (hereafter 'SUNCORR_High') was based on a designation that required a minimum number of MAG-projected dwelling units per unit area to meet urban land-use criteria. This scenario resulted in the greatest possible urban land-use spatial extent, and these pixels were converted to high intensity/commercial class within WRF's single-layer urban canopy model (UCM) [25, 26]. The UCM accounts for urban geometry, shadowing from and reflection of buildings, roof, road, and wall biophysical representation, and diurnal cycle of anthropogenic heating. SUNCORR_High therefore consists of the greatest spatial extent and greatest urban land-use intensity. A minimum geographical expansion scenario (hereafter 'SUNCORR_Low') was based on a designation requiring a maximum number of MAG-projected dwelling units per unit area to meet urban land-use criteria. This scenario resulted in the most restrictive urban land-use spatial extent, and these pixels were converted to low intensity residential class within WRF's single-layer UCM. SUNCORR_Low therefore consists of the most restrictive spatial extent and least urban land-use intensity. Consequently, our approach embraces the full range of Sun Corridor megapolitan expansion uncertainty rather than relying on specific forecasts for which precise predictions (of urban land forms) are unlikely to be attainable.
Integration of highly reflective cool roofs within the built environment, increasingly recognized as a cost-effective adaptation option intended to offset the warming influence of urban complexes [27, 28], was based on modification of SUNCORR_High experiments. Roof albedos were set to an EPA Energy Star SOLARFLECT coating value of 0.88 (hereafter 'SUNCORR_Adapt'). The value of 0.88 was based on the solar reflectance after three years of wear and tear (EPA Energy Star Roof Product List: http://downloads.energystar.gov/bi/qplist/roofs_prod_list.pdf?8ddd-02cf; accessed 1 June 2011). Usage of this, rather than a lower value, is intended to quantify the greatest possible offset of UHI-induced warming over this rapidly urbanizing semi-arid megapolitan area.
We utilize the US Geological Survey's National Land Cover Database 2006 [29] to represent urban features of modern-day central Arizona (figure 1(a); hereafter 'CONTROL'), and replace this landscape with MAG-generated projections of high and low development Sun Corridor growth scenarios to characterize projected mid-century expansion (figures 1(b) and (c)).
Finally, our reference to regional/area averages discussed in the sections to follow refers to means calculated across the illustrated spatial domain. Specifically, the extent encompasses a 6° latitude (31.25°N–37.25°N) X 7.5° longitude ( − 115°W to − 108.5°W) box.
3. Results
A detailed assessment of WRF's ability to appropriately reproduce the summer climate of semi-arid urban regions within the southwest US demonstrates excellent agreement in the representation of daily to monthly diurnal cycle of near-surface temperatures, and accurate simulation of maximum daytime temperature timing and trend [11]. In addition, we present an evaluation of the seasonally varying near-surface temperature and precipitation representation of the Control WRF simulation in the supplemental section (see also figures S1–S3 available at stacks.iop.org/ERL/7/034026/mmedia). Generally, WRF Control experiments compare well with observationally based gridded product data, and provide confidence in the model's ability to reproduce Arizona's climate during the simulated time period.
3.1. Thermal impacts of Sun Corridor expansion
Figure 2 presents the seasonally varying (spring, summer, fall, and winter) simulated 2 m air temperature difference between the SUNCORR_High and Control experiments. The greatest regionally averaged warming influence due to Sun Corridor expansion occurs during the summer season (1.04 °C), with warming impacts remaining significant during the spring and fall seasons (warming of 0.89 °C and 0.87 °C, respectively). During winter season, warming is primarily constrained to areas undergoing transition to urban land forms, with regionally averaged simulated warming of 0.53 °C. Contrasting the impacts during winter season, urban-induced warming has a spatial sphere of influence extending beyond areas undergoing urbanization, although this characteristic appears most pronounced for the summer and fall seasons as more than two-thirds of the state experience warming in excess of 0.5 °C. In addition, for all seasons except winter, warming over newly urbanized areas exceeds 2 °C, and local maxima for each season range between 3.5 and 4 °C.
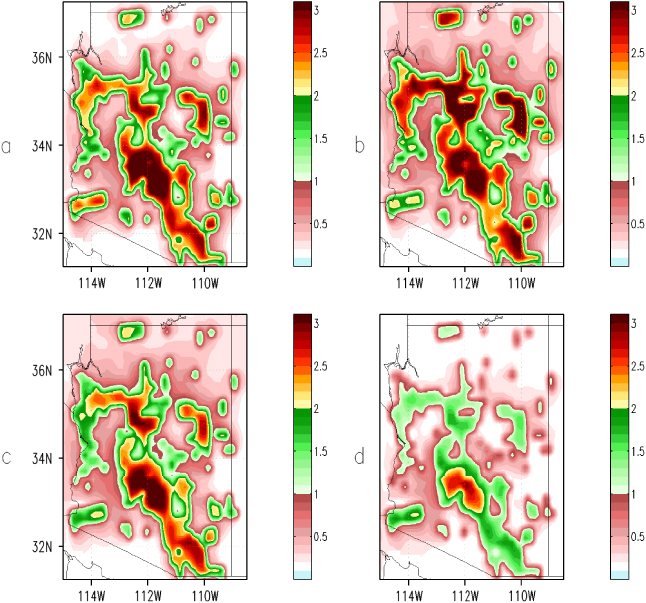
Figure 2. Simulated 2 m air temperature difference (°C) between SUNCORR_High and Control simulations for (a) spring, (b) summer, (c) fall and (d) winter, seasons.
Download figure:
Standard imageIntegration of highly reflective cool roofs within the built environment offsets about half of urban-induced warming, leading to small regional-scale cooling during the winter season (figure 3). Regional-scale warming impacts remain greatest during the summer season (0.27 °C) with maximum local warming reduced by nearly half relative to urban expansion without this adaptation approach (from 3.86 to 2.0 °C). Regional-scale warming during spring (0.06 °C) and fall (0.17 °C) is considerably reduced with cool roof implementation, in agreement with previous research [30–32]. For all seasons (except winter, when cooling is simulated) urban-induced warming remains an entirely local phenomenon, and non-urbanizing locales undergo little or no warming.
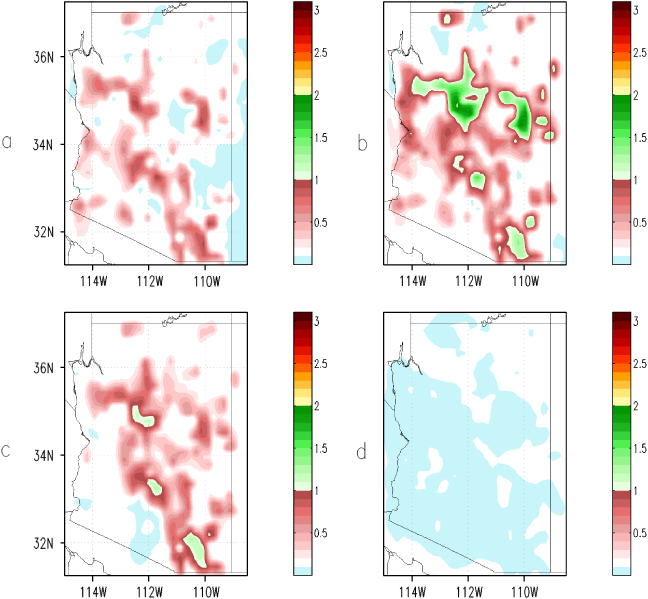
Figure 3. Simulated 2 m air temperature difference (°C) between SUNCORR_Adapt and Control simulations for (a) spring, (b) summer, (c) fall and (d) winter, seasons.
Download figure:
Standard imageConsideration of a lower Sun Corridor expansion scenario (i.e. SUNCORR_Low simulations) reveals regional-scale urban-induced warming less than 0.3 °C for all seasons. Greatest warming occurs during summer (0.28 °C), slight warming during spring (0.14 °C) and fall (0.12 °C), and no change in near-surface temperature is noted during winter (figure 4). As noted in the SUNCORR_Adapt relative to Control simulations (figure 3), urban-induced warming remains a primarily local phenomenon, with non-urbanizing locales experiencing little change in near-surface temperature. Locally greatest warming resulting from expansion to SUNCORR_Low does approach 2 °C during the summer season, but remains less than 1 °C for both the spring and fall.

Figure 4. Simulated 2 m air temperature difference (°C) between SUNCORR_Low and Control simulations for (a) spring, (b) summer, (c) fall and (d) winter, seasons.
Download figure:
Standard image3.2. Hydroclimatic impacts of Sun Corridor expansion
Encroachment of urban infrastructure upon previously permeable surfaces alters the local to regional-scale water balance. Precipitation recycling, an important component to the semi-arid area's total regional precipitation [33], is expected to diminish as falling precipitation previously stored within the soil column is no longer available for evapotranspiration (ET) during subsequent days. To evaluate simulated hydroclimatic impacts owing to Sun Corridor expansion, five-day means of ET were calculated for all experiments (for their duration) in order to remove high-frequency variability. Figure 5 presents the area averaged (i.e. the box bounded by: 31.25°N to 37.25°N and − 115°W to − 108.5°W) ET difference between SUNCORR_High and Control (figure 5(a)), SUNCORR_Low and Control (figure 5(b)), and SUNCORR_Adapt and Control (figure 5(c)). To denote variability of ensemble members, and therefore estimate the degree of simulated uncertainty, the green rectangles depict ±1 standard deviation from the mean differences, and the blue whiskers denote extreme ensemble member difference values.

Figure 5. Simulated evapotranspiration difference (mm day−1) between (a) SUNCORR_High and Control, (b) SUNCORR_Low and Control, (c) SUNCORR_Adapt and Control, for the duration of the simulations. Red line depicts inter-ensemble mean difference after averaging over five-day window to smooth out high-frequency variability. Green rectangle depicts ±1 standard deviation from inter-ensemble mean difference. Blue whiskers represent extreme ensemble member difference values.
Download figure:
Standard imageSun Corridor expansion, for all scenarios, leads to an overall mean reduction in ET that peaks during the summer season (extending into September) but is less pronounced (although still negative) during remaining seasons. For all scenarios, the largest ensemble member variability (i.e., the degree of green rectangle extent about the mean) occurs during the summer season (i.e., during the monsoon season), likely associated with simulated differences in parameterized convective motions and ensuing precipitation. Despite this variability, the overwhelming majority of SUNCORR_High and SUNCORR_Adapt members lead to less ET (relative to the CONTROL member counterpart) for all seasons, including summer, when area-averaged reductions between 0.5 and 1 mm day−1 are predominant. Notably, ET impacts owing to SUNCORR_Adapt expansion appear to be more consistently negative when compared to SUNCORR_High expansion, as only one (SUNCORR_Adapt) ensemble member leads to noticeably positive ET differences (relative to CONTROL) during the entire length of simulated years, in contrast to somewhat greater simulated variability for SUNCORR_High experiments.
Predictably, the reduction in evapotranspired water results in a substantial total precipitation decrease (figure 6), with greatest impacts (relative to CONTROL experiments) occurring for expansion to SUNCORR_High (12% less total precipitation) and SUNCORR_Adapt (16% less total precipitation). Implementation of cool roofs therefore leads to a 4% total accumulated precipitation decrease relative to the non-adaptive expansion scenario. Urbanization-induced precipitation reduction primarily occurs during the monsoon months (figure 7), unlike similar impacts expected from large-scale climate change, which indicate a decrease in mean winter precipitation of approximately 8% over portions of the southwestern US [34]. Progressively greater differences in total precipitation between the urban expansion scenarios and CONTROL experiments occur with the passage of each simulated year, with the least intense urban expansion scenario (SUNCORR_Low) modifying regional precipitation least. Expansion to SUNCORR_High further reduces regional precipitation while the SUNCORR_Adapt simulations result in least simulated total precipitation by the end of the period, highlighting unintended but potentially significant consequences via modification of the regional hydrologic cycle associated with this adaptation approach.
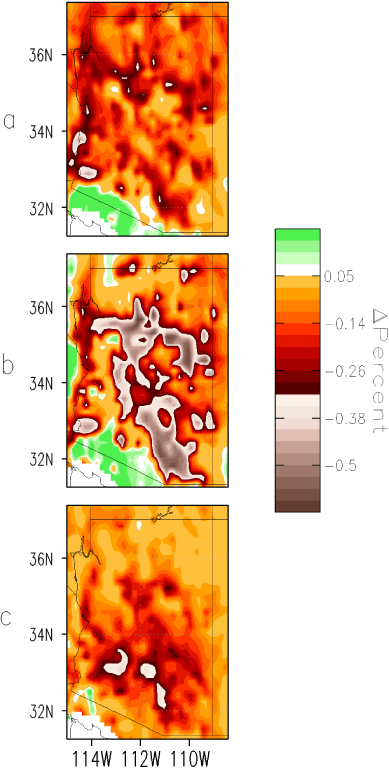
Figure 6. Simulated total precipitation difference, for duration of simulations, normalized by Control precipitation (units are percentages) between (a) SUNCORR_High and Control, (b) SUNCORR_Adapt and Control, and (c) SUNCORR_Low and Control.
Download figure:
Standard image
Figure 7. Simulated accumulated total precipitation (mm) for Control (black contour), SUNCORR_High (red contour), SUNCORR_Low (green contour), and SUNCORR_Adapt (blue contour) simulations.
Download figure:
Standard image4. Discussion and conclusions
This research evaluates hydroclimatic impacts of the fastest growing megapolitan area in the US: Arizona's Sun Corridor. We use scenario-based expansion projections to assess seasonally varying hydroclimatic consequences and account for feedback effects to large-scale climate [35], which are necessary for a more thorough accounting of climate system impacts due to rapidly expanding megapolitan areas.
While we consider our results robust, we recognize the value of a model intercomparison and differing parameterization selection (e.g., incorporation of various convective schemes) that could improve simulated diagnosis of uncertainty quantification. Analysis performed at a range of spatial resolutions [36] to evaluate sensitivity to horizontal and vertical grid spacing [37] on simulated hydroclimatic impacts of Sun Corridor expansion also require attention. Although our approach accounts for a diurnal cycle representation of anthropogenic heating, it neglects additional sources likely to occur from diffusion of heat through walls, roofs and floors, and the consumption of energy due to air conditioning systems and building occupants [38]. These topics are the subject of ongoing research.
Near-surface thermal effects depend on the particular trajectory of Sun Corridor development. For all scenarios, the greatest regionally averaged warming occurs during summer season (regionally averaged warming over AZ exceeds 1 °C for the greatest expansion scenario). Reduced, although still significant warming occurs during spring and fall (regionally averaged warming over AZ approaches 0.9 °C for the greatest expansion scenario), with reduced or no impacts, for all expansion scenarios, during winter. While the metropolitan region has already endured substantial UHI-induced warming due to historical urbanization [39], these results demonstrate that anticipated urban expansion could modulate regional climate in years to come, which may pose additional concerns related to air quality [40, 41] and ecosystem services [42, 43]. In addition, these impacts are layered on top of large-scale climate change owing to increased emissions of greenhouse gases [22], adding further stress to an already sensitive system.
Integration of highly reflective cool roofs within the built environment offsets about half of urban-induced warming, leading to small regional-scale cooling during the winter season. However, impacts on ET appear to be at least as significant as Sun Corridor expansion without this adaptation approach. While ET is reduced throughout the calendar year (chiefly for SUNCORR_High and SUNCORR_Adapt simulations, relative to CONTROL), impacts are greatest during summer, when area-averaged reductions of 0.5–1 mm day−1 dominate. Whereas expansion to SUNCORR_High decreases total precipitation by 12% (relative to CONTROL), implementation of cool roofs (i.e., SUNCORR_Adapt experiments) reduces total precipitation by an additional 4%. The largest share of decreased precipitation occurs over newly urbanizing areas over higher terrain (e.g., located to the north of modern-day metropolitan Phoenix), further decreasing water storage potential over the state's watersheds, which are already expected to see less wintertime precipitation [34].
The combined effects of UHI-induced warming and ET changes act in the same direction and reinforce one another. UHI-induced warming over this semi-arid metropolitan complex is primarily a nighttime phenomenon [11, 39] while the conversion of natural to impermeable surfaces repartitions the surface energy balance toward increased sensible heating. Incorporation of cool roofs act in opposition, via decreased surface-absorbed radiation, but regional precipitation impacts further drive the region's hydroclimate away from its natural state. In this sense, while incorporation of cool roofs does indeed lower mean, near-surface temperature, its overall climate system effect is greater when compared to similar expansion without this adaptation approach. Future development therefore must consider consequences for hydroclimate, in addition to temperature impacts, to comprehensively evaluate optimal mitigation and adaptation strategies focused on sustainable development.
Acknowledgments
We appreciate the critique of two anonymous referees, whose suggestions improved this manuscript. This work was funded by NSF grant ATM-0934592.