
Abstract
Solar radiation management with stratospheric sulfur aerosols has been proposed as a potential geoengineering strategy to reduce global warming. However, there has been very little investigation on the efficiency of specific injection methods suggested. Here, we show that using stratospheric passenger flights to inject sulfate aerosols would not cause significant forcing under realistic injection scenarios: even if all present-day intercontinental flights were lifted above the tropopause, we simulate global surface shortwave radiative forcings of − 0.05 W m−2 and − 0.10 W m−2 with current and five times enhanced fuel sulfur concentrations, respectively. In the highly unlikely scenario that fuel sulfur content is enhanced by a factor of 50 (i.e. ten times the current legal limit) the radiative forcing is − 0.85 W m−2. This is significantly lower than if the same amount of sulfur were injected over the tropics ( − 1.32 W m−2, for 3 Tg (S) yr−1) due to a faster loss rate and lower intensity of solar radiation in the northern midlatitudes where current flight paths are concentrated. We also predict lower global forcing in northern hemisphere winter than in summer due to the seasonalities of the solar radiation intensity at midlatitudes, the related OH chemistry that produces sulfate aerosol, and removal of particles.
Export citation and abstract BibTeX RIS

Content from this work may be used under the terms of the Creative Commons Attribution-NonCommercial-ShareAlike 3.0 licence. Any further distribution of this work must maintain attribution to the author(s) and the title of the work, journal citation and DOI.
1. Introduction
Solar radiation management (SRM) techniques aim to compensate the warming caused by increased greenhouse gas concentrations by increasing the reflectivity of the Earth. Currently the most studied, and probably the most promising, SRM method is injection of sulfur to the stratosphere (Rasch 2008). In the atmosphere, gaseous sulfur reacts to form sulfate aerosols which can reflect incoming shortwave (SW) radiation back to space and thus cool the climate. Because of the stability of the stratosphere and the relatively slow removal mechanisms for submicron aerosol, the lifetime of the sulfate aerosol can be 1–2 yr, while in the troposphere it is only from a few days to a week (Rasch 2008).
The idea of stratospheric sulfur injections goes back to the 1970s, when Budyko (1977) suggested that the emission of sulfur from the jet fuel of a civil aircraft flying in the stratosphere could increase the aerosol concentration and thus cause climate cooling. In theory, intercontinental and other long-distance flights with Concorde-type aircraft capable of operating at stratospheric altitudes could be used for this purpose. Since the 1970s, numerous other injection methods have also been proposed, including military jets, modified artillery, chimneys and high altitude balloons (The Royal Society 2009). While the radiative and climate effects of stratospheric injections have in recent years been studied quite extensively, very few of the previous modelling studies have explicitly addressed the issue of the injection method (Rasch 2008). One exception is Pierce et al (2010), who studied sulfate particle formation in individual plumes of a dedicated carrier aircraft and used their results as an input to a 2D stratospheric aerosol model to calculate the radiative forcing from injections made between 30°S and 30°N latitudes. Several other studies have added sulfur into one model grid cell in the tropics (Niemeier et al 2011, Robock et al 2008, Jones et al 2010), implying a fairly local injection method (e.g., artillery or chimney). Such local methods would release a large amount of sulfur into a relatively small volume of air, which could enhance coagulation and thus lead to larger particles and smaller lifetime of the stratospheric aerosol (Heckendorn et al 2009).
Here, we revisit the idea of Budyko (1977) and investigate the cooling potential of civil aircraft in scenarios in which most long-distance flights are flown in the lower stratosphere and the jet fuel is sulfur-enhanced. One advantage of these scenarios is that the sulfate aerosol would spread over a wide area in the stratosphere, minimizing the coagulation effects predicted for local injection methods. The appeal of this method is that an already existing activity, in this case commercial air traffic, could be used for geoengineering purposes. We study several injection scenarios with the climate–aerosol model ECHAM5.5-HAM2 (Zhang et al 2012), making this one of the few stratospheric geoengineering studies to include an explicit treatment of sulfate aerosol microphysics.
This study is intended as a first-order estimate of the potential cooling that could theoretically be achieved utilizing civil aircraft for stratospheric geoengineering. We acknowledge that there would be several technical, financial and legal issues that would need to be solved before such a scheme could be implemented in reality. These include replacing the current commercial fleet with Concorde-type aircraft that could actually operate in the stratosphere, possible large increases in fuel consumption as flight altitudes and plane types are changed, current legal limitations of fuel sulfur content, and route restrictions for supersonic civil aircraft (currently allowed only over the oceans). There could also be significant effects on stratospheric chemistry and especially on the ozone layer, as the aircraft would also emit large amounts of NOx which is not simulated in our model.
2. Methods
2.1. Model description
In our simulations, we have used MAECHAM5.5-HAM2, the middle atmosphere configuration of aerosol–climate model ECHAM5.5-HAM2 (Stier et al 2005, Zhang et al 2012). MAECHAM5.5 is integrated with a spectral truncation of 63 (T63), which corresponds approximately to a 1.9° × 1.9° horizontal grid, and to 47 vertical levels up to 0.01 hPa. The simulations were performed with a time step of 600 s. The aerosol module HAM2 is coupled interactively to MAECHAM5.5 and includes an explicit modal aerosol scheme M7 (Vignati et al 2004) describing the aerosol number and volume size distributions by a superposition of seven log-normal modes. HAM2 calculates aerosol emissions, removal, gas and liquid phase chemistry, and radiative properties for the major global aerosol compounds of sulfate, sea salt, black carbon, organic carbon and mineral dust. M7 calculates the microphysical processes of nucleation, condensation, coagulation and hydration.
For aircraft emissions, we have used the IPCC AR5 air traffic emissions for years 2000 and 2050 (Lamarque et al 2010). The IPCC AR5 inventory does not include SO2 emissions for air traffic and thus we have used the NO2 mass emissions in the database to calculate the SO2 emissions. This was carried out based on the emission indices from the US Federal Aviation Administration's AEDT/SAGE tool (Kim et al 2007), which gives a global emissions index of 13.8 g kg−1 (fuel) for NO2. For SO2 we have used an emission index of 1.2 g kg−1 (fuel) (Barrett et al 2010). Based on these values, we assumed that for each kilogram of aircraft NO2 emission, 87 g of SO2 was simultaneously emitted.
In addition to air traffic emissions, we have included aerosol emissions from other anthropogenic sources and biomass burning as given in the AEROCOM database for the year 2000 (Dentener et al 2006). For sea spray emissions, we used a parameterization combining the wind-speed-dependent source functions by Monahan et al (1986) and Smith and Harrison (1998) (Schulz et al 2004). For dust emissions, we used the Tegen et al (2002) scheme.
The simulation was carried out with a free running setup and thus the dynamical feedback resulting from the additional heating was taken into account. However, online emissions of, e.g., sea salt and mineral dust are sensitive to wind speed at 10 m height, which can differ significantly between simulations with different aerosol fields. This can occasionally have strong local effects on the forcing. However, the effect is small when comparing the mean values of forcing in simulations of several years.
2.2. Model experiments
Nine simulations were performed in this study. Each simulation was for a five-year period from 2001 to 2005 and was preceded by a two-year spin-up period. The studied scenarios are summarized in table 1.
Table 1. Summary of the model experiments. (Note: the columns list the emission index of sulfur in aircraft fuel (g (S)/kg (fuel)), the total amount of sulfur injected to the stratosphere and amounts injected to the north of 30°N, between 30°N and 30°S and to the south of 30°S. For more details on the different scenarios, see section 2.)
| Scenario | EI(S) (g kg−1) | Stratospheric S injections (Tg yr −1) | Tg (S ) yr −1 > 30 N | Tg (S ) yr −1 tropics | Tg (S ) yr −1 > 30 S |
|---|---|---|---|---|---|
| CTRL | 0.6 | 0.02 | 0.02 | — | — |
| SAT | 0.6 | 0.06 | 0.04 | 0.02 | 0.0008 |
| SAT × 5 | 3.0 | 0.31 | 0.22 | 0.08 | 0.004 |
| SAT × 50 | 30 (/0.6)a | 3.06 | 2.24 | 0.79 | 0.04 |
| SAT × 5 2050 | 3.0 | 0.69 | 0.46 | 0.22 | 0.01 |
| SAT × 5 SO4 | 3.0 | 0.31 | 0.22 | 0.08 | 0.004 |
| EQ3 | — | 3.0 | — | 3.0 | — |
| SAT × 50 H2SO4 | 30 (/0.6)a | 3.06 | 2.24 | 0.79 | 0.04 |
aIn the SAT × 50 and SAT × 50 H2SO4 scenarios emission index 30 is only applied in the stratosphere and index 0.6 in the troposphere.
In the control (CTRL) run, the aircraft emissions were simulated using the flight altitudes from AEROCOM and current fuel sulfur concentration calculated as described in section 2.1. In all the other simulations, all intercontinental flights above oceans as well as the portions of flights above continents which currently take place at altitudes above 10 km were elevated about 2 km above the tropopause and spread into three model levels in the stratosphere. As a result, about half of all current aircraft emissions were emitted to the stratosphere. The SO2 emissions from these elevated flights using year 2000 emissions are shown in figure 1(a). Due to the varying height of the tropopause, the flight altitudes need to be increased much more in the tropics than in the mid and high latitudes (figure 1(b)).
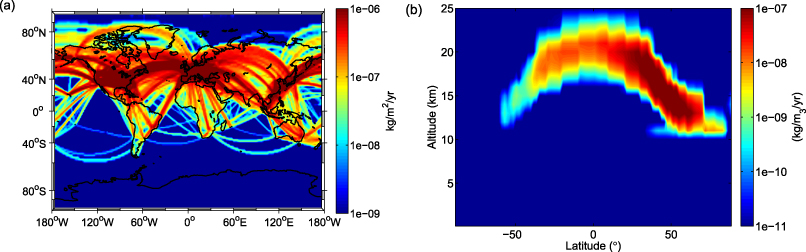
Figure 1. Column-integrated total (a) and zonal mean (b) of stratospheric SO2 emissions in the SAT scenario.
Download figure:
Standard imageThe geoengineering simulation SAT had the same flight routes and total SO2 emissions as the CTRL simulation, except that some of the flights were elevated to the stratosphere as described above. Scenarios SAT × 5 and SAT × 50 were as SAT, except that the current fuel sulfur content was enhanced by factors of 5 and 50, which led to injected sulfur masses of 0.3 Tg yr−1 and 3.0 Tg yr−1, respectively (table 1). Note that the SAT × 5 scenario corresponds to the current legal limit for aircraft fuel sulfur concentration of 3 g (S)/kg (fuel) (IPCC 1999), and thus scenario SAT × 50 exceeds this limit by a factor of ten. Technically, if a 50-fold sulfur enhancement were used, the aeroplanes would probably need two separate fuel tanks: one for fuel with the current sulfur concentration to be used in lower altitudes where air pollution is an issue, and another for sulfur-enhanced fuel to be used in the stratosphere. This was taken into account in this scenario and enhanced fuel sulfur concentration was only used in the stratosphere. We assume here that the aircraft engines can be designed to sustain the increased fuel sulfur content.
The effect of future changes in air traffic volume and flight paths was investigated with scenario SAT × 5 2050, which assumes the same fuel sulfur content as SAT × 5 but uses projected flight paths for the year 2050 from the Representation Concentration Pathways scenario 8.5 (RCP8.5) of IPCC AR5. These flight paths are also elevated to be flown in the stratosphere. RCP8.5 can be viewed as the no-climate-policy scenario in which anthropogenic CO2 emissions increase so that the warming effect of CO2 is 8.5 W m−2 at the end of this century. Note that while the original RCP scenarios assume that the fuel sulfur concentration will decrease significantly in the future because of regulation, in our simulation investigating the geoengineering potential of civil aircraft we have used five times the current fuel sulfur concentration. The climate conditions and emissions other than from the air traffic were the same as in the other scenarios.
In all the simulations mentioned above, sulfur is emitted as SO2. However, since the global climate model resolution is quite poor, we are not able to capture the high SO2 concentrations in the aircraft plumes and thus are likely to underestimate particle formation in aircraft exhaust fumes and immediately after the emissions. Therefore, to test the sensitivity of our results, we repeated the scenario SAT × 5 assuming that 5% of sulfur emissions are emitted as primary sulfate particles with a geometric mean diameter of 50 nm (simulation SAT × 5 SO4).
Simulation EQ3 was included as a reference case. In this model run, no stratospheric flights were simulated but instead 3 Tg yr−1 of sulfur was injected uniformly over the area between latitudes 20°S and 20°N at an altitude of 19–21 km. This scenario was chosen since earlier studies have shown that stratospheric sulfur injections in the tropics are the most effective in terms of geoengineering (Robock et al 2008). Comparing the radiative forcings caused by stratospheric emissions from aircraft and emissions over the tropics allows us to evaluate the effectiveness of injection from air traffic.
Finally, we repeated simulation SAT × 50 assuming that the sulfur is injected in the form of H2SO4 instead of SO2 to estimate the effect of how the form of emitted sulfur affects the forcings. It has to be noted that in our simulation H2SO4 is assumed to be evenly distributed within the model grid box while, in reality, gaseous H2SO4 would transform to particle phase very localized in aircraft plumes. Thus, this assumption of well-mixed H2SO4 in the grid box cannot be considered completely physical and the simulation is not directly comparable with Pierce et al (2010).
One limitation in the simulations described above is that we are restricted to the flight paths and total emissions of the current aircraft fleet, which are very likely not fully representative of large-scale flight operations in the stratosphere. However, more accurate estimates for the type of scenarios we are studying are currently not available. With this in mind, our results should be taken as a first-order estimate of the potential cooling from geoengineering with stratospheric civil aircraft.
3. Results
Table 2 shows the change in the global mean clear-sky and all-sky shortwave (SW) radiative forcing at the surface between the injection scenarios and the CTRL run. In all cases radiative forcing is smaller in the all-sky than in the clear-sky case because globally clouds contribute about 2/3 of the planetary albedo.
Table 2. Clear-sky and all-sky radiative forcing at the surface and stratospheric sulfur burden of each studied scenario.
| Scenario | SW clear-sky radiative forcing (W m−2) | SW all-sky radiative forcing (W m −2) | Stratospheric sulfur burden (Tg (S)) |
|---|---|---|---|
| SAT | −0.07 | −0.05 | 0.04 |
| SAT × 5 | −0.19 | −0.10 | 0.19 |
| SAT × 50 | −1.43 | −0.85 | 1.63 |
| SAT × 5 2050 | −0.58 | −0.38 | 0.44 |
| SAT × 5 SO4 | −0.21 | −0.12 | 0.20 |
| EQ3 | −2.15 | −1.32 | 2.40 |
| SAT × 50 H2SO4 | −1.88 | −1.13 | 1.59 |
As table 2 shows, stratospheric flights without enhancement of fuel sulfur content (simulation SAT) would have an insignificant effect on the radiative forcing ( − 0.05 W m−2). Because of this, simply operating current intercontinental civil flights in the stratosphere would likely cause negligible climate cooling. From the point of view of geoengineering, the fuel sulfur content would need to be enhanced considerably. Even if the current legal limit for aircraft fuel sulfur concentration (simulation SAT × 5) is used, the all-sky radiative forcing at the surface is only − 0.10 W m−2. However, by using 50 times the current sulfur concentration in aircraft fuel (simulation SAT × 50), it could be possible to considerably increase the radiative forcing of aircraft emissions. In this case, the global change in all-sky radiative forcing at the surface is − 0.85 W m−2, which is slightly less than one quarter of the positive forcing from doubling of CO2 (3.7 W m−2). However, we consider such a high enhancement of fuel sulfur content very unlikely.
The lifetime of stratospheric sulfur is smaller in the SAT × 50 case than in the SAT × 5 case (0.53 yr and 0.68 yr, respectively), since with larger sulfur injections the stratospheric particles grow faster which increases sedimentation (Robock et al 2008). This effect is also evident from the sub-linearity of the clear-sky forcing as a function of injected sulfur mass (table 2). The apparent super-linearity of all-sky forcing is caused by small differences in modelled meteorology between the simulations which have a relatively large effect in the low sulfur scenarios.
If 5% of fuel sulfur is emitted as primary SO4 particles (run SAT × 5 SO4), the predicted aerosol radiative forcing is almost equal to the case where all sulfur is emitted as SO2 (run SAT × 5) (table 2). In the beginning of the two-year model spin-up, simulation SAT × 5 SO4 shows more particles in the accumulation mode but this difference disappears before the end of the spin-up. There is no considerable difference in stratospheric sulfur burden between scenarios SAT × 5 and SAT × 5 SO4. Given that the timescale of SO2 oxidation in the stratosphere is 30–40 days (McKeen and Liu 1984, Rasch 2008) and thus emitting 5% of sulfur as primary particles can be seen as a reasonable upper limit estimate of sub-grid particle formation, simulation SAT × 5 SO4 indicates that our results are not highly sensitive to the treatment of sub-grid processes when sulfur is assumed emitted as SO2.
The predicted radiative forcing increases notably if we use estimated air traffic volumes for year 2050 instead of year 2000 (scenario SAT × 5 2050). In this case, the global radiative forcing at the surface is − 0.38 W m−2, which is almost four times larger than the forcing in SAT × 5 (table 2). The change in the total amount of injected stratospheric sulfur by a factor of 2.25 explains this increase only partly. Figure 2 reveals that the zonal mean all-sky radiative forcing at the surface is clearly higher at all latitude bands in SAT × 5 2050 compared to SAT × 5. However, the difference is largest in the tropics roughly between latitudes 30 °S and 30 °N. Table 1 shows that the amount of sulfur injected between these latitudes is almost three times larger in simulation SAT × 5 2050 than in SAT × 5. The low latitudes receive more sunlight than the mid or high latitudes, and thus the same amount of injected sulfur has a higher geoengineering effectiveness. In addition, the lifetime of stratospheric sulfate in scenario SAT × 5 2050 is almost equal to that in scenario SAT × 5 (0.65 yr and 0.68 yr, respectively), even though in the former scenario the amount of injected sulfur is twice as large as in the latter. This is because aerosol removal in the low latitudes is much slower than in the mid and high latitudes and particles in the low latitudes transport first poleward before being removed from the stratosphere.

Figure 2. The 5 yr zonal means of all-sky shortwave radiative forcing for the geoengineering scenarios. The fluctuation in the curves in the figure especially between 10°N and 50°N is mostly due to the slightly different meteorology in each simulation.
Download figure:
Standard imageThe importance of the spatial distribution of the injections is also clearly seen if we compare scenarios SAT × 50 and EQ3, where a total of 3 Tg (S) yr−1 is injected to the stratosphere in both cases. The global radiative forcing is 55% larger when sulfur is injected to the tropics than when it is injected using the current flight paths predominantly in the northern midlatitudes (table 2). Figure 2 shows that, while the zonal forcings in the two scenarios are comparable in the northern mid to high latitudes, there is a large difference in favour of the EQ3 scenario in the tropics and southern midlatitudes. In scenario EQ3, the sulfur is spread more homogeneously over the globe and the lifetime of sulfate particles is longer since it takes more time for the sulfate to be transported to the mid latitudes and poles where particle deposition is faster (Hamill et al 1997). As a consequence, the global stratospheric sulfur burden is about 40% larger in EQ3 than in SAT × 50 (table 2). Local SO2 concentrations are also different between the scenarios, but we expect that this will not have a significant effect on the results based on previous studies which compared the same SO2 injection to one or multiple grid cells along the equator (Niemeier et al 2011).
For comparison, in SAT × 50 H2SO4 we injected sulfur as H2SO4 instead of SO2. Geoengineering using H2SO4 injections can be anticipated to cause more cooling since it would result in higher local H2SO4 concentration and favour nucleation over condensation. This in turn leads overall to smaller particles and less effective coagulation (Pierce et al 2010, Niemeier et al 2011). The use of H2SO4 injections increases the all-sky radiative forcing at the surface to − 1.13 W m−2, but as we see from figure 2 the enhanced forcing takes place only in the northern hemisphere and in the south the radiative forcing is similar to the case where sulfur is injected as SO2 (SAT × 50). This is because the local H2SO4 concentrations are the highest in the busiest flight routes in the northern hemisphere. In the southern hemisphere, there is clearly less flight traffic and, because of this, the local concentrations of injected sulfuric acid are so small that fast nucleation in the plume does not occur. It should be noted, however, that our model does not take account of the sub-grid particle formation in the aircraft plume, and thus our simulation with H2SO4 injections probably underestimates the radiative forcing to some extent.
Figure 3 depicts the seasonal variation of the zonal mean radiative forcing for the SAT × 50 scenario. There is a strong seasonal cycle in the northern mid and high latitudes with a peak forcing in summer months. Reflecting sulfate particles have concentrated to the northern mid and high latitudes and in summer time more sunlight is directed to and thus can be reflected from these latitudes. There is also some seasonal variation in SO2 stratospheric burden (from 0.44 Tg in July to 0.65 Tg in January) due to higher summer-time concentrations of OH, which is the main oxidant of atmospheric SO2. This means that the oxidation rate of SO2 in the northern hemisphere is much stronger in summer than in winter. This, together with possible seasonal changes in deposition and dynamics, leads to small seasonal variation in the global stratospheric burden of sulfate particles (1.30 Tg in June–July–August and 1.12 Tg in December–January–February), which makes the seasonal variation of the radiative forcing even stronger. The respective roles of the seasonal changes in OH, deposition and dynamics are difficult to quantify from our simulations. However, a further sensitivity simulation (not shown) using the same injections as in SAT × 50 but fixing the OH concentration to summer-time values approximately halves the seasonal variation in sulfate burden compared to SAT × 50, and thus indicates that several of these factors play an important role. Overall, the global all-sky radiative forcing in northern hemisphere summer (June–July–August) is − 1.07 W m−2 while in winter (December–January–February) it is − 0.79 W m−2 in scenario SAT × 50.

Figure 3. The seasonal variation of the zonal mean shortwave radiative forcing at the surface for the SAT × 50 scenario. Positive values of radiative forcing are from dust which results from different meteorology in the CTRL and SAT × 50 scenarios. Because of this, there is also sometimes large negative forcing between 0° and 20° latitudes.
Download figure:
Standard imageFigure 4 shows the geographical distribution of the all-sky forcing for scenario SAT × 50. Since current air traffic is highly concentrated in the northern hemisphere, the forcing is much larger in the northern ( − 1.1 W m−2) than in the southern hemisphere ( − 0.60 W m−2). Since the Brewer–Dobson circulation preferentially transports air from the equator to the poles, particles released in the northern hemisphere do not spread efficiently to the southern hemisphere. If we look in detail at some specific areas, we see that this geoengineering scenario has a large effect on the radiative forcing in Europe ( − 1.45 W m−2), North America ( − 1.33 W m−2) and Northern Asia ( − 1.50 W m−2), but a much smaller effect in Africa ( − 0.68 W m−2), South America ( − 0.65 W m−2), Australia ( − 0.56 W m−2) and in India and Southeast Asia ( − 0.49 W m−2) (region boundaries shown in figure 4). Note that the positive forcing over and west of the Sahara is caused by a difference in dust emissions between the CTRL and SAT × 50 simulations and is due to slightly different meteorologies.
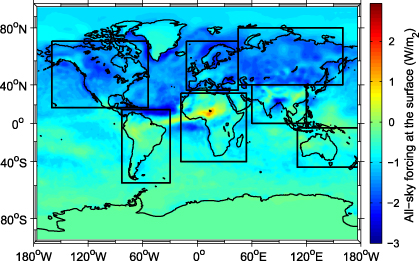
Figure 4. The 5 yr mean of all-sky radiative forcing at the surface in scenario SAT × 50. The black squares indicate the seven regions for which radiative forcings are calculated separately (see text).
Download figure:
Standard image4. Discussion
It is interesting to compare our figure 4 with (b) in Ricke et al (2010). They studied changes in regional climates using the SRES A1B scenario for the main anthropogenic forcers and defined the 'optimal' level of globally used geoengineering as the level that in the 2070s would bring each studied region's climate back to closest to its 1990s state. They found that Europe, North America and Northern Asia would benefit from strong solar radiation management, while a much lower intensity would be more optimal for India, Africa and South America. They also suggested that non-uniform forcing could be used to produce a desirable regional temperature and precipitation effect. Using the method presented here, the forcings from our SAT × 50 scenario are directed to areas which would benefit from stronger geoengineering according to Ricke et al (2010). However, it is not entirely straightforward to estimate the climate effects from radiative forcing alone and further climate model studies would be needed to test the effects of non-uniform forcings.
The uneven geographical distribution of radiative forcing resulting from our scenarios could also have some other important climate consequences. The simulations imply a relatively large forcing in the northern high latitudes, where it could prevent melting of glaciers and Arctic sea ice, or release of methane from Siberia (MacCracken 2009, Westbrook et al 2009). Thus this geoengineering method could potentially reduce these climate feedbacks that would accelerate global warming. One undesirable effect which cannot be studied by our model is the depletion of stratospheric ozone which is predicted to result from stratospheric sulfur geoengineering (Heckendorn et al 2009). It is probable that this geoengineering method would cause a significant depletion in the ozone layer especially in the North Pole, where ozone depletion is a problem already.
Large enhancements in fuel sulfur content could have implications on jet engine safety as well as on planes flying in air with high sulfate aerosol concentration. However, if these challenges could be overcome, one potential advantage of using commercial aircraft for geoengineering is that it could probably be implemented relatively rapidly should the need arise as a consequence of a threat of an abrupt climate change in northern high latitudes, where commercial air traffic already flies in the stratosphere. Expanding this kind of geoengineering also to the low latitudes would cause several technical and financial challenges since one would need to reach altitudes close to 20 km. In order to obtain notable climate cooling, a significant part of global aviation traffic would have to be reorganized to serve the goal of geoengineering. Such large-scale operation in the stratosphere would require replacement of the current aircraft fleet and major changes in current flight paths to emit a sufficient amount of sulfur to stratospheric altitudes.
5. Conclusions
Our results indicate that merely elevating a large fraction of civil air traffic into the stratosphere would have a negligible radiative effect, and that in order to exploit air traffic for geoengineering, the jet fuel sulfur content would need to be increased substantially. Even if this were done, the current as well as predicted future flight paths would lead to a geographically very uneven forcing that concentrated on northern mid and high latitudes, which are not optimal for geoengineering in terms of the amount of received sunlight, conversion rate of sulfur to sulfate particles or aerosol lifetime. If a globally more uniform forcing or a forcing sufficient to counteract, e.g., doubling of CO2 concentration were desired, some other sulfur injection method would be needed. Special aircraft dedicated to the geoengineering purpose could give more control to produce a more favourable spatial and temporal distribution of sulfur injections and thus be a much cheaper and more effective geoengineering method than using stratospheric civil flights.
Acknowledgments
This work was supported by the Academy of Finland's Research Programme on Climate Change (FICCA) (project 140867), Maj and Tor Nessling foundation (grant 2012116), and Academy of Finland's Academy Research Fellow position (decision 250348). The authors wish to thank T Bergman, U Niemeier, S Ferrachat and U Lohmann for technical assistance with the ECHAM model. The ECHAM–HAMMOZ model is developed by a consortium composed of ETHZ, Max Planck Institut für Meteorologie, Forschungszentrum Jülich, University of Oxford and the Finnish Meteorological Institute and managed by the Center for Climate Systems Modeling (C2SM) at ETHZ.