

Abstract
The global distribution of food production is unequal relative to the distribution of human populations. International trade can increase or decrease inequality in food availability, but little is known about how specific countries and commodities contribute to this redistribution. We present a method based on the Gini coefficient for evaluating the contributions of country and commodity specific trade to inequality in the global food system. We applied the method to global food production and trade data for the years 1986–2011 to identify the specific countries and commodities that contribute to increasing and decreasing inequality in global food availability relative to food production. Overall, international trade reduced inequality in food availability by 25%–33% relative to the distribution of food production, depending on the year. Across all years, about 58% of the total trade links acted to reduce inequality with ∼4% of the links providing 95% of the reduction in inequality. Exports from United States of America, Malaysia, Argentina, and Canada are particularly important in decreasing inequality. Specific commodities that reduce inequality when traded include cereals and vegetables. Some trade connections contribute to increasing inequality, but this effect is mostly concentrated within a small number of commodities including fruits, stimulants, and nuts. In terms of specific countries, exports from Slovenia, Oman, Singapore, and Germany act to increase overall inequality. Collectively, our analysis and results represent an opportunity for building an enhanced understanding of global-scale patterns in food availability.
Export citation and abstract BibTeX RIS

Original content from this work may be used under the terms of the Creative Commons Attribution 3.0 licence. Any further distribution of this work must maintain attribution to the author(s) and the title of the work, journal citation and DOI.
1. Introduction
Globally, about 1 billion people lack sufficient dietary energy availability (Barrett 2010, Godfray et al 2010). Additionally, about 1.3 billion people are obese or overweight, indicating an over-utilization of food relative to physiological needs (Prentice and Jebb 1995, Kelly et al 2008). This contrast demonstrates the existence of substantial inequalities in the availability, access, and utilization of food. The origins of this inequality exist at two scales: international and intranational. At the international scale inequality in food availability is mainly a result of the distribution of Earth's land and water resources relative to the distribution of human populations (Kummu and Varis 2011, Seekell et al 2011, Carr et al 2012, Carr et al 2015). This inequality can be enhanced or redressed by human action such as international migration or international trade (Reuveny 2007, Carr et al 2012, 2015, Davis et al 2013, Fader et al 2013, MacDonald et al 2015). At the intra-national scale, inequality in access to food is influenced by patterns of poverty, conflict, and the accessibility of distribution networks (Misselhorn 2005, Barrett 2010). Inequality in utilization is further determined through community, household, and individual-level factors such as local food preferences, lifestyle characteristics, and within-household food distribution patterns (Prentice and Jebb 1995, Barrett 2010). Identifying the factors contributing to inequality at both the international (food availability) and intranational (food access and utilization) scales is necessary to understanding broader patterns of variability in the global food system.
National-scale food production and the percentage of food production that is traded internationally have increased significantly in recent years (Fader et al 2013, Porkka et al 2013, D'Odorico et al 2014, Davis et al 2015). The increase in production resulted from the adoption of modern technology, but also agricultural expansion (Foley et al 2011). The increase in trade was likely induced by a variety of factors, including new trade policies, agricultural surpluses in major producing regions (e.g., North America), and the increasing global demand for food products due to population growth, and changes in diet (Narula 2010, Porkka et al 2013). The intensification of trade implied not only an increase in the amount of food traded but also changes in the structure of the trade network such that countries have become increasingly connected (Porkka et al 2013, D'Odorico et al 2014, Gephart and Pace 2015). Presently, in some countries, food consumption exceeds production such that they are dependent on international trade to balance their food needs (Fader et al 2013, MacDonald 2013, Porkka et al 2013, D'Odorico et al 2014). In these countries, the increasing dependence on trade has altered the extent to which local crop failures and food prices can influence regional or global food security (Puma et al 2015, Suweis et al 2015, d'Amour et al 2016, Gephart et al 2016, Marchand et al 2016). Collectively, these results suggest dramatic changes in global patterns of food production and trade with important impacts in the global distribution of food availability.
Food export from countries with high caloric production per capita to countries with low production may reduce inequality, but transfers in the opposite direction may increase inequality (Seekell et al 2011, Carr et al 2012). Exports occur in both directions and depend on both absolute and relative production advantages. Further, it may be beneficial in the long run to trade in a manner that increases inequality in food availability in order to stimulate local growth, intensify production potential, and eventually escape from the threat of hunger (Timmer 2000). This complexity is not reflected in aggregate measures of inequality and this limits the ability of aggregate measures to provide actionable information relative to inequality in the global food system (Palmer 2012). In this paper we investigate how international trade reallocates food availability relative to the distribution of food production. We develop an approach for assessing how individual countries and commodities increase or decrease inequality in global food availability and provide preliminary results based on an analysis of international trade networks for the years 1986–2011.
2. Methods
2.1. Summary of analytical approach
We reconstructed the global food trade network based international food production and trade records. Within a network analysis framework, each node is a country with food production and consumption and each link is food trade between countries. We examine this network in terms of dietary energy (calories) rather than tonnage. We evaluated how each node and link contribute to overall inequality in food availability based on changes in the Gini coefficient when links were iteratively added and removed from the global trade network. The Gini coefficient is a widely used metric of inequality that ranges from 0 to 1, where higher values indicate more inequality (Gini 1936). We use this analytical framework to ask three questions:
- (1)What countries contribute most to increasing and decreasing inequality in the global food system?
- (2)What commodities contribute most to increasing and decreasing inequality in the global food system?
- (3)For the commodities contributing most to increasing and decreasing inequality in the global food system, which countries contribute most to inequality through these commodities?
2.2. Detailed methods for reconstructing global trade networks
We reconstructed the global food trade network for the years 1986–2011 based on production and bilateral trade records from the Food and Agricultural Organization (FAO) of the United Nation's FAOSTAT database (http://faostat.fao.org/). For each commodity m and year y a trade matrix Nm(y) was generated where the i, j element of the matrix is the total export tonnage of the commodity m from country i to country j. We created these matrices for 390 commodities in the FAOSTAT database that are used for human consumption. Tonnages for the commodities were converted to kilocalorie equivalents using conversions from the FAO Nutritive Factors Database (D'Odorico et al 2014, SI table 1). Hence, the results of our analysis represent inequality in dietary energy availability. While animal products were included in this study, live animals were not considered because we could not convert the carcass weight to calories available for human consumption without detailed information on the age demographics of the animals which are not available in FAOSTAT. Fish and fish products were also not considered as detailed bilateral trade data is unavailable in a format consistent with FAOSTAT (e.g. Gephart and Pace 2015).
For our network analysis, we used production data for 159 primary commodities, but trade links were created for all 390 commodities (see supplemental information for lists of commodities). This approach limits the potential for double counting dietary energy production (D'Odorico et al 2014, Carr et al 2015). For example, beef is a secondary commodity produced in part by feeding maize to cows. Counting the energy content of both cows (secondary products) and maize (primary products) would overestimate the dietary energy availability for humans. By basing production on primary commodities only, we minimize the potential for double counting while still accounting for the fact that international trade of secondary products is an important aspect of redistributing dietary energy availability at the global scale. However, we do not account for reexportation as such methods come with assumptions which can be difficult to ascertain for all secondary products (Kastner et al 2011).
We included countries with populations greater than 1 million during the period 1986–2011 in our analysis based on population records in the FAOSTAT database. National boundaries changed during the record including the reunification of Germany and the dissolution of the Union of Soviet Socialist Republics. To develop a consistent trade network, we retained the more aggregated configuration of these countries throughout the analysis (Carr et al 2013, D'Odorico et al 2014).
2.3. Network analysis
Given two vectors V1,y and V2,y for year y and where the subscripts 1, 2, denote a given quantity of interest for all n network nodes, a metric describing the inequality in the distributions such as the Gini coefficient (G), can be calculated. A common example is when V1,y is income and V2,y household size, then the inequality metric describes the inequality in income among households (Deininger and Squire 1996). In this study V1,y is dietary energy availability of different countries (in kilocalories) and V2,y is the population of those countries and the inequality metric describes the inequality in mean dietary energy availability among countries.
In this study we use the Gini coefficient to quantify inequality. Given  and
and  the adjusted Gini coefficient is calculated as (Kendall and Stuart 1958):

The contribution of an individual node (country) i  can be calculated as

This calculation of an individual node's contribution to inequality is complicated if there is international trade because a portion of inequality contributed by node j (increased or decreased inequality) should be attributed to node i. We can account for this using the trade matrix N1,y, described in section 2.2, to acquire a new distribution of resources V'1,y and calculate a new Gini coefficient G'. Following equation (1), let  then
then  The individual contribution of link ij to inequality can then be estimated by,

where  is the Gini coefficient after removing link Nij,y from the network and recalculating G'. Similarly,
  is the Gini adding only link Nij,y to the network and recalculating Gy. In other words,
  considers a world where there is only one trade link, link ij, and
  considers a world with all trade links present except link ij. In this manner a positive or negative effect,
  on inequality can be estimated for all links ij in N1,y. It is important to note that
  is only an estimate, with
  .
.
This impact of link ij on the Gini coefficient of all nodes k can be calculated as:

It is important to note that the directed link Nij,y is thus transformed into a vector of impacts (positive and negative) on all nodes. We can then group these individual impacts by node,  the impact to one's self by exporting

and the impact to the other nodes in the network or

and the ratio of  to
to  in order to examine the behavior of nodes. Lastly, this analysis can be further dissected by commodity trade, thus instead of link ij, the analysis is done on link ijm, where m is the commodity in question. Similarly, these individual commodities can be recombined into FAO groups, to examine the impact of various commodity groupings (e.g., cereals). We stress that the calculation of the Gini coefficient expressed by the above equations takes population into account in the initial ratios xi and
  . As such, a smallF transfer between two populous countries can have little impact on the Gini coefficient, whereas the same transfer to, or from, a less populous country can have greater impact on the Gini coefficient.
3. Results
3.1. Overall inequality in dietary energy availability
Overall inequality in dietary energy production (measured by Gy) has increased from 1986 to 2011 (0.44 increasing to 0.48). Redistribution of dietary energy availability through international trade reduces inequality by about 25%–33% relative to the distribution of production, depending on the year (i.e.  ). Basic results from our analysis are visualized in figure 1, in which the ordinate is the contribution of individual trade links to the Gini and the abscissa is the number of links ordered from lowest (negative, trade link decreases inequality) to highest (positive, trade link increases inequality) contribution to inequality. The number of trade links increased over time (see also table 1), illustrated by the wider spread of data on the abscissa, consistent with previous analyses of the global food trade network (e.g. D'Odorico et al 2014). The vast majority of international trade links have little or no impact on the total inequality in global food availability, and only a small percentage of links provide almost all of the increases and decreases in inequality. This is illustrated by the broad bottom of the curves where most links reside with little or no contribution to the Gini coefficient (figure 1).
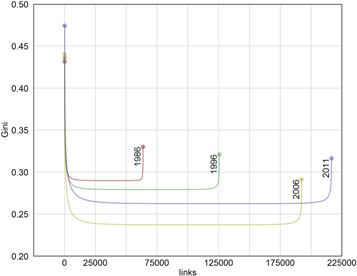
Figure 1. Inequality, as the estimated impacts of links (sorted) are added to the inequality extant from production alone for the years 1986, 1996, 2006 and 2011. Note that the majority of links have little impact on inequality, a few links reduce inequality and a smaller subset act to increase inequality.
Download figure:
Standard image High-resolution imageTable 1. The Gini coefficient prior to and after trade, the change in the Gini from the two perspectives and the estimated change resulting from averaging the two perspectives along with the error in the estimate. Number of links for each year in the multigraph network, what fraction of those links act to decrease inequality, the total reduction that fraction provides, and the increase due to the remaining links.
| 1986 | 1996 | 2006 | 2011 | |
|---|---|---|---|---|
Production 
|
0.4415 | 0.4381 | 0.4423 | 0.4768 |
After trade 
|
0.3319 | 0.3302 | 0.2987 | 0.3211 |
Change 
|
−0.1096 | −0.1079 | −0.1436 | −0.1557 |

|
−0.1662 | −0.1868 | −0.2721 | −0.2428 |

|
−0.0569 | −0.0476 | −0.0300 | −0.0780 |
Estimate 
|
−0.1115 | −0.1172 | −0.1512 | −0.1604 |
| % error | 1.2 | 8.6 | 5.2 | 2.9 |
| Max reduction | −0.152 | −0.159 | −0.205 | −0.214 |
| Max increase | 0.040 | 0.042 | 0.054 | 0.054 |
| # links | 636 32 | 125 520 | 192 302 | 216 537 |
| % of links reducing | 63.6% | 58.3% | 58.6% | 58.6% |
Plotting the Gini as a function of cumulative calories transferred reveals that most of the trade links which have little to no impact on inequality are associated with very small transfers as indicated by the distinct minima in the curves (figure 2). From this calorie based perspective, links which cause small changes in inequality from large transfers appear as horizontal jumps in the curves and correspondingly links which cause larger changes in inequality from small transfers appear as vertical jumps. It is interesting to note that some of the links which have largest impacts on inequality, both positive and negative, are associated with smaller transfers.

Figure 2. Inequality, as the ordered estimated impacts of links are added to the inequality extant from production alone and the associated cumulative calorie transfers for the years 1986, 1996, 2006 and 2011. Note that horizontal jumps are links with large calorie transfers and vertical jumps are associated with the small calorie transfers.
Download figure:
Standard image High-resolution imageAcross all years, about 58% of the total trade links act to reduce inequality and these trade links are associated with roughly three quarters of the calorie transfers. These decreases in inequality and transfers remain concentrated, with ∼4% of the links providing 95% of the reduction in inequality and ∼70% calorie transfers for all years. The percentage of links providing 95% of the increases in inequality rose from 2.6% in 1986 to 4.1% in 2011, but was still consistently ∼24% calorie transfers across all years, indicating a similar level of concentration.
3.2. Impact of individual trade links and countries on overall inequality
In 1986, 63 632 individual commodity trade links generated 8399 424 distinct increases and decreases in inequality. In 2011, 216 537 individual commodity trade links generated 32 913 624 distinct increases and decreases in inequality. One way to think of these impacts on inequality is as a matrix, M, that has a number of rows, r equal to the number of individual trade links, and number of columns, c, equal to the total nodes in the network. Each entry in Mrc is the the impact of link r = ijm (i.e., the trade link of commodity m between nodes i and j) on country c. Summing across the rows of M provides the total impact of each individual commodity link (table 2, shown in figure 3). Summing down the columns of M (or impacts on each individual country from each trade link) estimates the contribution to the change in inequality that a country exerts by merely participating in global trade (figure 3). This is a measure of both direct participation (impacts generated via a country's own import and export choices) and indirect participation (impacts generated by other country's trade).
Table 2. Top ten nodes that increase (red) or reduce (blue) inequality in 2011 via their export links, their impact to their own contribution to inequality, the impact to the other nodes contribution, ratio of a nodes impact to itself to its global impact, and the percent of the total change that node via exports is responsible for.
|
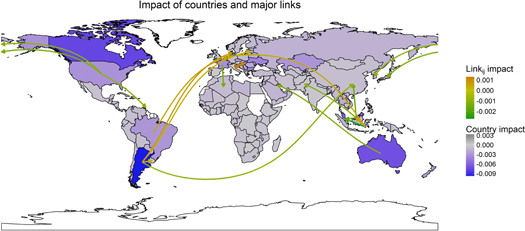
Figure 3. Countries colored by their total contribution (impact) to the change in inequality by being present in the trade network, and the top 10 links which increase inequality and top 10 links that decrease inequality for the year 2011.
Download figure:
Standard image High-resolution imageExamining the impact a country's exports or imports have on inequality provides a means for exploring the direct, or controllable contributions of a country to inequality (figure 4). This is different than the combined direct and indirect effects reported in figure 3 (SI table 2), as this only considers the impacts generated by the trade links in which a country is participating. Major changes due to export impacts remain concentrated to the few countries with large exports such as the United States of America, with some countries not exporting at all (whited out countries). In contrast almost all countries participate in importation, and thus, the impacts from importation are less concentrated to a few countries. In 2011, across all commodities, Slovenia, Singapore, Oman, Germany and the United Kingdom are the major contributors to increasing inequality via their exports, while the United States, Malaysia, Argentina and Canada are the major contributors to reducing inequality relative to patterns of production (table 2, figure 4). The export of Cake of Soybeans, Soybeans, Maize, Refined Sugar, and Fresh Whole Cow Milk, from Slovenia, alone account for 8.8% of the global increase in inequality via trade for 2011. In contrast exports from the United States of America account for 12% of the decrease in inequality in 2011 (tables 1 and 2).

Figure 4. The direct contribution (e.g. impact) of a country's exports and imports for 2011. Not all countries participate in exportation whereas most countries participate in importation of food commodities. As such, export impacts tend to be concentrated, whereas importation impacts are more spread out globally.
Download figure:
Standard image High-resolution image
3.3. Commodities that increase or decrease inequality
The top ten commodity transfers that increase and decrease inequality are comprised of only a handful of commodities: Palm oil, Soybeans, Cake of soybeans, Wheat, Maize and Barley (table 3). However, summing the impact of all transfers for each commodity reveals that the top commodities whose trade leads to increased inequality are Cocoa beans, Bananas, Molasses, Coconut (copra) oil and Groundnuts (Shelled). The top commodities whose transfers overall reduce inequality are Sugar (Refined), Rice (Milled), Palm oil, Maize and Wheat (tables 4, SI table 3). While individual links and commodities can be examined, the combined impact of a primary product and its secondary products should be also considered. For example, transfers of Cocoa beans increases the Gini coefficient in the system by 0.00066, trade of Chocolate (Prsns) reduces the Gini coefficient by 0.00054 (SI table 3). In this regard, it is also important to examine how groups of commodities impact inequality.
Table 3. Top 10 commodity transfers that increase (red) and decrease (blue) inequality, the impact on the inequality of that individual trade link and the portions of that impact that directly belong to the exporter and importer (e.g. the direct impact of link ij on country i and country j). Impacts were evaluated as the difference in Gini coefficient with and without the commodity specific trade links in order to determine the major contributors to inequality.
|
Table 4. The total positive (red) or negative (blue) impact on inequality due to the trade of specific commodities. The portion of that total impact which reduces inequality, the portion which increases inequality and the absolute ratio between the positive and negative portions of the total impact.
|
In 1986, trade of cereal commodities accounted for 72.6% of the decrease in inequality. Roots, fruits and stimulants combined contribute most to increasing inequality, but only account for 1.5% of the total change in inequality. This contrast indicates that reductions in inequality are dominated by a single commodity group, but that increases in inequality are not commodity group specific (table 5). This pattern held throughout the study record. In 2011, trade of cereal commodities was responsible for 62.5% of the decrease in the Gini coefficient. In contrast, fruits and stimulant categories combined in 2011 only provided a 0.57% increase in inequality (table 6).
Table 5. The contribution to the change in inequality by different major commodities for the year 1986.
| Commodity group | Impact of commodity on the Gini coefficient | Ratio of commodity impact to total change |
|---|---|---|
| 2—Roots and tubers and derived products | 0.0013 | −0.0118 |
| 8—Fruits and derived products | 0.0003 | −0.0031 |
| 12—Stimulant crops and derived products | 0.0002 | −0.0018 |
| 5—Nuts and derived products | −0.0001 | 0.0005 |
| 13—Tobacco and rubber and other crops | −0.0001 | 0.0007 |
| 10 – Spices | −0.0002 | 0.0016 |
| 15 – Beverages | −0.0004 | 0.0037 |
| 7—Vegetables and derived products | −0.0006 | 0.0058 |
| 11—Fodder crops and products | −0.0006 | 0.0058 |
| 4—Pulses and derived products | −0.0011 | 0.0098 |
| 6—Oil-bearing crops and derived products | −0.0013 | 0.0117 |
| 17—Products from slaughtered animals | −0.0049 | 0.0440 |
| 3—Sugar crops and sweeteners and derived products | −0.0051 | 0.0453 |
| 18—Products from live animals | −0.0069 | 0.0623 |
| 14—Vegetable and animal oils and fats | −0.0111 | 0.0994 |
| 1—Cereals and cereal products | −0.0810 | 0.7262 |
Table 6. The contribution to the change in inequality by different major commodities for the year 2011.
| Commodity group | Impact of commodity on the Gini coefficient | Ratio of commodity impact to total change |
|---|---|---|
| 8—Fruits and derived products | 0.0006 | −0.0035 |
| 12—Stimulant crops and derived products | 0.0003 | −0.0022 |
| 5—Nuts and derived products | 0.0000 | 0.0003 |
| 13—Tobacco and rubber and other crops | −0.0001 | 0.0009 |
| 10—Spices | −0.0003 | 0.0018 |
| 11—Fodder crops and products | −0.0003 | 0.0020 |
| 7—Vegetables and derived products | −0.0005 | 0.0034 |
| 2—Roots and tubers and derived products | −0.0006 | 0.0035 |
| 15—Beverages | −0.0007 | 0.0041 |
| 4—Pulses and derived products | −0.0024 | 0.0150 |
| 17—Products from slaughtered animals | −0.0052 | 0.0326 |
| 18—Products from live animals | −0.0058 | 0.0361 |
| 6—Oil-bearing crops and derived products | −0.0077 | 0.0484 |
| 3—Sugar crops and sweeteners and derived products | −0.0090 | 0.0563 |
| 14—Vegetable and animal oils and fats | −0.0282 | 0.1762 |
| 1—Cereals and cereal products | −0.1002 | 0.6251 |
We can focus the analysis, for example the trade of the cereal commodity group for the year 2011, to help decipher the impacts of specific trade links (table 7). The top five countries that reduce inequality via exports (table 7), are responsible for 23.5% of the −0.214 maximum drop in the Gini coefficient (table 1, figure 1). On the other hand, the top five nations that increase inequality via trade of cereal commodities represent only the 5.5% of the 0.054 maximum increase in inequality due to trade. These results can then be further filtered to identify the specific links within the cereal commodity grouping that best contribute to decreasing the Gini coefficient such as the export of wheat from France to Algeria or Maize from the United States to Japan. In contrast, the cereal trade links associated with the largest increases in inequality are the export of Maize from Slovenia to Italy and the export of Barley from Argentina to Uruguay (table 8).
Table 7. Top 10 nodes that increase (red) or reduce (blue) inequality within the cereal commodity grouping, their impact to their own contribution to inequality, the impact to the other nodes contribution, ratio of a nodes impact to itself to its global impact, and the percent of the total change that node via exports is responsible for.
|
Table 8. Top ten transfers that increase (red) and decrease (blue) inequality within the cereal commodity network, the kilocalories traded, the impact of that link, the impact of that link to the exporting country and the impact of that link to the importing country.
|
4. Discussion and conclusions
The amount of food traded internationally is increasing and the number of individual trade links is also increasing (D'Odorico et al 2014). This has resulted in a complex trade network with ∼3 × 10⁷ distinct trade links that contribute to geographic patterns and variability in food availability. Our results show that, overall, trade reduces inequality among countries relative to the distribution of food production by moving food from countries with higher, to countries with lower, per capita dietary energy availability.
While the general impact of trade is the reduction in inequality, there are also trade links that exhibit flows in the opposite direction and therefore increase inequality. The general pattern highlighted by this study is that the trade links that reduce inequality are mostly associated with staple food products (cereals), while the increase in inequality is often contributed by the trade of 'cash' crops and 'luxury' food products. It can be argued that these high value exports could improve food security in the producer's country if the profits from the sale of luxury products to foreign trade partners directly or indirectly benefits also the more food insecure part of the society, a point we are unable to evaluate with these country-level aggregated data. We also notice that sometimes these opposite impacts of trade on inequality are related. For example, the cocoa bean trade acts to increase inequality in the global food system, but chocolate, which is a secondary product produced from cocoa, decreases inequality when it is traded. Similarly, while the net effect of global trade is reduction in inequality, the direct impacts of an individual country's production can increase inequality even if exports from the same country decrease overall inequality. There are also nodes which act as transfer hubs; whose impact on inequality is determined by the source and destination of the large transfers moving through the node relative to the node population. This is exemplified by Slovenia, whose Port of Koper has had large increases in trade to Eastern and Southern Europe over the past quarter century resulting in large increases in inequality due to reexportation through the port (Dundović and Hess 2012). Understanding the full extent of these primary-secondary commodity and direct-indirect effect patterns on the global food system is beyond the scope of this work, but identifying these patterns emphasizes the complexity of global food trade and how simple classifications of self-sufficiency and trade-dependence do not adequately characterize the properties of this network.
Without a doubt, trade prevents or ameliorates conditions of severe food deficit in some countries, but this does not mean that trade is always beneficial (Carr et al 2012, O'Bannon et al 2014). One reason for this is because the effects of domestic production and international trade on country-level food availability are not necessarily independent. For example, trade can affect production by pushing exporting countries to sustain higher levels of production than their domestic demand, or by decreasing production in importing countries. In some cases, low cost imports can undercut domestic product and create a reliance on cheaper and subsidized agricultural surpluses from abroad (e.g. Narula 2010). Thus while the direct effect of trade is to reduce country-level inequality, it might indirectly contribute to the emergence of those inequalities in the first place as these patterns reflect the co-evolution of populations, institutions and technologies.
Our analysis here implicitly incorporates human migration, however an explicit treatment that incorporates population flows amongst the nodes may reveal interesting patterns in the changes in inequality. While international migration affects only a small fraction (∼3%) of the global population (Davis et al 2013), it would be interesting to understand to what extent it is driven by inequality in food resources. Does human migration act to mitigate inequality, or does it follow other flow paths? These questions among others can be asked using similar analyses to those presented herein. Our study has focused exclusively on direct effects from the transfer of calories embedded in food commodities related to the global distribution of food production, but detailed analysis of the evolution of inequality could be useful for predicting future scenarios.
Ethical concerns may arise when inequality in access to food leaves some people or entire sectors of the society in conditions of malnourishment or hunger. The international community has recognized the right to food as a human right (UN 1948, UN 1966). Our analysis does not allow us to conclusively assess the impact of trade on the fulfillment of the right to food because it uses country level data, while human rights are ultimately defined at the scale of single individuals (i.e., rights that every individual has by the fact of being human). The fact that in one country there is on average enough food to feed everyone does not mean that every person in that country will have physical and economic access to food (e.g. Sen 1982). Nevertheless our study makes a first-step in the direction of making these connections at the country level. Moreover, the network-based approach described here could be adapted to analyze intra-national food distributions.
Projections suggest that substantial increases in food production will be necessary by 2050 to meet the needs of the growing human population (IAASTD 2009, Tilman et al 2011, Alexandratos and Bruinsma 2012). Redistribution of food through trade will become increasingly important as some countries become unable to sustainably intensify or extensify production (Seekell et al 2011, Fader et al 2016). The goal of this study is to shed light on the effects of international trade on inequality patterns in the global distribution of food. While we develop a tool to understand how inequality is affected by the actual structure of the trade network, at this stage we are unable to make recommendations for suitable policy interventions that are feasible and likely to be put into place. Our analysis shows that network-wide solutions to reducing inequality are unnecessary because a small number of trade links are responsible for decreasing and increasing inequality. In this regard our analysis represents an important advancement in the analysis of global scale food data, moving away from the description of aggregate patterns and toward the development of actionable results and recommendations. Moreover, our results show that the impact of any given node (country) depends on all of its trade links, and that changes in some of them have effects on global inequality that are non-local and nonlinear.
Acknowledgments
This work was supported by the National Socio-Environmental Synthesis Center (SESYNC) under funding received from the National Science Foundation (DBI-1052875).