


Abstract
While high-income countries have made significant strides since the 1970s in improving air quality, air pollution continues to rise in many developing countries and the world as a whole. A significant share of the pollution burden in developing countries can be attributed to production for export to consumers in high-income nations. However, it remains a challenge to quantify individual actors' share of responsibility for pollution, and to involve parties other than primary emitters in cleanup efforts. Here we present a new spatially explicit modeling approach to link SO2, NOx, and PM10 severe emissions hotspots to final consumers via global supply chains. These maps show developed countries reducing their emissions domestically but driving new pollution hotspots in developing countries. This is also the first time a spatially explicit footprint inventory has been established. Linking consumers and supply chains to emissions hotspots creates opportunities for other parties to participate alongside primary emitters and local regulators in pollution abatement efforts.
Export citation and abstract BibTeX RIS

Original content from this work may be used under the terms of the Creative Commons Attribution 3.0 licence. Any further distribution of this work must maintain attribution to the author(s) and the title of the work, journal citation and DOI.
Introduction
Severe air pollution, especially in developing countries, causes 3–4 million premature deaths annually, or ≈6% of total avoidable mortality globally (World Health Organisation 2012, Lelieveld et al 2015). Developed countries indirectly contribute to this impact through their consumption by inducing polluting production. Within the high-income countries air quality has improved significantly since the 1970s but with production shifting overseas and growing global trade, some air pollution has been displaced to developing countries (Streets et al 2006, Kanemoto et al 2013, Guan et al 2014). The Port of Los Angeles provides a case in point: the port has made remarkable strides in reducing pollution from trucks, incoming ships, and on-site sources (Barboza 2015) at the same time as it opened a new China Shipping terminal to increase imports from China, where chronic smog from production is a major health problem (Rice 2015).
While the number of sources of air pollution is relatively small, particularly for point source emissions, the number of intermediate and final consumers driving the activity, is large. Footprint accounting (also known as consumption-based accounting) holds consumers responsible for the impacts of their purchases even when those impacts occur abroad (Wackernagel and Rees 1996, Hoekstra and Wiedmann 2014, Kander et al 2015, Meng et al 2015b). Consumption-based accounting and life-cycle analysis track pollution created by supply chains through multiple trade and transformation steps, from producers to final consumers, in order to reattribute responsibility for emissions to final consumers. Identifying all actors along the supply chain whose activities contribute to emission hotspots can open the door to new solutions to combatting pollution that bring together primary emitters, local regulators, and downstream users.
Identifying the location and spatial extent of emissions hotspots is crucial for targeting cleanup efforts. While existing life-cycle and multi-region input–output (MRIO) databases can be used to identify key flows and industries in supply networks that contribute to the air pollution footprint, it has not been possible for countries, companies, or individuals to actually locate their air pollution footprint hotspots spatially. Previous research on air pollution footprints has been limited to single-country analyses or, for inter-national analyses, to the resolution of nations or global regions (Weber and Matthews 2007, Xu et al 2009, Guan et al 2014, Lin et al 2014, Takahashi et al 2014, Meng et al 2015a, 2015b).
Here we introduce a new approach for linking emissions hotspots to trade and supply chains. A large body of research exists tracing pollutants from emission source to final health impacts (also called fate). We investigate a missing link: that between consumers and the pollution hotspots their consumption drives. This link involves consumers, companies, emitters, and regulators.
Remote sensing and spatial modeling efforts provide spatially explicit maps of air pollution emissions (for an overview see Streets et al 2014). The EU EDGAR database provides global gridded maps of air pollution by industrial activity (PBL 2015). In this study we connect the EDGAR emissions maps to the Eora MRIO trade database, which covers 187 countries with 25–500 industries in each country, in order to link severe air pollution hotspots to global supply chains (see Methods and illustration of method in figure 1). This adds a spatially explicit dimension to standard MRIO-based embodied emissions calculations that have been done for various substances, particularly CO2 (Peters and Hertwich 2008, Davis and Caldeira 2010, Davis et al 2011, Peters et al 2011, Peters et al 2012).

Figure 1. Illustration of method. To prepare the map of B's footprint (induced emissions) in China, the emissions maps for each sector in China are scaled according to the sector's emissions embodied in supply chains destined for B. The hotspots in the emission map of China are not same as the hotspots in China induced by country B. The model considers 30 emissions categories/sectors and 11–13 emissions maps/sectors in 187 countries and uses a trade database documenting 15 000 industries and >5 billion supply chains.The spatial footprint method has also been applied to locate carbon emissions hotspots (Kanemoto et al 2016) and to locate biodiversity threat hotspots (Moran and Kanemoto 2016).
Download figure:
Standard image High-resolution imageAn air pollution footprint hotspot map locates where the emissions associated with a given consumption bundle occur. The air pollution footprint map for any country can be explored. Here we link air pollution mapping and global supply chains in order to gain a spatially detailed view of the air pollution footprint of nations over time. The map for each country and gas shows the magnitude and spatial location(s) of that nation's pollution footprint in each of its trading partners.
Methods
Tracing air pollution to the final consumer was one of the original uses of environmentally extended MRIOs (Leontief and Ford 1971, Giarratani and Thompson 1974). An environmentally extended multi-regional input–output framework extends an inter-sectoral monetary flow database by tracing pollution with economic flows. The territorial air pollution emissions associated with production (p) in country 
 can be separated into embodied emissions in consumption, in imports, and in exports (Kanemoto et al 2012a):
where  is factor intensity (here, emissions intensity),
  is the Leontief inverse,
  is final demand, and
  and
and  are sector of origin and destination. The export term covers the factor use in region
  required to produce final goods in
  which are then sold by
  to
to  and consumption and imports term cover factor use in region
  required to produce final goods in
  which are then sold by
  to
to  For additional information on how embodied emissions footprints can be calculated using input–output analysis the reader may refer to Minx et al (2009), Wiedmann (2009), Kanemoto et al (2012b), Lenzen et al (2012b), Kitzes (2013).
Global MRIO databases do not currently trace flows at the sub-national level, i.e. which cities produce or consumer which goods, however emissions maps do exist differentiated by sector and it is known the sector mix contributes to the trade shares of goods and services exported for final consumption in other countries. The method is illustrated in figure 1. Multi-scale MRIOs combining inter-national and sub-national flows that would offer further improvements in resolution accuracy are under development (Feng et al 2013, Bachmann et al 2014, Lenzen et al 2014, Wenz et al 2014, Godar et al 2015).
We use the Eora MRIO embodied emissions framework (Lenzen et al 2012a) covering  countries and 15 984 industries and the EDGAR (PBL 2015) greenhouse gas emissions database and industry-specific emission maps. For each air pollutant—NOx, SO2, PM10, CO, and NMVOC—and each country, EDGAR provides the total pollution emission volume,
  split into 55 categories (though some categories are unused for some gasses in some countries), and a gridded map
  showing the spatial distribution of emissions of that gas by each of
  industries. Note that the emissions database, and our results, report only on primary emissions and do not include secondary pollution such as particulate matter formed atmospherically from other primary pollutants. We attribute direct emissions amongst the industries in the Eora MRIO and concord the 55 categories into
  industries. There is a concordance between the economic sectors in the MRIO and the equivalent sector(s) in EDGAR. The maps
  are provided at 0.1° resolution, meaning grid cells are ≈10 km2 at the equator. The Eora MRIO covers the years 1970–2013, but the latest year of the EDGAR database is 2008.
The Eora MRIO generally differentiates more sectors than does EDGAR. When this occurs, the detailed daughter industries from the MRIO are mapped using the sector's share of total emissions ( ) and and the spatial distribution of the parent sector in EDGAR. To more accurately assess air pollution footprints, it is important to increase the sectoral resolution of the emissions data and maps in the future. The precision of the results is also constrained by the reliability of the emissions maps (Oita et al 2016), and by the reliability of the MRIO used (though all current MRIO databases are generally consistent Moran and Wood 2014).
We estimate the gridded air pollution hotspots H map driven by imports (m) into country s as:
The figures presented in this paper are the air pollution hotspots driven by total consumption (c) of country s as:
Since both the embodied emissions term (fLy) and emission maps term (R) are in absolute values, the embodied emissions term fLy is normalized by total emissions d so that the result is in absolute values from R.
Results and discussion
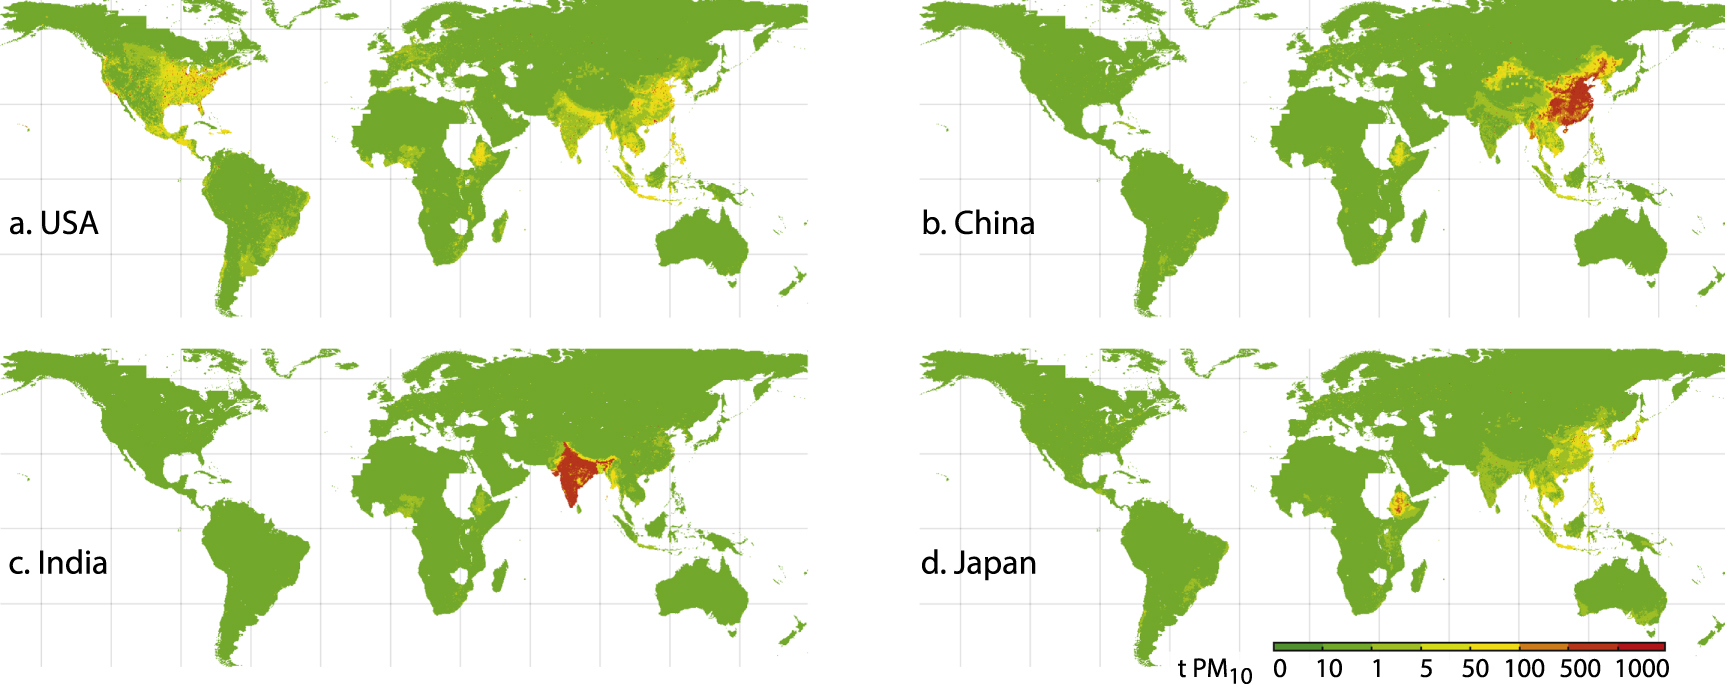
In the 1970s domestic production for domestic demand was the main cause of air pollution. But with the growth of global trade that is not always true today. Domestic-only abatement measures are not sufficient for reducing a nation's actual air pollution footprint, especially for high-income nations. Due to the growth of international trade an expanding share of the air pollution footprint of these nations is being exerted abroad. The globalized economy shifts the burden of NOx, SO2, and PM10 emissions in developed nations from domestic to developing countries, especially to China and India. In developing counties the air pollution footprint is mostly a domestic problem (see figures 2(b) and (c); results are similar for other developing countries and gasses). For high-income countries, the air pollution footprint creates an international problem via global supply chains (figures 2(a) and (d)).

Figure 2. Mapping the PM10 footprints of United States (a), China (b), India (c) and Japan (d), in 2008.
Download figure:
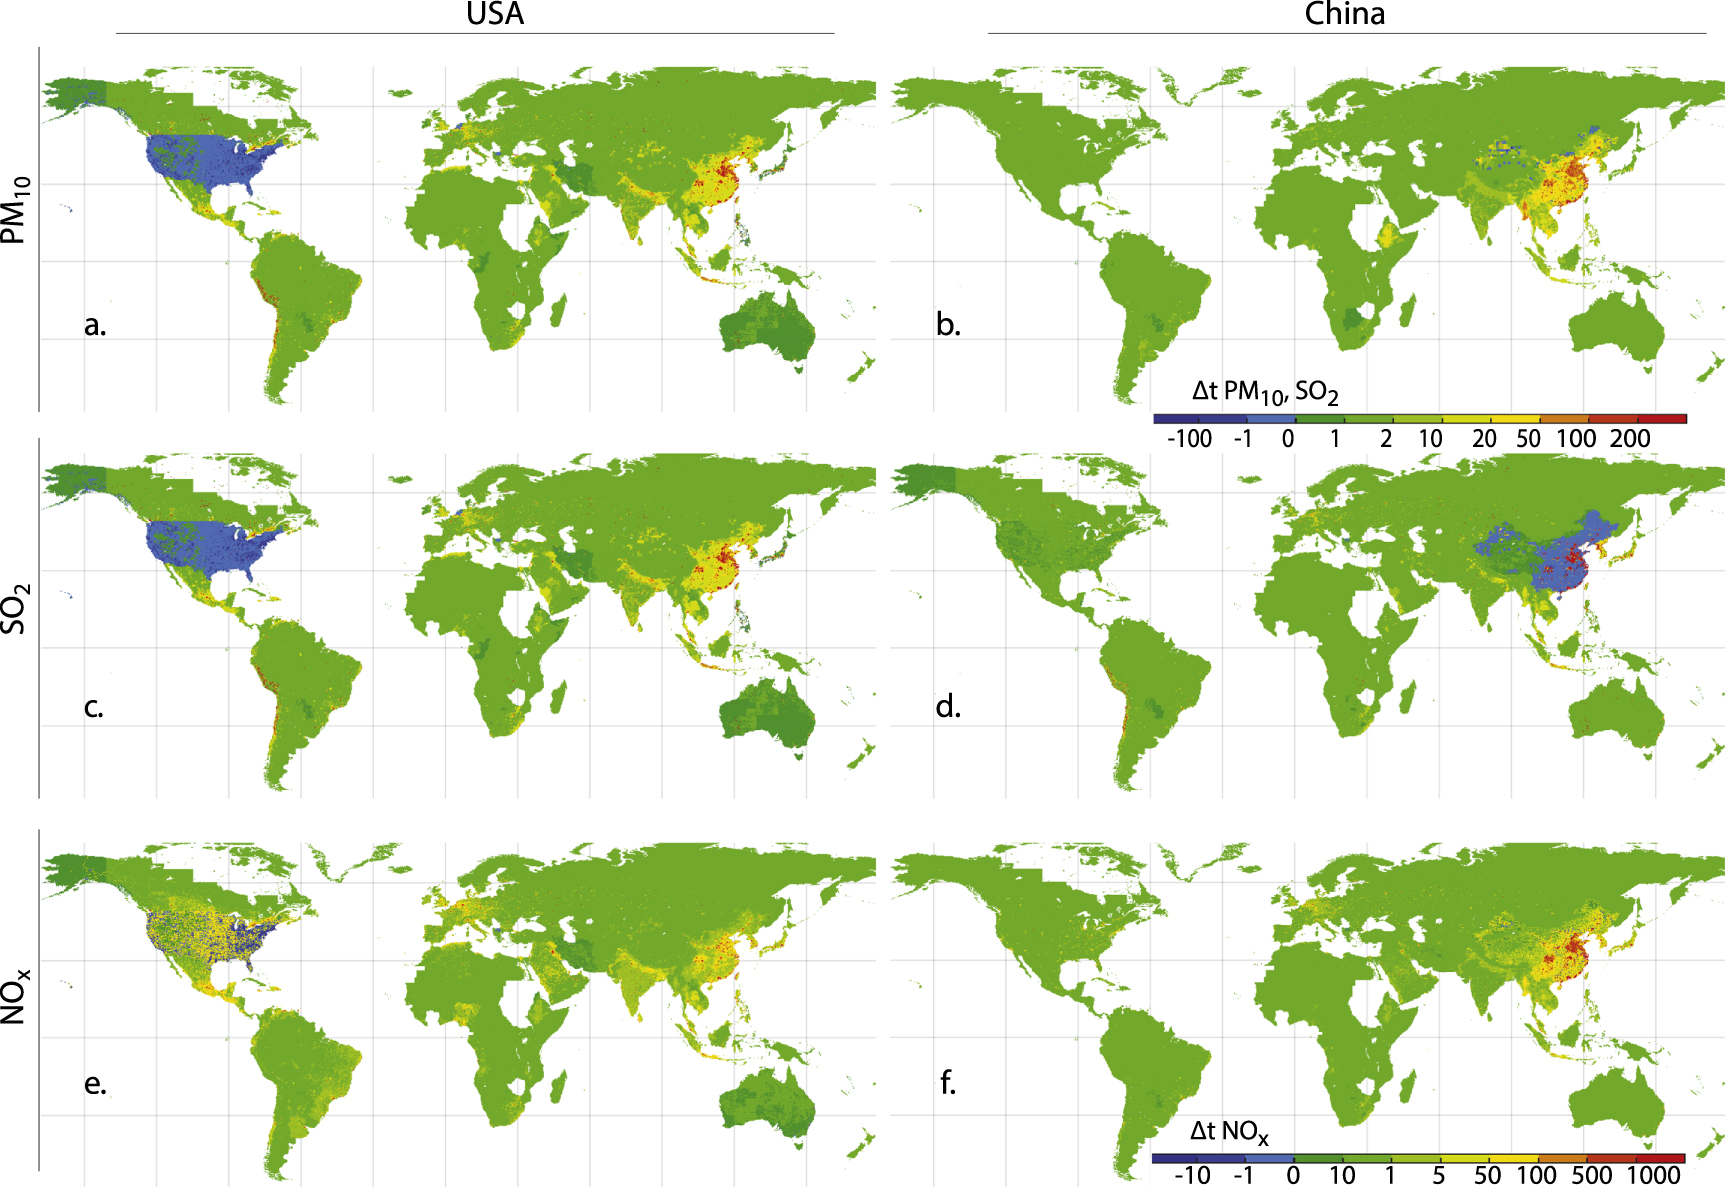
Standard image High-resolution imageIn general, since 1970 developed countries have reduced their air pollution territorially, but their growing consumption has induced new emissions abroad. This is clearly visible for the US, where its air pollution footprint within its own borders has declined since 1970 (figure 3 panels (a), (c), and (e) for PM10, SO2, and, NOx, respectively) and increased abroad, especially into China but also growing in India, Mexico, Canada, and, for NOx, Europe. Similar patterns hold for other high-income countries (see supplementary information for additional maps, including for emissions of carbon monoxide and non-methane volatile organic compounds). Interestingly, we note that US NOx emissions reductions have not been uniform within the country: improvements have been made along the Eastern seaboard but NOx emissions have increased in the central and western states. Variations across pollutants are explained by the production structure (the mix of industries operating in each country), national fuel mix, pollution control technology, and by the pattern and content of trade. The US has had mixed success reducing NOx hotspots, and in China NOx and PM10 hotpots have expanded and SO2 emissions have shifted dramatically, reducing in rural areas but increasing in urban ones (figure 3).

Figure 3. Mapping the changes in PM10 footprint of United States (a) and China (b), SO2 footprint (c), (d) and NOx footprint (e), (f) from 1970 to 2008.
Download figure:
Standard image High-resolution imageDeveloping countries in contrast have seen their air pollution footprint grow mainly inside their borders. In parallel with its economic growth China has suffered increasing PM10 and SO2 emissions within its borders. Interestingly, for NOx the situation has improved in most of the territorial area (figure 4(d)), with the sharp exception of new, strongly growing hotspots in Chongquing/Sichuan province, coastal Guangdong Province, the Beijing/greater Hebei province, and the great Shanghai metropolitan area. Most of the growth in the Chinese air pollution footprint has been domestic, though there has been some growth into other countries. Within China the SO2 footprint of domestic consumption has worsened air pollution in densely populated areas, while the pollution footprint in the northern Mongolia/Russia border has in cases softened (figure 3(d)). The expansion of the Chinese air pollution footprint has primarily been in and around Southeast Asia but we do observe the beginnings of growth of footprints on Europe and the US (PM10; figure 3(b)), Chile and Peru (NOx; figure 3(f)) and Africa (SO2; figure 3(d)). We observe three dynamics in the air pollution footprints of developed nations: (1) the air pollution footprint domestically is steady or shrinking, (2) the air pollution footprint abroad is increasing, and (3) the air pollution footprint is growing faster in terms of area than in terms of emissions, meaning it is becoming more diluted. This pattern holds for most high-income countries. However, in developing and middle-income countries air pollution is worsening domestically and growing slowly internationally, with the result that the air pollution footprint is becoming more concentrated, not less.
Figure 4. Mapping the PM10 footprints of United States (a), China (b), UK (c), and India (d) in 2008.
Download figure:
Standard image High-resolution image
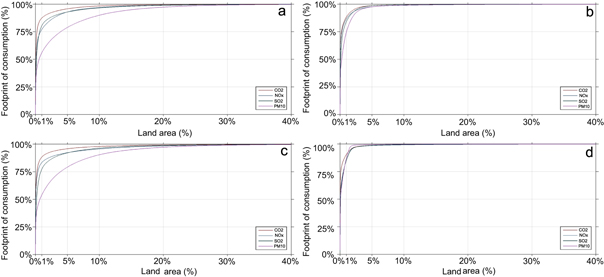
The air pollution footprints of developed countries generally extend over a larger area than their carbon footprints. If US were to reduce 90% of their PM10 footprint, its policies would need to extend over 20 times more land area than would be required for the same reduction of CO2 (note we are referring to the land area from which pollution is emitted, not the extent covered by the pollutant gasses inclusive of atmospheric transportation/diffusion). The air pollution footprints for most countries are large, and spreading, and are spreading more quickly than the carbon emissions footprint.
In 1970 90% of the US SO2 footprint rested in just 1.5% of global land area; by 2008 that footprint areal extent had doubled, to 3.1% of global land area. For NOx the growth has been larger: the land area required to contain 90% of the NOx footprint grew from 0.6% of global land area in 1970 to 3.6% in 2008. The US PM10 footprint has grown the most, growing 15 times larger (90% of the footprint rested in 0.59% of land area in 1970 but in 9.9% of global land area in 2008). This pattern holds across most high-income countries, with the footprint having grown 200%–2000% in area since 1970. For the UK air pollution has declined domestically (territorial emissions −35.9% NOx; −87.0% SO2; −94.6% PM10) increased slightly in total footprint (+31% NOx, −28% SO2; +20% PM10) and spread dramatically (area encompassing 90% of emissions +490% NOx; +4000% SO2; +3300% PM10), meaning its footprint has become diluted in area.
India, in contrast, has experienced a large growth in territorial emissions (270.5% NOx; 420.5% SO2; 185.1% PM10), similar growth in total international footprint (+317% NOx; +410% SO2; +256% PM10) and slower growth in area (+6% NOx; +200% SO2, −8% PM10), meaning that its footprint has grown more concentrated. We observe a general pattern whereby developed countries are reducing pollution domestically and spreading their footprint abroad, while developing experience growth in their air pollution mostly domestically.
Conclusions
For developed countries the spread of the air pollution footprint area makes it more difficult to implement point source emission abatement measures since the pollution footprint arises from a growing number of sources. However spatial targeting can help identify abatement opportunities, and these opportunities can be focused. If the US targeted cleanup efforts in just the 1% of land area where its air pollution footprint falls most heavily, those efforts could reach 80% of its SO2 and NOx footprint, and 55% of its PM10 footprint, providing direct pollution reduction at affected hotspots. Abatement outside a country's borders can be facilitated by many means including technology transfer, financial transfers, like the Global Environmental Facility and Clean Development Mechanism, and companies holding foreign units and suppliers to higher standards.
In future work it would also be advantageous to trace consumption-driven impacts beyond just the point of primary pollution (smokestack) but additionally through atmospheric transport and transformation models to understand the complete links between consumption and induced human health impacts.
Unlike greenhouse gas emissions, air pollution is a local problem. Focusing mitigation on emissions hotspots provides a way to link regulators and primary polluters to the downstream consumers whose purchases ultimately drive emissions. This in turn allows more actors along the supply chain to participate in remediation actions to reduce air pollution.
Acknowledgments
This work was supported in part by the Japan Society for the Promotion of Science through its Grant-in-Aid for Young Scientists (A) 15H05341 and the Norwegian Research Council via grant #255483/E50. We thank A Hart for comments which have improved the paper.