Abstract
Damage due to tropical cyclones accounts for more than 50% of all meteorologically-induced economic losses worldwide. Their nominal impact is projected to increase substantially as the exposed population grows, per capita income increases, and anthropogenic climate change manifests. So far, historical losses due to tropical cyclones have been found to increase less than linearly with a nation's affected gross domestic product (GDP). Here we show that for the United States this scaling is caused by a sub-linear increase with affected population while relative losses scale super-linearly with per capita income. The finding is robust across a multitude of empirically derived damage models that link the storm's wind speed, exposed population, and per capita GDP to reported losses. The separation of both socio-economic predictors strongly affects the projection of potential future hurricane losses. Separating the effects of growth in population and per-capita income, per hurricane losses with respect to national GDP are projected to triple by the end of the century under unmitigated climate change, while they are estimated to decrease slightly without the separation.
Export citation and abstract BibTeX RIS

Original content from this work may be used under the terms of the Creative Commons Attribution 3.0 licence. Any further distribution of this work must maintain attribution to the author(s) and the title of the work, journal citation and DOI.
Introduction
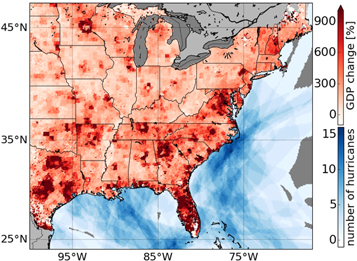
In the United States hurricanes have caused estimated losses of $400 billion between 1980 and 2014 representing more than half of all meteorologically-induced damage [1]. While absolute losses have clearly increased over time there is an ongoing debate whether this rise is mainly caused by increasing wealth or potential changes in hurricanes' frequency and intensity [2, 3] (see figure 1 for a mapping of historical wealth changes and the historical hurricane threat to the United States). This question is not only relevant in terms of the attribution of observed historical trends but also critical for the projections of future losses under coeval development of the socio-economic situation and climate change. So far, the majority of studies has focused on the characterization of the relationship between the physical hazard and economic losses (and here mostly on the choice of the best wind-speed exponent [4–6], but also on other physical predictors like storm size [7, 8]). The role of socio-economic development on hurricane losses has mainly been treated either qualitatively or by assuming a linear relationship between the overall affected GDP and observed losses [4, 9–11]. Allowing for other functional relationships, hurricane damages in the United States have been found to scale sub-linearly with affected capital stock [12]. Here, we revisit the relationship between hurricane intensity and socio-economic drivers explicitly comparing models using total GDP as a predictor (model type 1:  to models that separate the effects of affected population (POP) and average per capita income (GDPpc) on US hurricane losses (model type 2:
  We particularly assess the implications for future projections of losses based on projections of population growth and GDP under the Shared Socio-Economic Pathways (SSPs) [13, 14] and changes of hurricane intensity and frequency under the high emission Representative Concentration Pathway RCP8.5 [15]. We find that despite the fact that both basic model types reproduce historic hurricane losses almost equally well, the separation of GDP into per capita income and population leads to a major divergence of projected future losses.
Figure 1. Historical trends in GDP and historical hurricane tracks. Shading over land indicates the percent change of gridded inflation-adjusted GDP from 1963 to 2012. Shading over water shows the absolute number of observed storms with at least hurricane strength for the same period.
Download figure:
Standard image High-resolution imageMethods
We relate reported loss data with socio-economic and hazard-related predictors to test different functional relationships. For an assessment of the sensitivity of the results we consider different commonly used functional wind-speed relationships  and two historical loss data sets. In total, we evaluate eight different damage functions for each of both basic model types for all storms that make landfall with at least hurricane force winds, i.e. wind speed above land ≥64 knts, in the Eastern United States.
Data
We use a newly-constructed gridded data set (with 0.1° × 0.1° grid resolution) for the physical and socio-economic predictors that spans the period 1963–2100. Historical hurricane tracks (size and locally-resolved maximum wind-speeds) are based on the National Hurricane Center's best track archive (HURDAT) [16] using 6 h track coordinates, maximum wind-speed (Vmax), and wind-speed radii for the wind-speed thresholds 64 knts and Vmax. The data is interpolated to hourly data and transferred to a grid with spatial resolution of 0.1° × 0.1°. Where wind-speed radii are unavailable (from 1963 to 1987), the wind-field is a best estimate based on the full record from 1988 to 2012, see supplementary table S1 and figure S1 for details regarding the assumed spatial distribution of wind speeds along the reported tracks.
The future hurricane climatology is based on six Global Circulation Models (GCMs). Despite significant model improvements in recent years, GCMs do not explicitly resolve the dynamics of hurricanes [17]. Here we use projections of future cyclone tracks based on an artificial 'seeding' of a large number of tropical cyclones that develop into hurricanes according to a high-resolution dynamical hurricane model [18]. The hurricane model is forced by winds derived from the different GCMs under RCP8.5 [18, 19] generated within the Coupled Model Intercomparison Project Phase 5 (CMIP5) for the period 2006–2100 plus equivalent simulations for the historical period 1950–2005 [15]. Overall, our study is based on 4578 storm tracks that develop into hurricanes and affect the Eastern United States with hurricane force winds between 1981 and 2100. Simulated tracks are equivalently interpolated to hourly data, each storm's wind-field is estimated using the HURDAT-based 1988–2012 wind radii record, and projected to a grid with 0.1° resolution.
Reported hurricane losses are taken from two different data sources (ICAT, 1963–2012, www.icatdamageestimator.com; NATCAT, 1980–2012, MunichRE's NatCatSERVICE [20]) as full (i.e. insured + uninsured) historic losses and inflation-adjusted to 2005$.
High-resolution gridded population data [21, 22] is used in order to track local increases in US population but also the inner-country migration towards the coast. Gridded population density is based on the 2000 Gridded Population of the World (GWPv3, resolution 0.0083°) data [22] normalized according to US county population. Population time-series from 1963–2012 are generated using county population changes [21] and a subsequent upscaling to 0.1° grid resolution. Projected future population (2013–2100) according to five different SSP scenarios [13] is downscaled from its original 0.125° resolution to match our grid resolution.
Income data is based on US States real per capita GDP (in 2005$) time series [23] from 1963 to 2012 and projected onto a 0.1° resolution grid according to population density. Future GDP estimates (2013–2100) are based on national per capita GDP evolution according to different SSPs [24] and the gridded future population time series. In order to conserve local inhomogeneities in the GDP per capita distribution national per capita GDP is rescaled according to the historic mean (2008–2012) of US States GDP per capita.
Affected GDP (and affected population) by storm j is defined as the sum at all grid points i up to the total number  where the storm j's wind-field reaches the threshold value of
  knts, i.e.:

Additionally, we also define the population-weighted affected per capita GDP:

Statistical damage models
The analyzed damage functions rely on socio-economic variables and storm properties as predictors. As stated above, the introduction of two basic model types (model type 1 and model type 2) reflects the separation of damage functions according to their socio-economic predictors. For each damage function maximum wind speed and storm size are used as physical predictors. The damage functions differ with respect to their different functional scaling of losses with wind-speed (exponential, power-law), their separation between functional forms that attribute losses solely to maximum wind-speed at landfall (global) or account for local characteristics of the full wind-speed distribution (local), and to the different loss data sets (ICAT, NATCAT). The basic models of type 1 describe damages of storm j using total GDP as a single predictor


while models of type 2 separate between per capita GDP and population:


Damage functions (1) and (3) are of global form as they use maximum wind-speed at landfall  as a single wind-speed predictor. Conversely, damage functions (2) and (4) are of local form and use local estimates of maximum wind-speed, i.e. they determine losses for each grid point i separately. The respective power-law and exponential wind-speed dependence is obtained by replacing
  and
and  in equations (1)–(4).
The log-transformation of all variables in equations (1)–(4) results in normally-distributed residuals when conducting regression analysis. All fit parameters and associated standard errors are reported in supplementary tables S4–S7, S10 and S11.
Future hurricane loss estimation
By analyzing a multiple of naturally occurring hurricanes we are able to sample the potential future hurricane impact statistically. To estimate the aggregated future losses the simulated losses are scaled to match the historically observed average storm intensity and annual frequency. Intensity is normalized such that the observed and simulated 1983–2012 median loss per hurricane is equal. To do so, the median loss per hurricane is determined for each damage function and each GCM separately and then normalized according to observed median losses per storm, see figure S2 for details regarding the intensity normalization. Three of the considered models (MPI, CCSM4, MRI-CGSM3) reproduce the median intensities quite well while it is underestimated by MIROC5 and GFDL-CM3 and overestimated by HadGEM2-ES (see figure S2). To estimate annual aggregated losses the simulated annual losses are first rescaled by a GCM- and year-dependent factor that is provided with the data in [15] and ensures that global hurricane counts match observations (see [15] for details). In order to match simulated hurricane counts with observations for the United States locally, simulated annual losses are additionally scaled by a constant factor c = observed average landfall frequency over 1993–2012/simulated average landfall frequency over the same period (see figure S3 for details regarding the local frequency normalization). Upon global rescaling two GCMs (HADGEM-ES, MPI-ESM-MR) reproduce the historic landfall frequency very well, while the remaining GCMs underestimate the landfall frequency and require a local rescaling (see figure S3).
Future loss estimates are averages over the projections by all six GCMs and eight damage functions, but separately for both basic model types. The averaging procedure for per hurricane damages is the following: for each GCM and each damage function losses are simulated and intensity-normalized according to the normalization procedure described above. Across the distribution of all simulated hurricane losses in a 10 year bin the desired loss percentile is determined. For each considered percentile, the median across all GCMs yields the median loss per damage function. A subsequent median across all damage functions then yields a single number: the average simulated loss per storm for the desired percentile and 10 year interval. Percentiles of average annual losses are determined similarly: Single-event losses are aggregated to annual losses and additionally frequency-normalized according to the underlying GCM. Then, the desired percentile is obtained across the 10 year distribution of annual losses, followed by the subsequent medians across GCMs and damage functions as described above.
Results
First, we summarize the results of the regression analysis conducted for the different damage functions based on observational data between 1963 and 2012. In a second step, we apply the different damage functions to project future losses based on the simulated track repository.
Historical loss analysis
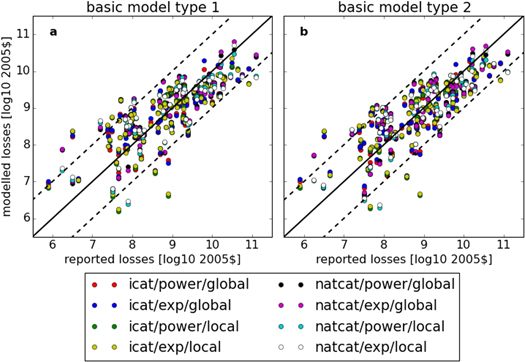
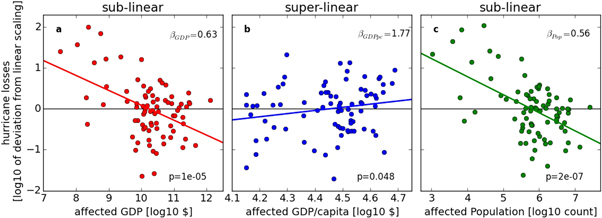
In general, the explained variances of all considered statistical models exceed 50% (see table 1, figure 2 and supplementary tables S2 and S3). The scaling of the socio-economic predictors as caused by the two different model approaches is of particular interest. Using total affected GDP as a single socio-economic predictor we find that hurricane losses scale sub-linearly with GDP across all considered sub-models (i.e.  see table 2 and figure 3). In contrast, models of the second type robustly show that the sub-linear increase with overall GDP is actually caused by a sub-linear increase with affected population while losses scale super-linearly with per capital income (
 see table 2, figure 3, and supplementary figures S4–S6). The same non-linear scaling-behavior is found if the affected region defined by the extension of each hurricane's wind-field is limited to coastal counties only, i.e. effectively changing the number of affected people and the value of average affected income (see supplementary tables S6 and S7). This result improves on findings in a previous study estimating separate but insignificant elasticities for per capital GDP and population [25] and is in line with a study that observes an increasing vulnerability to hurricane impacts with rising income for the United States [26].
Table 1. Variation of explained variances across different damage models. The variation in predictive quality across different damage models strongly depends on the analyzed time-period. If analyzed from 1980 to 2012 only, the explained variances for all models are higher than 67% and very similar across models. All damage models of basic model type 2 consistently show higher explained variances, as additionally verified using the Akaike Information criterion. Different loss data sets are displayed separately as NATCAT loss data is only available from 1980 onwards.
| Basic damage model type | Loss data/time period | Explained variances (%) (4 model-range) |
|---|---|---|
| ICAT/1963–2012 | 54–61 | |
| Type 1 | ICAT/1980–2012 | 67–68 |
| NATCAT/1980–2012 | 66–68 | |
| ICAT/1963–2012 | 56–64 | |
| Type 2 | ICAT/1980–2012 | 68–70 |
| NATCAT/1980–2012 | 69–71 |
Figure 2. Correlation between reported and modeled losses for each damage function for socio-economic scaling proportional to total GDP (basic model type 1) (a) and separated for population and per capita GDP (basic model type 2) (b). The predictive quality for different socio-economic scaling varies only slightly, see additionally supplementary tables S2 and S3. The nomenclature of damage functions is the following: icat/natcat denotes loss data sets, power (exp) denotes power-law (exponential) wind-speed dependence; local (global) denotes the specific damage function type (see methods section for details). The solid line marks the bisectrix, the dashed lines deviations by a factor of ten.
Download figure:
Standard image High-resolution imageTable 2.
Deviation from linear scaling of historical hurricane losses with socio-economic development. The  are the empirically obtained exponents of the socio-economic drivers considered in the models of type 1 only accounting for the total GDP affected (line 1) and models of type 2 separating the effects of the total population affected and per capita income (lines 2 and 3). Projected losses scale sub-linearly (i.e. β < 1) if affected GDP (with exponent
  is used as a single predictor for socio-economic development. Separating the predictor into the product of GDP per capita (with exponent
  and population values (with exponent
  reveals super-linear scaling (i.e. β > 1) of losses with GDP per capita and sub-linear scaling with population.
| 8 model-mean | 8 model-median | 8 model-range | |
|---|---|---|---|

|
0.50 | 0.57 | 0.20–0.67 |

|
2.29 | 2.26 | 1.48–3.13 |

|
0.41 | 0.47 | 0.12–0.59 |
Figure 3. Nonlinear scaling of historic hurricane losses with socio-economic development. The scaling of hurricane losses with each socio-economic parameter differs from a linear relationship with statistical significance (see one-sided p-values in each panel). Negative (positive) slopes indicate sub- (super-) linear scaling of hurricane losses with (a) GDP, (b) GDP per capita, and (c) population. Lines are the best-fit through the empirical data based on 81 reported hurricanes from the ICAT archive. The  are the empirically obtained power-law exponents of the damage models of type 1 and type 2, described in the methods section. Y-coordinates represent
 ![${\mathrm{log}}_{10}[{\rm{Los}}{{\rm{s}}}_{{j}}/({\alpha }\times {{{V}}_{{\rm{\max }},{j}}}^{{\gamma }})]-\,{\mathrm{log}}_{10}(\mathrm{GD}{{\rm{P}}}_{{j}})$](https://content.cld.iop.org/journals/1748-9326/11/8/084012/revision1/erlaa3666ieqn19.gif) in panel (a);
in panel (a); ![${\rm{l}}{\rm{o}}{{\rm{g}}}_{10}[{\rm{Los}}{{\rm{s}}}_{{j}}/({\alpha }\,\times {\rm{PO}}{{\rm{P}}}_{{j}}^{{{\beta }}_{{\rm{Pop}}}}\times {{{V}}_{{\rm{\max }},{j}}}^{\gamma })]\,$](https://content.cld.iop.org/journals/1748-9326/11/8/084012/revision1/erlaa3666ieqn20.gif)
 in panel (b); and
 ![${\rm{l}}{\rm{o}}{{\rm{g}}}_{10}[{\rm{Los}}{{\rm{s}}}_{{j}}/({\alpha }\,\times {\rm{GDPp}}{{{\rm{c}}}_{{j}}}^{{{\beta }}_{{\rm{GDPpc}}}}\times {{{V}}_{{\rm{\max }},{j}}}^{\gamma })]$](https://content.cld.iop.org/journals/1748-9326/11/8/084012/revision1/erlaa3666ieqn22.gif)
 in panel (c).
Download figure:
Standard image High-resolution imageReported losses from the NATCAT database are better reproduced than the reported losses from the ICAT loss archive, especially when applying damage functions that require local wind-speed estimates. This discrepancy seems to be related to a varying data quality over time and vanishes when analyzing both loss datasets from 1980 to 2012 only (explained variances increase to above 67% across all model approaches, see table 1 and supplementary tables S8–S11). The predictive skill for those models that separate income and population effects is slightly higher than for all models that only consider overall GDP. Based on the Akaike Information Criterion [27], the gain in predictive quality does not only result from inclusion of an additional parameter (see supplementary tables S2 and S3). This difference might not be sufficient to reject basic models of type 1 in favor of models of type 2. However, the separation has immediate consequences for the projection of future hurricane losses.
Future loss projections
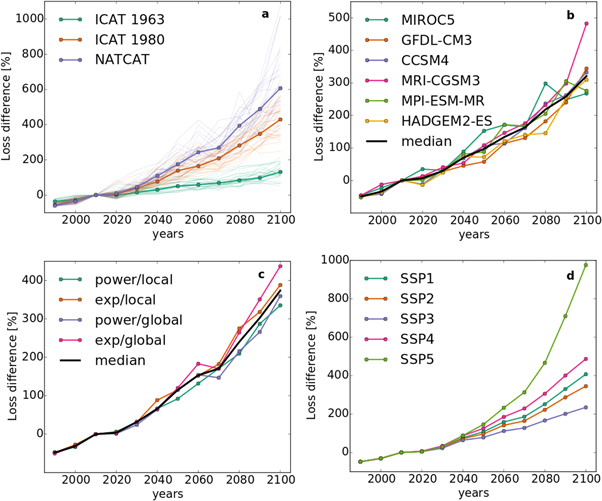
Hurricane losses are expected to increase as the intensity of the meteorological hazard due to climatic changes [15, 28, 29], affected population, and per capita income are projected to increase. Projections of average per hurricane damages from the two basic model types systematically differ for all considered damage functions and GCMs (see figure 4). Except for figure 4(d), future projections of GDP and population are based on the 'middle of the road' SSP2 scenario [14]. The median loss difference between both basic model types per GCM (figure 4(b)) and per damage model (figure 4(c)) are very comparable, predicting respectively an average loss difference of 321% [268%, 483%] (model range in parentheses) and 373% [335%, 437%] by 2100. The underlying variability in loss difference is mainly caused by the different loss data sets and, in particular, by the different time periods covered (figure 4(a)). When analyzing the ICAT data set from 1980 (ICAT 1980) onwards only, the large difference between ICAT 1963 and NATCAT reduces considerably.
Figure 4. Difference in projected median per hurricane losses caused by two different socio-economic scalings. Consistent increase in relative loss difference between median losses per hurricane projected by all models of basic model type 2 and type 1, broken down by individual drivers: loss data sets (a), GCMs (b), damage models (c), and SSPs (d). Thin lines in (a) denote all individual damage projections (identical for panels (b) and (c)), colored thick lines are medians across model ensembles, and black thick lines are medians across model ensembles. Sub-figures (a)–(c) show projections based on SSP2 only. The nomenclature of damage models in (c) is the following: power (exp) denotes power-law (exponential) wind-speed dependence of losses; local (global) denotes the specific damage function type (see methods section for details). The contribution called 'ICAT 1980' in (a) is only shown for comparison and not used to derive averages in the remaining sub-figures.
Download figure:
Standard image High-resolution imageIn addition to the different model realizations, the projected loss difference strongly depends on the relative changes in population and income as summarized by the various SSP scenarios (figure 4(d)). Under SSP5 (rapid development) the loss difference becomes maximal due to large prognosed gains in per capita GDP, while SSP3 (sustainable development) projects the smallest rise in loss difference. In the following, we quantify the individual driver of losses and therefore confine our analysis to the 'middle of the road' SSP2 scenario and to models of basic model type 2, that due to their design are very susceptible to relative changes in population and income. We project loss changes with respect to 2010 values (1) under fixed present-day socio-economic conditions, (2) changing population and fixed per capita income, (3) changing per capita income and fixed population, and (4) the combination of both drivers. Projections for the other SSPs are shown in the supplement.
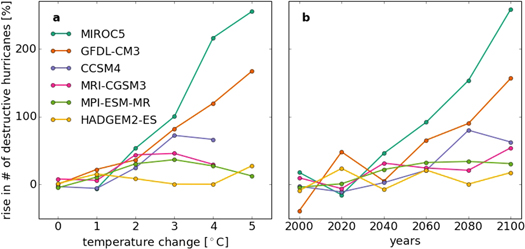
For constant present-day socio-economy, i.e. climate change effects only, the total number of hurricanes with projected losses above the GCM-specific 1983–2012 median loss increases for all considered GCMs towards the end of this century (see figure 5). The response of MIROC5 to changes in Global Mean Temperature (GMT) is greatest as the expected number of destructive hurricanes will more than triple for 5 °C of warming (with respect to the 1961–1990 mean GMT) while both HADGEM-ES and MPI-ESM-MR predict increases by roughly 30% at the lower end of the spectrum. Dependent on the GCM the increase in hurricane counts is to a varying degree driven by an increase in intensity and/or frequency as both stronger and more frequent events contribute to counts above the loss threshold (see supplementary figure S11 for details regarding the loss impact of single GCMs). As we are not in the position to judge on the quality of each GCM, we will in the following consider the median loss impact by all GCMs for future loss projections.
Figure 5. Change in future number of destructive hurricanes due to increases in hurricane frequency and intensity. Projected rise of hurricane counts with losses above the GCM-specific 1983–2012 median loss per hurricane for fixed socio-economic development as a function of (a) global mean temperature (with respect to the 1961–1990 mean) and (b) time for damage models of basic model type 2 (see methods section). Under unmitigated climate change all GCMs consistently show an increase in destructiveness but with varying magnitude. Each data point results as an annual median over 8 separate loss model projections and a subsequent mean over all years within a (a) 1 °C temperature-interval or (b) 20 year period. Temperature bins that contain less than three data points are not shown.
Download figure:
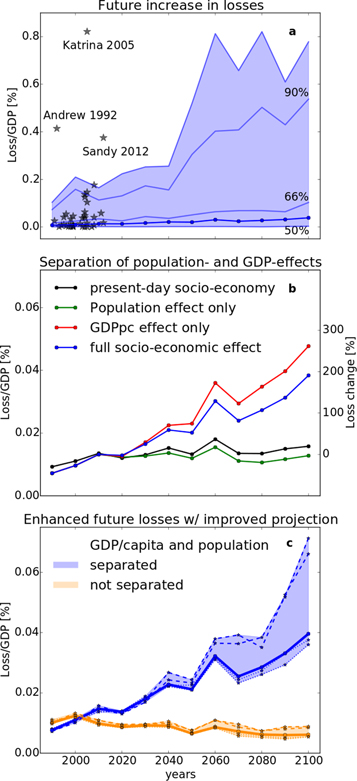
Standard image High-resolution imageThe losses of individual hurricanes per national GDP are estimated to increase substantially assuming population changes and GDP per capita development following SSP2 (see figure 6). Hereby all losses are normalized according to the national GDP in the year of landfall. All percentiles calculated across the distributions of 10 year bins see a rise in losses over time, with largest increases of the highest percentiles. Whereas median losses by 2100 increase by a factor 2.91 [1.62, 6.40] (10%–90% uncertainty range in parentheses), the 90% (95%) percentile rise by a factor of 4.75 [2.06, 9.57] (4.73 [2.02, 8.77]), corresponding to the expected increase in major hurricane intensity of category 4 and 5 [15, 29, 30]. The increase in losses due to individual hurricanes is primarily forced by the increase in per capita GDP (figure 6(b)). Assuming fixed present-day per capita GDP strongly reduces the projected damage increase. If both, the different effects of increasing per capita GDP and population, are not separated in the derivation of the damage function (corresponding to the basic model of type 1 in the methods section) projected losses are significantly lower and decrease by a factor 0.62 [0.58, 0.85] towards the end of the century (figure 6(c)).
Figure 6. Amplification of relative future losses per hurricane by rising per capita income. Panel (a): Trends of average losses per hurricane for damage models of basic model type 2 (see methods section) under future socio-economic development according to SSP2. Blue shading indicates the 5%–95% inter-percentile range, lines highlight selected percentiles (median: thick solid line), and black stars show inflation-adjusted historical hurricane losses per national GDP for the period 1991–2012. Panel (b): Magnification of the median loss per hurricane (solid blue line) from panel a together with the separate contribution of GDP per capita and population change on projected losses. While population increase by itself (green line) leads to lower relative losses than projected with present-day socio-economic values (black line), growing GDP per capita (red line) results in substantially higher losses. Panel (c): Loss projections differ significantly whether the socio-economic predictors GDP per capita and population are treated separately (basic model type 2, blue solid line, same as in panel (a), (b) or combined as total GDP (basic model type 1, orange solid line). This difference is larger than the inter-model variability caused by the projections of individual damage models (dashed/dotted lines that span the shaded regions). Each data point in all panels is the decade-median of all simulated hurricane losses based on 8 different damage projections (except for the dashed/dotted lines in panel (c) and 6 GCMs. Loss changes are given with respect to 2010 values.
Download figure:
Standard image High-resolution imageDespite their similar performance in the historical period the separation of the socio-economic predictors turns out to be the major driver of projected losses. Other variations in the damage models such as (1) the different functional representations of the physical hazard as captured by the individual sub-models (shaded regions in figure 6(c) and supplementary figure S9) and (2) the different loss data sets (supplementary figure S10) contribute less to the overall variability of projected losses than the separation of the socio-economic predictors. The spread in projected losses as caused by the individual sub-models can be in large part traced back to their different integration of wind-field data (see figure 6(c), dashed lines: maximum wind-speed at landfall only, dotted lines: local distribution of maximum wind-speed, see also the methods section for details regarding how the wind-field data is integrated by different models). As mentioned above, the contribution of the different loss data sets to overall loss variability is mainly caused by the different time periods covered (see figure 4(a) and supplementary figure S10). When analyzed for identical intervals the spread of projected losses is reduced with an increase of average projected future losses due to a stronger super-linear scaling of losses with per capita income for the period since 1980 in contrast to 1963 (see figure 4(a), supplementary tables S10, S11, and figure S10).
Discussion
All findings presented here are robust across all percentiles and also across different SSP-scenarios (see supplement for details). The observed decrease in losses with increasing population may be explained by the fact that urban areas with higher population density can be more (cost-) effectively shielded against hurricane impacts, e.g. by building levees. The increase in losses with rising income may be caused by an interplay of several reasons: irrational behavior and false risk perception might trigger a non-sustainable investment in high-risk regions, additionally enhanced by the expectation that insurance companies or governmental bodies will share the burden in case of a disaster [31]. Also, conscious investment into high-risk areas because of higher productivity might contribute to our observed finding [32]. It could be investigated further if high-resolution capital stock data were available that more accurately captures local wealth characteristics. In this context, it might also be advantageous to analyze the impact of other hazards, e.g. floods or earthquakes, in order to identify the drivers of the super-linear scaling of losses with rising income.
None of the considered approaches explicitly accounts for storm surges and other hurricane-related hazards (e.g. precipitation). Their importance is, however, implicitly taken into account as e.g. precipitation and storm surges are correlated with storm size and wind-speed. Likewise, the fact that we consistently obtain similar fit results across all our models restricting the wind-speed affected region to coastal counties seems to underline the high loss share of the coastal regions potentially exposed to storm surges (see supplementary tables S6 and S7).
Local changes in vulnerability as may arise due to improved prevention measures (e.g. increased levees or improved building codes) are only indirectly and partially captured using GDP as a socio-economic predictor and may vary across space and time. However, more homogenous efforts of nation-wide adaptation, as e.g. introduced by the National Flood Insurance Program initiated in the late 1960ies [31], might partially account for the increase in explained variances across all our damage functions for more recent periods.
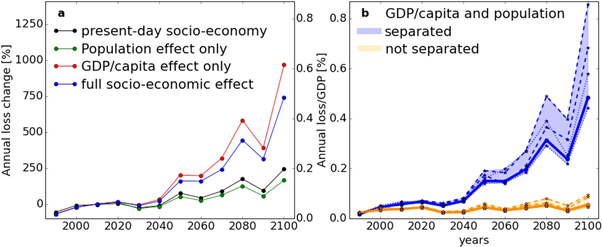
Effects of sea-level rise are not included in our analysis but are expected to lead to higher average losses per hurricane than the here reported tripling by the end of this century [33]. Beyond the intensity change of a single hurricane, frequency changes will contribute to overall annual losses. Whereas some studies expect rather small changes in hurricane frequency for the North Atlantic [28, 34], the downscaling technique applied here projects substantial increases [15] that translate into large increases in annual losses for the Eastern United States, see figures 7 and S12. By 2100 and under SSP2, median annual losses are projected to increase by a factor of 8.4 [3.5, 15.5] for separated socio-economic predictors and by a factor of 1.5 [1.3, 2.5] for unseparated predictors (figure 7(b)). It is thus the interplay of both intensity and frequency changes that determines the total future losses caused in the United States. But as demonstrated here, the income-related vulnerability with respect to a single event remains the crucial handle when adapting to future hurricane impacts.
Figure 7. Projection of median annual hurricane losses under SSP2. Similar to figure 6 but for annual losses that aggregate the impact of changes in hurricane frequency and intensity. Panel (a): Median annual loss for fixed present-day socio-economic values (black line) and under full socio-economic evolution (blue line) together with the separate contribution of GDP per capita (red line) and population change (green line) on projected losses based on the damage models that separate population and income (basic model type 2). Panel (b): The difference in loss projections for damage models that treat the socio-economic predictors GDP per capita and population separately (basic model type 2, blue solid line, same as in panel (a) or combined as total GDP (basic model type 1, orange solid line) becomes even more pronounced on annual scales. Shaded regions show the inter-model variability as caused by the projections of individual damage models (dashed/dotted lines). Each data point is the decade-median of all simulated annual hurricane losses based on 8 different damage projections (except for the dashed/dotted lines in panel (b) and 6 GCMs. Loss changes are given relative to 2010 values.
Download figure:
Standard image High-resolution imageConclusion
We have demonstrated that the predictive skill across commonly used damage functions in reproducing historical hurricane losses is consistently high when analyzed with our newly-designed data set for socio-economic and hazard-related predictors. We also find that a restriction of the analyzed period to more recent years improves the explained variances across all damage functions, potentially caused by higher data quality since 1980. In particular, we distinguished between two sub-classes of statistical models that either separate per capita GDP and population as socio-economic predictors or treat GDP as a single predictor. While the latter predicts losses to scale sub-linearly with rising GDP, the former shows a super-linear scaling of losses with rising income that opposes the current view of higher protection through higher income. Despite their similar performance in reproducing historical hurricane impacts, the opposing nonlinear scaling leads to a divergence of future losses, exceeding all other sources of variability, i.e. the difference in hurricane climatology from different GCMs and the uncertainty caused by different damage models and hurricane loss data sets. Based on the different damage models with separated per capita GDP and population we project that average future hurricane losses will triple with respect to national GDP under climate change and socio-economic development, while future losses for the unseparated damage models are projected to decrease.
Acknowledgments
We are grateful to Kerry Emanuel for providing simulated hurricane tracks for the historical and future climate. We thank Munich Re's NatCatSERVICE for providing assess to their natural catastrophes data base. The work was supported within the framework of the Leibniz Competition (SAW-2013-PIK-5) and by the German Federal Ministry for the Environment, Nature Conservation and Nuclear Safety (11II093 Global A SIDS and LDCs).


