

Abstract
The roles of forest and wetland ecosystems in regulating flooding have drawn increasing attention in the contexts of climate change adaptation and disaster risk reduction. However, data on floods are scarce in many of the countries where people are most exposed and vulnerable to their impacts. Here, our separate analyses of village interview surveys (364 villages) and news archives (16 sources) show that floods have major impacts on lives and livelihoods in Indonesian Borneo, and flooding risks are associated with features of the local climate and landscape, particularly land uses that have seen rapid expansions over the past 30 years. In contrast with government assessments, we find that flooding is far more widespread, and that frequent, local, events can have large cumulative impacts. Over three years, local news agencies reported floods that affected 868 settlements, 966 times (including 89 in urban areas), inundated at least 197 000 houses, and displaced more than 776 000 people, possibly as many as 1.5 million (i.e. 5%–10% of the total population). Spatial analyses based on surveys in 364 villages show that flood frequency is associated with land use in catchment areas, including forest cover and condition, and the area of wetlands, mines (open-cut coal or gold mines), and oil palm. The probability that floods have become more frequent over the past 30 years was higher for villages closer to mines, and in watersheds with more extensive oil palm, but lower in watersheds with greater cover of selectively-logged or intact forests. We demonstrate that in data-poor regions, multiple sources of information can be integrated to gain insights into the hydrological services provided by forest and wetland ecosystems, and motivate more comprehensive assessment of flooding risks and options for ecosystem-based adaptation.
Export citation and abstract BibTeX RIS

Original content from this work may be used under the terms of the Creative Commons Attribution 3.0 licence. Any further distribution of this work must maintain attribution to the author(s) and the title of the work, journal citation and DOI.
1. Introduction
Global initiatives such as The Economics of Ecosystems and Biodiversity, the Intergovernmental Platform on Biodiversity and Ecosystem Services and the Intergovernmental Panel on Climate Change have emphasised the importance of ecosystem services for human well-being and climate adaptation in tropical developing countries. It is in these countries, however, that changes in ecosystem processes and the relationship between changes in land use and land cover (LULC) and the provision of ecosystem services are least understood.
Rapid changes in LULC are causing widespread degradation and loss of tropical ecosystems, impacting many of the services these ecosystems provide [1, 2]. Impacts on forest and wetland ecosystems are particularly important for services linked to the hydrological cycle. These services depend on the landscape's capacity to regulate the quantity of freshwater flows, mitigate damages from flooding and erosion, and influence transport of pollutants, sediments or nutrients [3, 4].
Linkages between LULC change (LULCC) and changes in flooding regimes form a complex and active field of research [5]. Recent reviews have shown that flood frequency and severity are not simply determined by changes from forest to non-forest land cover. Instead, flooding is influenced by the extents of change in vegetation structure and soil qualities, and the scales of the surrounding watershed and rainfall events [6–9]. The most extreme rainfall events can lead to major floods, regardless of land cover, if extensive or prolonged rainfall overwhelms a landscape's capacity to store or slow the movement of water, and the capacity of river channels to conduct floodwaters away [10]. Nonetheless, when considering rainfall events that are less extreme (and so more common), ecosystems can strongly influence flood peaks and velocities [11–14]. Conversion of natural ecosystems to more intensive land uses alters watershed hydrology in three main ways: (1) changes in vegetation and soils alter water cycling, storage and movement by reducing canopy interception of rainwater, soil saturated water content, infiltration rates and hydraulic conductivity, and rates of evapotranspiration [6, 15]; (2) impervious surfaces and linear networks such as roads or footpaths alter the paths and speed of water movement, especially if they act as direct conduits for run-off to streams [16]; (3) erosion, landslips, sedimentation and scouring associated with land cover change alter river channel morphology [17].
Both major floods and smaller, more frequent floods can have large impacts on human lives, health and livelihoods [18]. Impacts include direct loss of life, injury, disease and displacement; damage to agriculture, industries and the built environment; and disruption of essential services such as water, healthcare and education [18]. Changes in LULC can also influence human vulnerability to the impacts of flooding, through changes in human settlement patterns and societal capacity to mitigate or adapt to flooding [19, 20].
For tropical climates and developing countries, most of the existing studies relating flood occurrence or impacts to LULCC and/or socio-economic factors [e.g. 21, 22] have been based on global datasets [23, 24]. However, these datasets are highly incomplete for many countries, even for the high-impact events that are their focus [9, 25]. Given this scarcity of data, local knowledge can form a vital source of insights into current impacts and drivers of change in flooding events [26].
In this study, we employ novel data sources from village interviews and news archives to assess the frequency and impacts of flooding on local communities in a tropical biodiversity hotspot, Indonesian Borneo [27]. Studies of flooding or relations to LULCC have been rare, and to our knowledge, this is the first to cover all of Indonesian Borneo. Past studies consist of historical descriptions of floods in the 17th–19th Centuries [28]; and hydrological simulations in specific river basins, for example showing increasing downstream flooding due to degradation and subsidence of peatlands in Central Kalimantan [29]; and higher wet season discharge (and lower dry season discharge) due to forest and peatland degradation in Kapuas, West Kalimantan [11].
Our objectives were to: (1) map patterns of flooding across Indonesian Borneo, through statistical modelling of recent flood frequencies and perceived trends in frequency over the past 30 years; (2) compare the maps of flood hazards generated from two independent sources of data on recent flooding (interviews and news archives); and (3) explore the relationships between flooding and the social and environmental features of each watershed, including LULC. We demonstrate the large scope for information from interview and news sources to rapidly improve the accuracy and resolution of flooding assessments. This approach has great utility in data-poor environments where floods have substantial impacts on human livelihoods and wellbeing.
2. Methods
2.1. Study region
Borneo is the world's third largest island, located in South-East Asia, encompassing regions of three countries: Indonesia, Malaysia and Brunei Darussalam (4.242° S–6.965° N, 108.883° E–118.990° E). Borneo's native ecosystems host some of the highest levels of biodiversity globally and include various (and often threatened) vegetation types such as mangroves, lowland dipterocarp tropical forests, peat swamp forests and montane rainforests [30]. These forested systems not only harbour some of the world's most iconic species such as the Bornean orangutan (Pongo pygmaeus) [31] and proboscis monkey (Nasalis larvatus) [32], but also provide essential and varied ecosystem services to some 25 million people across Borneo [26, 33]. Current rates of deforestation and forest degradation, however, are among the highest in the world [34–36], thereby threatening such services. Mean annual rainfall is generally high yet variable [range: 1520–4820 mm; 37]. Heavy rainfalls can lead to severe flooding, especially in lowland and coastal areas [38], which are often targeted for conversion to oil-palm agriculture [36, 39]. Our study focused on riverine and flash flooding in Kalimantan (i.e. Indonesian Borneo), which covers 76% of the island's total area.
2.2. Rivers and watershed data
We delineated rivers and watersheds in Borneo using a hydrologically corrected Digital Elevation Model at 3 arc-second resolution, and ArcHydro 2.0 tools in ArcGIS 10.2 [40] (see S1—supplementary methods, S1.1). We defined 'major rivers' by a minimum drainage area of 200 km2, and the finer network of 'all rivers' by a minimum drainage area of 20 km2. We defined watersheds as areas draining to the ocean, and delineated subwatersheds as the area draining to each link of the major rivers. For any point of interest, the 'relative watershed' consists of the surrounding subwatershed, combined with any upstream subwatersheds (i.e., all areas that contribute to flow through the focal subwatershed).
2.3. Interview surveys—villagers' perceptions of flooding
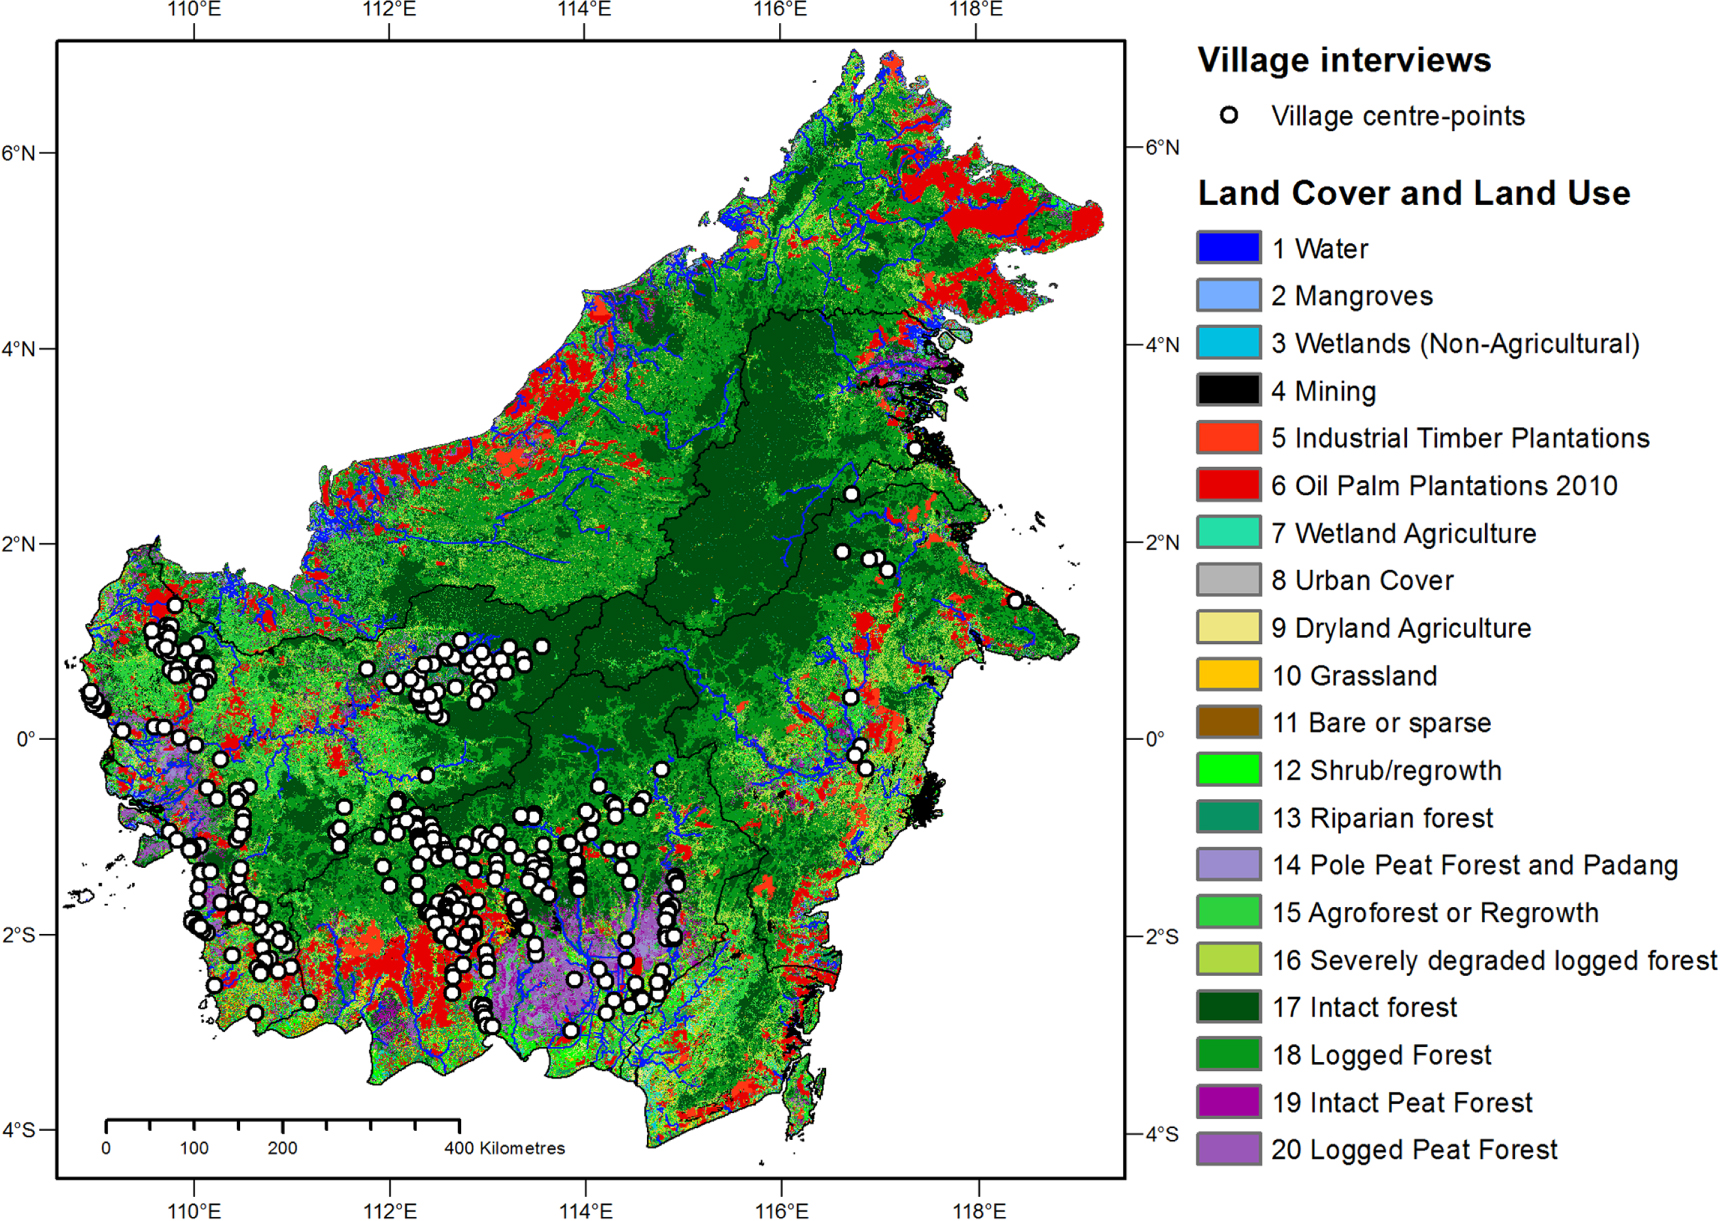
We surveyed village leaders' perceptions of flooding in 364 villages across Kalimantan (figure 1, and figure S1), through interviews with the village head or other official. These interviews were conducted during April–October 2009 (341 villages) and April–October 2012 (23 villages), and were drawn from a larger survey on villagers' perceptions of forests and wildlife, in villages selected at random within 10 km of forests in the approximate range of the Bornean orangutan (i.e. sampling was random with respect to past or present flooding). The larger survey comprised two sets of interviews: (1) the village-level interviews, which we analyse; and (2) interviews on villagers' individual perceptions with 7–12 respondents per village, which we do not analyse, and which formed the basis for previous studies of wildlife and ecosystem services [26, 33].

Figure 1. Map of interview surveys in 364 villages in Indonesian Borneo (conducted 2009–2012), land use and land cover in 2010 (SarVision and Borneo Futures), and Province borders.
Download figure:
Standard image High-resolution imageOur study selected the 364 villages within Kalimantan, for which village-level interviews gave detailed responses to questions on flooding. A 'flood' was defined as either a riverine flood or flash flood, in which floodwaters covered the village's main road or path at the centre of the village. We coded responses regarding (1) the frequency of flooding over the past five years (n = 302 villages; coded as 5 classes representing frequencies of 0, 0.1, 0.5, 1 and 2+ floods per year) and (2) trends in flood frequency over the past 30 years (n = 260; responses to the question 'has the frequency of floods declined, stayed the same, or increased over the past 30 years?' were coded as: decline, no change, or increase in flood frequency). For the flood trends, a 'decline' was reported in only 2 of 260 villages (S2.1), so we excluded this class, and modelled flood trends as presence/absence data, i.e. whether flood frequency increased (presence) or showed no change (absence). Further details of the interview methods, quality assessments, and coding are given in S1.2.
2.4. Newspaper reports of flood events and damages
We obtained flooding reports from the online archives of six news agencies in Kalimantan, covering 16 regional newspapers, using the search keyword 'banjir' (flood). We collated data from all articles that reported flooding in Kalimantan over 3 years, 20 April 2010–29 April 2013, and that gave estimates of flood height and/or flood impacts (see S1.3). We georeferenced flooding locations using Google Earth and census administrative boundaries. We estimated flood impacts for each flooded settlement as the number of people affected, and number of houses flooded. If a numeric value was not reported directly for a settlement, we assigned low, median and high estimates (based on the median, 10th and 80th percentiles from the statistical distributions of the number of houses and number of people affected per flooded settlement), enabling calculation of summed impacts across all the separate flood events (table S1).
2.5. Relationships with LULC and topographic variables
We performed spatial analyses separately for each of the three datasets: (1) village flood frequency from village interviews over the past five years (n = 302 villages); (2) village flooding trends over the past 30 years (n = 260 villages); and (3) news reports of flood events (n = 380 settlements, i.e. villages, towns or urban areas) (figure S1). We analysed each dataset in relation to 35 spatial predictor variables ('landscape variables'—see S1.6) to assess statistical relationships between flooding and LULC in each watershed (20 LULC classes), soil types and water storage capacities, topography (slope, elevation), climate (temperature and rainfall seasonality and monthly maximum), infrastructure (impervious surface area, and road densities), and socio-economic factors (population density in 2011, and proportions of the population by religion and ethnic group). Initial models included all spatial predictors; final models included those contributing >1% of explained variance.
We performed statistical modelling using Boosted Regression Tree (BRT) models with five-fold cross-validation [41] in the R statistical environment [42, 43]. BRT methods combine many regression trees to form an ensemble model, providing a flexible and robust method for both (1) quantifying relationships and contributions (including nonlinear relationships with the response, and interactions among predictors), and (2) generating predictions for new areas or datasets [41]. Further details of model fitting and assumptions are given in S1.4. We used the resulting models to generate predictions for all populated areas across Kalimantan (S1.4). Model performance was assessed via deviance reductions, cross-fold correlations and estimates of classification error (detailed in S1.4, S2.2).
3. Results
3.1. Villagers' perceptions of flooding
In 58% of villages (176/302), respondents reported flooding frequencies of one or more times every year over the past 5 years (S2—supplementary results, table S2). Only 10% of villages reported no experience of flooding. Approximately 20% of all villages reported that floods had become more frequent over the past 30 years (table S2; as mentioned in methods 2.3, only two villages or 0.8% reported declines in frequency, and were excluded from modelling of flood trends). The association between flood trends over 30 years, and current frequency over 5 years, was positive but not tight (figure S2); i.e. villages that perceived an increase in flood frequency, reported current frequencies that still span a wide range, from occasional to more than once per year. Current flood frequencies were generally consistent for villages on the same stretch of a river, and either similar or lower for villages further upstream. For example, when looking at the villages with annual or more frequent floods, other villages further upstream (>3.2 km) usually reported similar or lower flooding frequencies (mean difference between frequencies −0.24 floods per year, range 1 to −2; figure S3).
3.2. Newspaper reports of flood events and damages
Over the period 20 April 2010–29 April 2013 (3 years), 414 news items reported at least 142 distinct flood events affecting 966 settlements in Kalimantan. Quantifying the total impacts over the 142 flood events between 2010 and 2013 (table S7), we estimate that 197 000 to 360 000 houses were flooded (based on the median and 80th percentile of the distribution of houses flooded per event, respectively, table S1), directly displacing 776 000 people (possibly as many as 1.5 million, based on the 80th percentile method).
Flood events on average affected five settlements, and 60 settlements were flooded in two or more of the events. Flooding was reported in 32 major urban areas and 836 other settlements. Observed locations of flooding based on newspaper reports (2010–2013) and village interviews (2008–2011) showed strong spatial agreement. Almost all interviews from villages close to sites of newspaper-reported floods (within 4 km overland or 60 km downstream of villages) reported experiences of moderate to high flood frequencies (every two years or more frequent).
The most frequently quantified impact of flooding reported was the number of houses flooded, and the number of people directly affected. Other impacts were frequently described, but not quantified, for example 'residents could not work', 'schools were closed', or croplands, plantations, schools, businesses or health facilities were flooded. Financial impacts were often mentioned, but rarely enumerated. Government budget allocations, however, are clearly high: for example the Government of East Kalimantan allocated 605 billion Rupiah (c. US$50 million) for flood mitigation in one city alone from 2011–2013, primarily for four systems of structural defences along the Mahakam River [44].
3.3. Relationships between flooding and landscape variables
The village interviews and news-reported floods provide two distinct lines of evidence for the existence of frequent and widespread flooding, and for examining the relationships between flooding and landscape variables. BRT models showed very high performance for all datasets (table S3), and key predictors are shown for each analysis in figure 2. The influence of each class of landscape variable (LULC, climate, topography etc) is summarised in table 1. The influence of each landscape variable is computed from substantial cross-validation, giving a robust estimate of the variable's contribution to the model's predictive goodness-of-fit. Interactions among predictors are naturally incorporated in the tree structure of the models.

Figure 2. Influence of selected landscape variables on (a) village flood frequency over the past five years, (b) village trends of increasing flood frequency over the past 30 years, and (c) likelihood of a news-reported flood during 3 years April 2010–2013. Each plot shows the BRT model's fitted function for a flooding variable (y axis) versus values of a predictor variable (x axis). Mines are open-cut coal or gold mines. All distances are in metres. Wetlands SWS, Oil palm SWS, or Logged area SWS gives the cover of wetlands or oil palm or logged forest, as a percentage of the area of the local subwatershed. Plots in each row share the same scale on the y axis, and show the magnitude of change in predicted values (when integrated over all other variables), relative to the mean prediction (the grey line through zero). For flood frequency (top row), predictions are power-scale frequencies scaled to a mean of zero. For flooding trends and news-reported floods, the values are logit-transformed probabilities, scaled to a mean of zero. Each predictor variable's contribution to the model is given in brackets (% of explained variance), and the observed distribution of the predictor variable is shown by vertical lines above the x axis, marking deciles of the distribution across settlements. Expanded figures showing the top six predictors for each analysis are given in S2 supplementary results.
Download figure:
Standard image High-resolution imageTable 1. Influence of landscape variables on flooding patterns, as a percentage of total variance. Values give the percentage of total variance that is attributed to each class of landscape variables (i.e. the percentage of the dataset's total variance, not explained variance). The percentages sum to the total variance accounted for by each model.
| Variable class | Village flood frequency | Village flood trends | News-reported floods |
|---|---|---|---|
| LULC | 29.8 | 24.5 | 24.0 |
| Hydrography | 11.5 | 4.5 | 36.0 |
| Topography | 7.1 | 6.3 | 7.5 |
| Population and infrastructure | 4.2 | 3.8 | 12.7 |
| Climate | 3.2 | 9.1 | 1.5 |
| Soils | 3.0 | 1.6 | 2.7 |
| Model total | 58.8 | 49.9 | 84.4 |
LULC variables accounted for 24.0%–29.8% of the total variance in each dataset (corresponding to 28.4%–50.7% of the variance explained by each model). We note that some of the effect of soil or edaphic changes will be represented here by LULC variables, due to the nature of peatlands and wetlands as both landcovers and hydroecosystems.
Predictions for settlements across Kalimantan are mapped for village flooding frequency in figure 3, village flooding trends in figure 4, and news-reported floods in figure 5.

Figure 3. Map of flood frequencies from village interviews, and modelled predictions for populated areas of Kalimantan. Interview data is from 302 villages. Flood frequency predictions were generated for populated areas (centre points of 1 km cells with population density >1.2 km–2, except dense urban areas) from BRT models relating the villages' flood frequency to 35 environmental and social predictor variables. Inset map: detailed view of the area of West Kalimantan (expands the area of the grey box in the main map).
Download figure:
Standard image High-resolution image
Figure 4. Map of flooding trends over the past 30 years (decline, no change or an increase in flood frequencies over the last 30 years), showing observed trends from interviews in 232 villages, and modelled predictions for populated areas of Kalimantan. Trend predictions estimate the relative likelihood that an area has experienced an increase in flood frequencies. Crimson and red areas are those where a trend is predicted (i.e. the modelled value is above the threshold optimised for distinguishing absence versus presence of a trend). Predictions were generated for populated areas (except dense urban areas) from BRT models relating presence/absence of an increase in flood frequency (from village interviews) to 35 environmental and socio-economic variables. Inset map: detailed view of the area of West Kalimantan (expands the area of the grey box in the main map).
Download figure:
Standard image High-resolution image
Figure 5. Map of news-reported floods and modelled flood probabilities for populated areas of Kalimantan. Points show the locations of 380 news-reported floods over the period April 2010–April 2013. Predictions were generated for populated areas from BRT models relating the presence/absence of reported floods to 35 environmental and socio-economic variables. Predictions give the relative probability of a flood occurring over a 3 yr period, under conditions similar to those experienced in April 2010–April 2013. Mid and dark red areas are those where flooding is predicted (i.e. the modelled value is above the threshold optimised for distinguishing absence versus presence of a reported flood, 0.42). Inset map: detailed view of the area of West Kalimantan (expands the area of the grey box in the main map).
Download figure:
Standard image High-resolution imageLULC variables consist of distance and area metrics for 20 LULC classes. Hydrography consists of distance to the nearest river systems, and watershed extents. Topography consists of slope, elevation, and distance to coastline. Population and infrastructure consist of population densities (2011), road densities, and urban cover (2010). Climate refers to long-term mean precipitation and temperature variables (1950–2000). Soil variables consist of soil family (oxisol, histosol etc) and changes in soil saturated water content under non-native LULC.
As expected, the frequency of recent flooding (in the past five years) was lower in villages located far from rivers and at higher elevations (figure S4). Both the recent frequency, and the likelihood of a long-term increase in frequency (trend over the past 30 years), were lower for villages near to natural wetlands and when natural wetlands covered a large proportion of the watershed (figure 2, S4, S10). A long-term increase in flood frequency was more likely for areas <200 km from the coastline or on flatter slopes, and in areas with lower long-term average rainfall of the wettest month (less than 400 mm; possibly reflecting lower historical flood frequencies that made any increases in frequency more noticeable), or with higher rainfall seasonality (figure S10).
The frequency of recent floods and the probability of flooding trends over the past 30 years were both larger for villages closer to mines (figure 2), and all 31 villages in watersheds with >0.5% cover of mines were predicted to experience flooding at least every 2 years (figure S6). Flood frequencies were also higher for villages close to other open or disturbed landcovers (e.g. bare or grassed areas and open peatlands).
Recent flood frequencies were slightly lower in watersheds with larger areas of peatland upstream (figure S5), while villages located very close to peatlands were more likely to have experienced an increase in flood frequency over the past 30 years (figure 2). This difference between villages in watersheds with upstream peatlands, versus villages within or near peatlands themselves, is consistent with peatlands having a role in regulating the floodwaters that reach downstream areas, even if flooding of peatlands themselves has increased in some areas over the past 30 years.
For flooding trends, an increase in flood frequency over the past 30 years was less likely in watersheds with greater cover of logged or intact forests, and more likely in watersheds with more extensive oil palm plantations (figure S11). Recent flood frequencies were lower in watersheds with higher cover of logged forests or agroforest/regrowth cover (figure S7). Regarding distance to logged forests, villages very close to the nearest logged forests (<5 km) were predicted to have higher mean recent flood frequencies (figure 2), but were no more likely to have experienced long term increases in frequency. The association with recent frequencies could arise, for example, if logged forests that occurred in areas that naturally flood frequently, were more likely to be left standing (and not converted to other land uses), than forests in less frequently flooded areas.
Of the news-reported flood events, strong positive relationships were identified with the distance from rivers (especially major rivers) and urban areas, higher impervious cover and lower forest cover (figure 2, table S9). Flooding probability increased sharply as impervious surface cover increased from 0%–3% (measured at subwatershed level), without further increases beyond this threshold. Floods were also more likely in watersheds with higher oil palm cover, or at larger distances from intact forest or agroforest/regrowth (table S9). In relation to wetlands, news-reported floods were less likely in subwatersheds with more wetlands (>4% cover), and floods were slightly less likely in watersheds with greater peat soil areas. Despite strong relationships with urban and impervious cover, the news reports did not appear to be biased to only reporting floods in densely populated areas. This is based on three observations, (i) the reports spanned the full range of population densities, and 71% of flooded settlements were rural villages or towns (not cities); (ii) reports also covered areas 220 km from the coastline (figure S14); (iii) predicted flooding was more likely within 50 km of an urban area, but showed no further decline with distance.
Population variables (2011 population density in the local area or the watershed) contributed very little to any of the BRT models. Population effects per se can be a concern in studies of flooding trends because of the risk that perceived trends are due to changes in flood detection (exposure and observation), rather than flood occurrence. However, we conclude that village leaders' perceptions of trends in flood frequency over recent decades are largely independent of population per se, and flooding trends relate more to biophysical changes in the landscape that are captured by other variables. This conclusion is based on our definition of a village flood event (flooding of the main road or path, which is less sensitive to population size than other definitions such as a number of houses flooded), the very small effects attributable to current population size, and the lack of detectible effects of population growth at district level (see supplementary results 2.1).
3.4. Comparison of predictions from alternative data sources: village interviews versus news-reported floods
Comparing models based on the two independent data sources (village interviews and news reports), we note strong similarities in the relationships estimated between flooding and landscape variables, and strong spatial concordance in those areas at low or high flooding hazards (figure 6, S16). Regarding relationships with landscape variables, some variables differ in the relative strengths of their influence between the analyses (i.e. % of explained variance), for example, the news dataset spans a larger range of population densities and impervious cover, giving greater power to detect their influences. However, even where the percentage of variance differs, the relationships show similar functional forms in both analyses (figure 2 and supplementary figures S4, S10 and S14).

Figure 6. Spatial comparison of predicted flooding hazards based on village interviews versus news reports. Darker colours indicate higher flood frequencies predicted from village interviews (flood frequency over the past 5 years, mainly 2004–2009). Red colours indicate areas where news-reported floods were predicted to occur (higher relative likelihood of a news-reported flood over the 3 yrs April 2010–April 2013). Darker reds therefore indicate areas where both data sources gave predictions of high flooding hazards. Green colours indicate areas where flooding was not predicted from news reports. Pale greens therefore indicate the areas agreed by both data sources to have low flooding hazards. Dark green indicates high village flood frequencies in areas where news-reported floods were predicted to be absent. Model details: Predictions were generated for populated areas from BRT models relating either village flood frequencies (over the past 5 yrs, mainly 2005–2009), or news-reported flooding (presence/absence of reported floods over the 3 yrs April 2010–April 2013), to 35 environmental and socio-economic variables. Predictions from each model (continuous values for 1 km2 pixels) were grouped into classes to enable visual comparison. News-reported floods were predicted to occur where pixel values were above the threshold of 0.427. Inset map: detailed view of the area of West Kalimantan (expands the area of the grey box in the main map).
Download figure:
Standard image High-resolution image
Comparing predictions of village flood frequencies versus news-reported floods (figure 6), we see strong spatial concordance in the areas predicted by both datasets to have high flooding hazards (dark reds), or low flooding hazards (pale greens). News-reported floods were very rarely predicted to occur in areas where the village models indicated low flood frequencies (pale reds). The main difference in predictions occurs in areas where village interviews predicted high flood frequencies, but news-reported floods were predicted to be absent (dark greens). These areas are usually further from major rivers or urban centres, and may reflect lower coverage by news reports of areas that are more remote, or of floods that are very regular or affect very small populations. Further detailed comparisons are given in S2.6.
Comparing predictions of village flood trends, we found that news-reported floods were more likely in areas that were also predicted to have experienced a trend in village flooding (i.e. where village flood frequencies were predicted to have increased over the past 30 yr, table S13). Spatial concordance is marked (figure S16), though not as strong as for village flood frequencies versus news reports (figure 6).
4. Discussion
The experiences of villagers interviewed in this study indicate that flooding patterns have changed considerably over recent decades. Nearly 60% of villages reported flooding one or more times per year, and floods were perceived to have become more frequent over the past 30 years in approximately a quarter of villages that ever experienced floods. Historically, flooding has formed an important natural process on Borneo. Early flood impacts on Bornean societies are reflected in oral traditions and historical writings [28]. In areas of seasonal or periodic flooding, people have traditionally lived in dwellings high above the ground, and some flooding may have been welcomed for beneficial consequences such as nutrient input into alluvial areas, or abundant fish supplies following floods [45]. Larger or unexpected floods however often had clearly negative impacts on swidden agriculture, food supplies or caused epidemic disease outbreaks [46, 47]. Currently available data do not enable a quantitative analysis of changes through time, based on empirical measurements of flood heights or volumes. Nonetheless, our independently collected datasets on local knowledge and news reports give a strong indication of the direction of change, and of large, current impacts.
Landscapes throughout the tropics have undergone rapid changes over recent decades, and growing pressures on land and water resources give great urgency to understanding the roles of natural and modified ecosystems in regulating flooding. Relationships between flooding, vegetation and soils are complex, and oversimplifications have been the source of major contention [7]. If only a single distinction is made between 'intact versus modified' land covers, this ignores immense variation within these classes, for example intensive cropping versus multi-story agroforests [48]. Secondly, it is clear that extremes of prolonged and heavy rainfall can overwhelm storage capacities of soils and aquifers, and lead to flooding whatever the dominant land cover. Acknowledging this complexity, recent hydrological studies have emphasised that forest ecosystems, especially those with intact soils and groundcover, can slow water movement and reduce flood peak volumes and velocities from rainfall events that are smaller but occur more often than those causing massive disasters [9, 11, 13, 14, 49].
Our analyses have found that flooding probabilities and reported trends in flooding are related to landscape features, especially the extents of impervious cover, open coal and gold mines, oil palm plantations, the extent and condition of forests and wetlands, and changes in soil water storage capacity. These findings are supported by the similarity of results from two independent data sets.
Wetlands and peatlands appeared to have a protective role in relation to flooding in village survey analyses, and to a smaller extent in the news analyses. Larger upstream areas of wetlands and peatlands are associated with lower flood frequencies. Logging or clearing of peatlands may have contributed to increasing flood frequency over the past 30 years, since these trends were associated with larger areas of logged, open canopy or bare peatlands, and were common among villages surveyed in eastern Central Kalimantan where large peatland areas have been converted to plantation agriculture [e.g. 50]. This is consistent with studies from across Indonesia on the hydrological consequences of clearance and drainage of wetlands and peatlands [29, 51]. In peatlands of Sumatra and Kalimantan, those studies show that deforestation and drainage clearly increases local flooding and leads to higher flood peaks (and lower baseflow) within and downstream of peatlands [52]. For peatlands at the lowest elevations, subsidence is projected to lead to loss of drainability and eventually to permanent inundation [29, 53]. A recent study of Peninsular Malaysia's river basins [9] found that while flooding (days flooded per month) was increased by deforestation of inland forests, flooding appeared to have reduced when the forests converted were wetland forests (peat swamps and mangroves). The authors suggested that improved drainage of peatlands may reduce flood peaks by reducing antecedent water levels, but this effect appears to have been small or absent in the Indonesian studies. It is also possible that flooding observations in [9] may not reflect conditions within or downstream from peatlands, since the spatial relations between the peatlands and the observation points for river heights are unknown.
The hydrological effects of land use change occur in large part through changes in soil physical properties and ground-level cover [6, 54, 55]. In our analyses, flooding increased slightly with changes in soil water storage capacity of the upstream watershed (estimated from present versus natural LULC), but effects appeared small in relation to the effects of peatlands and other wetlands. However, available soil data is very limited in information on depth and especially on current condition (affecting infiltrability, conductivity and network connectivity). We were only able to estimate soil degradation via association with LULC classes, and although this association is generally strong, there are some land uses within which soil condition may vary widely (especially agroforest/regrowth), and the temporal dynamics of soil degradation and recovery can also have important consequences for hydrological services [8].
Our analyses highlight several relationships, and motivate further studies to clarify hydrological mechanisms, and the effects of specific management systems, and to enable quantitative projections under alternative land use and climate change scenarios. In particular, they highlight an urgent need to better understand the hydrological effects of oil palm plantation design and management [56], and demonstrate that the spatial distributions and roles of wetlands and peatlands in regulating flooding, deserve strong focus in future research. Existing maps of peatlands show large underestimations and uncertainties compared to the small areas where detailed depth studies have been conducted [29]. New initiatives for mapping of peat depths [57] have been completed only for small pilot areas, but further mapping will also be essential to implement new legislation requiring protection of peatlands [58].
By analysing an independent dataset of news reports over three years, we start to gain a picture of frequent and extensive impacts from flooding. We emphasise that our quantitative estimates understate the full magnitude and range of impacts beyond flooding of houses, which include effects on agriculture, education, business, and health. Our analyses consider only riverine and flash flooding, and overall flooding impacts would be higher when considering coastal flooding from storm surges and tidal inundation (alone or in interaction with riverine floods). Even while the full social and economic impacts of flooding on Borneo are not yet known [39, 59], it is clear that planning for mitigation and adaptation is not yet given adequate priority by local and national governments. Our survey of news articles found they were most often focused on immediate impacts and emergency responses, but often also made links to land use and especially deforestation and mining. Examples include articles from South Kalimantan, where disaster preparedness officials attributed floods to mining on mountain slopes [60], and from East Kalimantan, where many reports attributed floods to impacts of coal mines [61, 62]. Mining, especially of coal, has undergone extremely rapid expansion in Kalimantan since 2004 [63]. In our analysis, areas downstream from coal or gold mines experienced higher flood frequencies and likelihood of increases over the past 30 years, indicating a strong need for quantifying mining impacts on hydrology and river systems, and comprehensive collation of data on industrial scale and small-scale, often informal operations.
4.1. Comparison with government records and risk assessments
Government knowledge of flood events in Borneo appears to be fragmented and highly incomplete. While national and regional governments on Borneo acknowledge that floods represent major economic and social costs [64, 65], quantitative data and assessments are lacking, especially for regional areas (S2.7). Indonesia's National Action Plan for Disaster Management 2010–12, for example, does not include a detailed flood risk assessment [66]. We compared our estimates from news-reported floods with records from Indonesia's publicly accessible online Disaster Loss Database (DiBi—Data dan informasi Bencana Indonesia) for the same time period. This national database is a model of data transparency and accessibility, however the data it contains is highly incomplete, and dramatically underestimates the number of large flooding events and their impacts (tables S14, S15). For example, the single largest event in our newspaper survey was reported by the regional South Kalimantan Disaster Management Agency to have flooded 24 889 houses in 299 villages along the Martapura River in April 2010 (table S14). The same disaster is recorded in the national database as affecting 929 people, and causing 5 deaths. Overall, the number of people reported in the DiBi database to be impacted by flooding is 10–100 times smaller than that estimated from the newspaper records, for all provinces except Central Kalimantan (table S15).
Indonesia's national methods for flood reporting and risk assessment are geared to prioritisation of emergency response to intensive disasters, i.e., high impact events that affect large, spatially concentrated populations, such as those in the capital Jakarta. However, they have been based on brief and incomplete time series of events, and need to better integrate the monitoring efforts of local and regional agencies (S2.7). Governments do not adequately assess or act on large cumulative risks from events that affect more spatially distributed populations, or occur at high frequency, and add up to large impacts over a region or time period. We also note that the existing method for risk assessment only considers areas with major settlements or agricultural production, and for which ≥1 major event appear in the (incomplete) national database, giving a map with no predicted hazard or risk level for the majority of the land area of Kalimantan (figure S18). The importance of disasters of lower magnitude but high frequency has been highlighted in recent studies in Indonesia, Bolivia, Mexico, Mozambique, Nepal, the Philippines, and Vietnam showing negative impacts on children's education, health, and access to services such as water and sanitation [18]. Note that we do not advocate replacing disaster reporting mechanisms with news surveys. These comparisons indicate the need to support consistent recording at the local level (and maintain existing efforts by agencies such as the South Kalimantan Disaster Management Agency). Secondly, they indicate the scope for better communication of flood events and impacts among local and Provincial authorities, and incorporation into national databases.
5. Conclusions
The results from our studies of both interviews and news reports show that flooding is an important and widespread social and economic problem in Kalimantan. We have identified large areas that experience high flooding hazards, and associations between flooding frequency (and perceived trends) and LULC that call for further investigation. Furthermore, flooding hazards are projected to increase over this century due to climate change intensifying regional water cycles and rainfall events [67–69], sea level rise [68], and modification of coastal ecosystems including drainage of lowland peats, leading to rapid subsidence [53]. Finally, these changes in flooding hazard are likely to combine with increases in flooding exposure and vulnerability as population densities increase in cities and many rural towns and villages over the coming decades [70].
Clearly there is a need, alongside emergency preparedness and response [71], for long-term risk reduction and adaptation. Deeper understanding of the relationships between LULCCs and the risks of flooding would help inform flood mitigation and adaptation strategies, and enable a fuller understanding of the consequences of conversion or conservation of natural and modified ecosystems. Recognising the longer term impact of land use decisions on environmental services such as flood prevention would make an important contribution towards securing a more sustainable future in Borneo.
Acknowledgments
We thank the many respondents who volunteered information in the interview surveys, and thank The Nature Conservancy for funding the surveys and providing access to this dataset. We are grateful to staff from CIFOR (The Center for International Forestry Research), the World Agroforestry Centre, and the River Basin Planning section of the Indonesian Government Ministry of Public Works, for discussing data sources and their current research on floods and forests. KAW and JW acknowledge funding from The University of Queensland and the Australian Research Council (ARC) Future Fellowship FT100100413 and ARC Centre of Excellence program CE110001014. KM also acknowledges support from the ARC. The Borneo Futures network acknowledges financial support from the United Nations Environment Program (DEPI Regional Office for Asia and the Pacific) and the Arcus Foundation.