

Abstract
Understanding the causes and consequences of rapid environmental change is an essential scientific frontier, particularly given the threat of climate- and land use-induced changes in disturbance regimes. In western North America, recent widespread insect outbreaks and wildfires have sparked acute concerns about potential insect–fire interactions. Although previous research shows that insect activity typically does not increase wildfire likelihood, key uncertainties remain regarding insect effects on wildfire severity (i.e., ecological impact). Recent assessments indicate that outbreak severity and burn severity are not strongly associated, but these studies have been limited to specific insect or fire events. Here, we present a regional census of large wildfire severity following outbreaks of two prevalent bark beetle and defoliator species, mountain pine beetle (Dendroctonus ponderosae) and western spruce budworm (Choristoneura freemani), across the US Pacific Northwest. We first quantify insect effects on burn severity with spatial modeling at the fire event scale and then evaluate how these effects vary across the full population of insect–fire events (n = 81 spanning 1987–2011). In contrast to common assumptions of positive feedbacks, we find that insects generally reduce the severity of subsequent wildfires. Specific effects vary with insect type and timing, but both insects decrease the abundance of live vegetation susceptible to wildfire at multiple time lags. By dampening subsequent burn severity, native insects could buffer rather than exacerbate fire regime changes expected due to land use and climate change. In light of these findings, we recommend a precautionary approach when designing and implementing forest management policies intended to reduce wildfire hazard and increase resilience to global change.
Export citation and abstract BibTeX RIS

Original content from this work may be used under the terms of the Creative Commons Attribution 3.0 licence. Any further distribution of this work must maintain attribution to the author(s) and the title of the work, journal citation and DOI.
1. Introduction
Forest ecosystems play a vital role in the biosphere, but anthropogenic climate change and shifting disturbance regimes threaten to destabilize the ecosystem services that forests provide from local to global scales (Kurz et al 2008, Littell et al 2010, Seidl et al 2011, Turner et al 2013). Indeed, the indirect effects of climate change on forests via disturbances (including wildfires, insect outbreaks, introduced species, and pathogens) are expected to exceed the direct but more gradual effects of warmer temperatures (Ayres et al 2014, Hart et al 2015). In an era of rapid, nonlinear changes in the Earth system, understanding the causes, consequences, and feedbacks of forest disturbances is a crucial scientific and policy frontier.
Disturbance interactions—when one disturbance influences the likelihood, extent, or severity of another (Paine et al 1998, Simard et al 2011, Buma 2015, Meigs et al 2015a)—are a particularly important example of feedbacks that could be reinforced under novel climatic conditions (e.g., persistent drought (Turner et al 2013, Harvey et al 2014b, Hart et al 2015)). In western North America, insect outbreaks and wildfires are the two most ecologically and economically significant natural forest disturbances (Westerling et al 2006, Kurz et al 2008, Hicke et al 2013). Both disturbances have been widespread in recent decades and are projected to increase in response to climate and land use change (Hessburg et al 2000, Westerling et al 2006, Raffa et al 2008, Bentz et al 2010, Littell et al 2010, Ayres et al 2014). By killing trees and redistributing forest fuels, insect outbreaks influence fire regimes in many parts of the world, and recent large outbreaks have sparked acute societal concerns about potential insect–fire interactions and impaired ecosystem resilience (Hicke et al 2012, Harvey et al 2014b, Jenkins et al 2014). For example, based on the implicit assumption that insect outbreaks increase wildfire hazard by generating abundant dead fuels, the 2014 US Farm Bill designated $200 million annually to support fuel reduction activities across 18 M ha of US National Forest lands affected by diseases and insects (Agricultural Act of 2014, Hart et al 2015).
Despite concerns about altered fire regimes and insect–fire interactions, recent studies indicate that insect outbreaks generally do not increase wildfire likelihood (Lynch and Moorcroft 2008, Kulakowski and Jarvis 2011, Flower et al 2014, Hart et al 2015, Meigs et al 2015a). When they do overlap, however, key uncertainties remain regarding the influence of insect outbreaks on subsequent wildfire severity (Hicke et al 2012, Harvey et al 2014b, Hart et al 2015). Specifically, although insect-caused tree mortality may increase the flammability of canopy fuels at fine scales in time and space (Jolly et al 2012), a pivotal question in contemporary environmental management is whether these insect-altered fuels increase burn severity (i.e., ecological impact; a major fire regime component) at broader spatiotemporal scales. If insect outbreaks do amplify subsequent fire effects, the resultant compound impacts may hasten climate-induced shifts in disturbance regimes toward more severe fire and altered ecosystem structure and function. Conversely, if insects buffer subsequent fire effects by redistributing fuel density and/or availability, recent widespread outbreaks may bolster ecosystem resistance to shifting fire regimes. Empirical studies that identify particular time lags and locations where insect-altered fuels either exacerbate or dampen fire effects on surviving trees are directly applicable to time-sensitive management activities (e.g., post-insect salvage logging, fuel reduction at the wildland–urban interface) as well as broader policy discussions of forest health in a time of shifting disturbance regimes.
Due in part to data paucity, computational limitations, and the relative rarity of insect–fire co-occurrence, recent empirical assessments of insect effects on burn severity have been limited to specific insect outbreaks, fire events, or insect–fire time lags (e.g., Crickmore 2011, Harvey et al 2013, Harvey et al 2014b, Prichard and Kennedy 2014). These studies suggest that burn severity is either unaffected by or weakly positively associated with outbreak severity, that insect effects are context-dependent, or that factors like fuel treatments, topography, and weather are stronger predictors of fire effects. To further elucidate general system behavior and inform regional management strategies, it is essential to investigate numerous fire events spanning multiple insect types (e.g., bark beetle versus defoliator), insect and burn severities, and time lags. Here, we leverage recent advances in remote sensing of forest disturbance dynamics (Kennedy et al 2010, Meigs et al 2015b) to conduct a burn severity census of large wildfires following recent outbreaks of the two most prevalent native forest insects across a large forested region, the US Pacific Northwest (PNW; 40 M ha; Oregon and Washington; figure 1). We focus on all large fire events (≥400 ha) with substantial overlap of fire perimeters with prior outbreaks of either mountain pine beetle (MPB) [Dendroctonus ponderosae Hopkins (Coleoptera: Curculionidae: Scolytinae); a bark beetle] or western spruce budworm (WSB) [Choristoneura freemani Razowski (Lepidoptera: Tortricidae); a defoliator] (total n = 81; table S1). Our specific objectives are (1) to quantify the fine-scale (30 m) effects of recent insect outbreaks on subsequent burn severity with spatial modeling at the fire event scale and (2) to evaluate the role of insect type, time since outbreak, insect and fire extent, fire season, and interannual drought across the full population of insect–fire events.
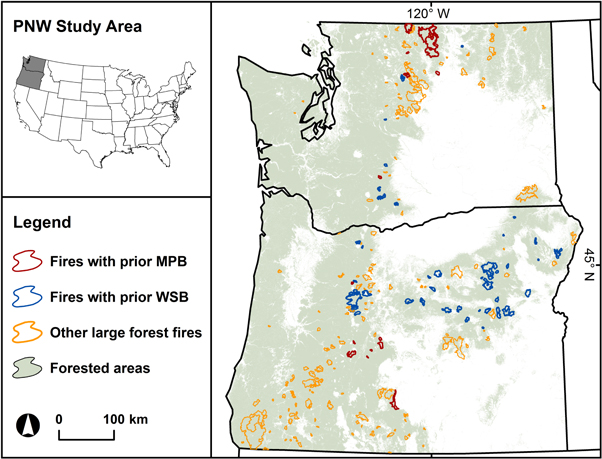
Figure 1. Distribution of large forest fires affected by prior outbreaks of mountain pine beetle (MPB; red; n = 19) and western spruce budworm (WSB; blue; n = 62) within the US Pacific Northwest study area (Oregon and Washington; inset). Note that 29% of large wildfires during the study period (≥400 ha; 1987–2011; n = 277) had ≥10% prior insect damage, highlighting that these potential compound disturbance events are limited to drier, interior conifer forests. We include only large wildfire perimeters with ≥50% forest cover (see methods). Oregon and Washington encompass ca. 40 M ha, half of which is forested (forest cover from Ohmann et al 2012).
Download figure:
Standard image High-resolution image2. Methods
2.1. Study area and recent insect dynamics
Conifer forests of the PNW vary across gradients of climate, topography, soil, and management history (Franklin and Dyrness 1973, Hessburg et al 2000, Meigs et al 2015a). Despite climatic variability, a common feature is that low precipitation during summer months (Franklin and Dyrness 1973) yields conditions conducive to periodic insect and wildfire disturbances, particularly in mixed-species conifer forests east of the crest of the Cascade Range (Meigs et al 2015a). In general, these forests occur in remote, mountainous terrain and are managed by US federal agencies for multiple resource objectives. Given the extent of similar geographic conditions, vegetation types, and anthropogenic pressures, recent PNW insect and wildfire patterns are broadly representative of contemporary disturbance dynamics in conifer forests of western North America.
Bark beetles, especially MPB outbreaks, have altered forest composition and structure across tens of millions of hectares of North American forests in recent decades (Raffa et al 2008, Bentz et al 2010). MPB adults attack pine tree stems [Pinus spp., particularly mature lodgepole pine (Pinus contorta Douglas ex Louden)], inducing variable but relatively rapid tree mortality during major outbreaks (Raffa et al 2008, Meigs et al 2011). In contrast, WSB larvae typically consume the current year's foliage of host trees {particularly true firs [Abies spp.], spruces [Picea spp.], and Douglas-fir [Pseudotsuga menziesii (Mirb.) Franco]}, and multiple years of WSB defoliation can result in tree mortality, often in conjunction with secondary bark beetles (Hummel and Agee 2003, Meigs et al 2011). Across the PNW, both insects have erupted in multiple outbreaks since 1970, with WSB exceeding MPB in cumulative extent and tree mortality (Meigs et al 2015b). Importantly, WSB host forests are more widespread and occur in relatively warmer, more productive locations than MPB host forests in the study area.
2.2. Insect and fire census data
Recent advances in remote sensing of forest dynamics across the PNW (Kennedy et al 2010, Meigs et al 2015b) provide an unprecedented opportunity to investigate relationships between insect outbreaks and wildfire severity in a retrospective, empirical, census-based framework. We used regional maps of insect and fire effects developed with LandTrendr time series analysis, which is described in detail by Kennedy et al (2010). Briefly, we acquired georectified images from the USGS Landsat archive and applied a series of steps—pre-processing (atmospheric correction, cloud masking), processing (temporal segmentation), and analysis (disturbance attribution, regional mosaicking)—to reduce multiple sources of uncertainty and assess trajectories of vegetation change (Kennedy et al 2010, Meigs et al 2015b).
We accounted for insect activity with LandTrendr-based maps of the cumulative magnitude, cumulative duration (count of years), and time since onset of MPB and WSB outbreaks developed by Meigs et al (2015b). These insect maps improve on regional aerial surveys by capturing fine-scale variation of insect impacts (30 m) and constraining maps to locations with durable vegetation change in known insect host forests from 1985 to 2012. The maps also quantify the impacts of MPB and WSB in consistent units of spectral change as seamless mosaics across the PNW study area (including all or part of 35 Landsat satellite scenes (Meigs et al 2015b)).
We accounted for burn severity by combining LandTrendr-based regional mosaics of spectral change (Kennedy et al 2010) with fire perimeters from a database of large wildland fires in the western US (≥400 ha; 1985–2012 (available online: http://mtbs.gov)). We first compiled annual time series (temporally stabilized at the pixel scale) of the normalized burn ratio (NBR; which combines near-infrared and mid-infrared wavelengths of the Landsat TM/ETM + sensor (Miller and Thode 2007)). Importantly, the Landsat time series are anchored in time near the median date of each scene (generally 1 August), which reduces seasonal variability associated with phenology and sun angles. We then computed the relative differenced normalized burn ratio (RdNBR (Miller and Thode 2007)) in two-year intervals to ensure pre- and post-fire coverage for all pixels within a given fire event. By capturing the relative change in dominant forest vegetation, RdNBR enables the assessment of burn severity across numerous fire events spanning heterogeneous vegetation (Miller and Thode 2007, Cansler and McKenzie 2014) or variable prefire disturbances (including insect outbreaks (Harvey et al 2013, Prichard and Kennedy 2014)). Although remotely sensed spectral change indices such as RdNBR have inherent limitations and do not measure very fine-scale fire effects and responses (e.g., tree charring, forest floor combustion, or postfire regeneration (Harvey et al 2014b)), they provide the only spatially and temporally consistent metric of burn severity encompassing all fires since 1985. Furthermore, because NBR is at the core of many current fire monitoring protocols (e.g., Key and Benson 2006), our RdNBR-based analysis is directly applicable to contemporary fire research and management.
We conducted a regional insect–fire severity census by focusing on large fire events with the following characteristics: total fire extent ≥400 ha; ≥10% of fire extent affected by prefire insect outbreaks (either MPB or WSB); ≥50% forest cover (30 m resolution (Ohmann et al 2012)). Because this forest cover map targets conditions in the year 2000 and classifies some previously burned areas as non-forest, we manually included several fires (n = 8) with mapped forest cover <50%. To avoid potential confounding effects, we excluded fire polygons with prior outbreaks of both MPB and WSB (n = 8), fires in 1986 with only one full year of prefire insect data (n = 5), fires in 2012 without postfire imagery for RdNBR calculations, and one fire classified as a prescribed fire. With these criteria, we refined the total population of forest fires (n = 425 spanning 1985–2012) to our final census of large wildfires with prefire insect activity (n = 81 spanning 1987–2011; figure 1).
2.3. Statistical analysis
We developed a hierarchical framework to investigate insect effects on burn severity within and among all wildfires in our census (i.e., at the individual and population level). Within each large insect–fire event, we assessed fine-scale (30 m) insect effects on burn severity with sequential autoregression (SAR), a powerful spatial modeling approach advanced recently for wildfire analysis (e.g., Wimberly et al 2009, Prichard and Kennedy 2014). SAR incorporates the inherent spatial autocorrelation in dependent and independent variables with a spatial error term (Haining 1993, Wimberly et al 2009). This spatial error term also accounts for spatially autocorrelated variables not included explicitly, resulting in more robust inferences than traditional approaches like ordinary least squares regression (Wimberly et al 2009, Prichard and Kennedy 2014).
We conducted all analyses in the R statistical environment (R Core Team 2015), constructing SAR models with the spautolm function in the spdep package (Bivand et al 2013) in the form:

where Y is the vector of the dependent variable, X is the matrix of independent variables, β is the vector of parameters, λ is the autoregressive coefficient, W is the spatial weights matrix, and ε is the uncorrelated error term. W is based on the spatial structure of the dependent and independent variables and is defined by an inverse distance rule that assigns a weight of zero to all pixels outside the focus pixel neighborhood and weights equal to the inverse of the distance within the focus pixel neighborhood. We determined the most parsimonious inverse distance rule of W by selecting the neighborhood that minimized both the Akaike information criterion (AIC) and residual spatial autocorrelation of the SAR model (Moran's I) (Kissling and Carl 2008, de Knegt et al 2010). Specifically, we ran SAR models with all dependent and independent variables (described below) across seven neighborhood distances (30–210 m in 30 m increments) for a subset of fires (n = 15) spanning the range of conditions in the large fire census. We then calculated AIC and Moran's I of the SAR residual values (moran.test function in Bivand et al 2013), which indicated an optimal neighborhood distance of 30 m, consistent with previous SAR burn severity modeling in the study area (Prichard and Kennedy 2014) and typical for a spreading disturbance phenomenon such as fire.
Following these initial steps, we quantified insect effects on subsequent burn severity at the individual fire level (Objective 1) by running a SAR model for each large insect–fire event in the regional census (n = 81). We used all 30 m pixels within each fire perimeter to predict burn severity (RdNBR) with the same set of independent variables related to forest fuels and topography (table 1). We included the insect damage and duration variables described above as well as pixel-level estimates of prefire biomass from annual Landsat time series and nearest neighbor imputation with forest inventory data derived for a regional analysis of carbon trajectories (http://lemma.forestry.oregonstate.edu/projects/cmonster).
Table 1. List of variables used in sequential autoregression modeling of burn severity (RdNBR spectral index) of all fire events affected by prior mountain pine beetle or western spruce budworm. All data were compiled as regional mosaics encompassing the Pacific Northwest study area (figure 1) and processed at 30 m resolution.
| Variable | Description | Source |
|---|---|---|
| Burn severity (response) | Relative differenced normalized burn ratio (RdNBR, two year interval) | (Miller and Thode 2007) |
| Prefire insect damage | Cumulative prefire vegetation change due to insect activity from Landsat time series (NBR) | (Meigs et al 2015b) |
| Prefire insect duration | Count of years with prefire insect activity from Landsat time series (y) | (Meigs et al 2015b) |
| Prefire biomassa | Prefire tree biomass from imputation mapping (kg ha−1) | |
| Aspectb | Cosine transformed aspect (°) | |
| Elevationb | Elevation (m) | |
| Slopeb | Slope steepness (%) | |
| Topographic position index (150 m)b | Difference between a pixel's elevation and the mean elevation of pixels within 150 m | |
| Topographic position index (450 m)b | Difference between a pixel's elevation and the mean elevation of pixels within 450 m |
aAnnual biomass maps were derived from Landsat time series and nearest neighbor imputation with forest inventory data as part of a regional analysis of carbon trajectories (http://lemma.forestry.oregonstate.edu/projects/cmonster). bTopographic variables derived from 30 m digital elevation model.
Although our primary focus was insect effects on burn severity via their impacts on vegetation/fuels, we recognize that topography and weather are fundamental drivers of fire behavior and effects. We thus included a set of five topographic variables (aspect, elevation, slope, and topographic position index at 150 and 450 m; derived from a 30 m digital elevation model) associated with burn severity in the region (Thompson et al 2007, Dillon et al 2011, Prichard and Kennedy 2014). Unlike these spatially static covariates, fire weather is a dynamic variable that needs to match SAR model resolution in both space and time. Recent advances in the development of gridded meteorological data (e.g., Abatzoglou 2013) have great potential for such analysis but must be combined with accurate fire progression maps to assign fire weather conditions to each pixel for the day it burned. Because consistent fire progression maps are a recent development in North American wildfire monitoring, they are not available for most fires in our census, precluding the use of fire weather covariates in our SAR analyses. Nevertheless, a major strength of SAR is that the spatial error term captures unmeasured but spatially structured variables at the pixel scale (Haining 1993, Wimberly et al 2009), including fire weather.
To evaluate key drivers of insect–fire effects at the population level (Objective 2), we assessed the distribution of SAR regression coefficients derived for each fire event with a set of predictor variables not included in the SAR models (table 2). Because the large variability and range of the independent SAR variables precluded direct comparison across model coefficients, we first standardized the coefficients by calculating z-scores based on the standard deviation of the mean across all SAR models. We then investigated whether insect effects on burn severity (z-scores of prefire insect damage coefficients) varied with insect type (MPB versus WSB), time since outbreak, total area affected by prior insect outbreaks (%), fire size (total extent), fire season (inferred from fire ignition date), or drought condition of each fire year (Palmer drought severity index; PDSI). We derived these predictor variables from the insect and fire census data described above, with the exception of state-level PDSI values (available online: http://www.wrcc.dri.edu/wwdt/time/), which we assigned to each fire, averaging June–August after Heyerdahl et al (2008). We estimated time since onset of insect outbreak at the fire event scale as the majority year of first detection in the Landsat-based insect atlas (Meigs et al 2015b), recognizing that actual insect activity begins one year before vegetation changes are detected (Meigs et al 2015a) and that outbreak initiation varies within a given fire perimeter, depending on outbreak and fire extent. Finally, we computed linear models to assess univariate relationships between these population-level predictors and the insect–fire coefficients.
Table 2. List of population-level predictor variables used to assess drivers of insect effects on burn severity across all fire events affected by prior mountain pine beetle or western spruce budworm.
| Variable | Description | Source |
|---|---|---|
| Insect type | Mountain pine beetle (bark beetle) or western spruce budworm (defoliator) | (Meigs et al 2015b) |
| Time since outbreak | Time since onset of insect outbreak according to Landsat time series (y) | (Meigs et al 2015b) |
| Area affected by insect | Area of fire extent affected by prior mountain pine beetle or western spruce budworm according to Landsat time series (cumulative %) | (Meigs et al 2015b) |
| Fire size | Extent of fire event (ha) | http://mtbs.gov |
| Fire season | Day of year of fire ignition | http://mtbs.gov |
| Interannual drought | Palmer drought severity index (mean June–August PDSI) by fire year and state | http://www.wrcc.dri.edu/wwdt/time/ |
We evaluated uncertainty in the SAR models for each fire event as well as the distribution of model accuracy across all fire events (table S1). Specifically, we graphed SAR model coefficients of determination (R2) by insect type and across the same key predictor variables used in the population-level analysis. Recognizing additional uncertainties inherent to these spatial datasets, we emphasize general patterns across the regional census and the relative effects of insect outbreaks. For example, because the insect outbreak year is offset by one year and uncertain for any given pixel within a fire perimeter, we focus on the relative time since insect outbreak across all fires rather than the specific time lag for a given fire event.
3. Results
Our census of recent insect–fire events across Pacific Northwest forests reveals that, after accounting for prefire biomass and topography, burn severity is generally lower in forests with higher cumulative prefire insect damage (figure 2). Notably, this negative effect of prior insect damage on burn severity is strong enough to emerge without directly accounting for weather conditions at the time of burning.

Figure 2. Effect of insect, vegetation, and topography drivers on remotely sensed burn severity across fire events with prior mountain pine beetle (a, n = 19) or western spruce budworm (b, n = 62). The standardized z-scores from spatial modeling (sequential autoregression; SAR) of each large fire event indicate that burn severity (RdNBR spectral index) is lower in forests with higher cumulative prefire insect damage and lower prefire biomass. The SAR models also account for prefire insect outbreak duration and five potential topographic drivers of severity (table 1). The box and whisker plots show the median as a horizontal line, 25th and 75th percentiles as box edges, 1.5 times the interquartile range as whiskers, and outliers as points.
Download figure:
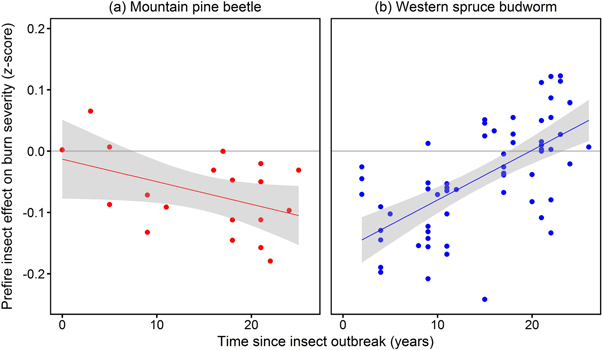
Standard image High-resolution imageFollowing both MPB and WSB outbreaks, burn severity is lower across most time lags (figure 3). The two insects exhibit divergent temporal trajectories, however, revealing differential insect effects on tree mortality, vegetation response, and associated fuel dynamics. Specifically, whereas burn severity decreases with time following MPB outbreaks (figure 3(a)), severity increases with time following WSB outbreaks, eventually recovering to a neutral effect within 20 years (figure 3(b)).
Figure 3. Relationship between prefire insect effect on burn severity (RdNBR spectral index) and years since onset of insect outbreak across fire events (individual points) with prior mountain pine beetle (a) or western spruce budworm (b). For both insects, burn severity is lower in forests with higher prefire insect damage across most time lags, although the two insects exhibit divergent trajectories. Whereas burn severity decreases with time following mountain pine beetle outbreaks (R2 = 0.19, P = 0.06, n = 19), severity increases with time following western spruce budworm outbreaks (R2 = 0.40, P < 0.0001, n = 62), recovering to a neutral effect within 20 years.
Download figure:
Standard image High-resolution image
In addition, insect effects on burn severity do not depend on the other population-level predictor variables. Specifically, the insect–fire coefficients are not associated with the proportion of fire extent affected by insects (%), total fire extent (ha), fire season (ignition date), or interannual drought condition (PDSI) for either insect species (figures S1–S4). This lack of association underscores the importance of time-since-outbreak as an emergent predictor of fine-scale insect effects on burn severity (figure 3).
In general, SAR model accuracy is high (MPB mean R2 = 0.64; WSB mean R2 = 0.72; table S1), indicating that the insect, vegetation, and topography variables—as well as the inherent spatial patterning represented by the spatial error term—explain a large proportion of variation in estimated burn severity. In addition, the coefficients of determination are generally evenly distributed across the regional predictor variables, which encompass a broad range of insect, fire, and drought conditions (figures S5–S9). Finally, other recognized drivers of burn severity that we did not model explicitly, particularly fire weather and firefighting response at the event scale, contribute to the spatially autocorrelated variance captured indirectly by the SAR spatial error term associated with each fire.
4. Discussion
By quantifying the fine-scale effects of insect outbreaks on burn severity within all large insect–fire events across a heterogeneous forest region, this study demonstrates a general pattern of lower burn severity following outbreaks of both bark beetles and defoliators, in contrast to recent findings that burn severity is either unaffected by or weakly positively associated with outbreak severity (e.g., Crickmore 2011, Harvey et al 2013, 2014a, 2014b, Prichard and Kennedy 2014). We suggest that higher severity insect outbreaks reduce the abundance of live vegetation susceptible to wildfire while altering vertical and horizontal fuel distributions, particularly as trees defoliate, die, and transition from canopy to surface fuels (Hummel and Agee 2003, Simard et al 2011, Hicke et al 2012, Cohn et al 2014, Harvey et al 2014a).
In the case of MPB, this forest thinning effect results in a lasting reduction of fire impacts on residual vegetation (figure 3(a)). Moreover, the continuing decline in post-beetle burn severity indicates that the thinning effect may persist until vegetation and fuel distributions recover to pre-insect conditions. Because there were relatively few fire events within the first few years following MPB outbreak in our census (figure 3(a)), future studies should continue to investigate the transient yet highly flammable red stage of outbreak (Jolly et al 2012). Nevertheless, our finding of generally lower burn severity in forests affected by MPB outbreaks—as well as the relative rarity of red-stage fire events in recent decades despite major beetle outbreaks in the study region (Meigs et al 2015b)—highlights the need for discretion in forest and fuel management following beetle outbreaks.
In the case of WSB defoliation, lower initial burn severity is consistent with reduced potential fire behavior and effects due to fine-scale canopy thinning and mortality dynamics (Cohn et al 2014). The relatively rapid increase of the budworm-fire coefficient with time (figure 3(b)) indicates that the thinning effect on fuel profiles is less persistent for the defoliator (WSB) than for the bark beetle (MPB). In addition to relatively lower per-unit-area tree mortality impacts (Meigs et al 2011), WSB affects host forests that are more productive than those affected by MPB in the study region (Meigs et al 2015b), leading to more rapid accumulation of live overstory and understory vegetation. Thus, as time elapses following WSB outbreaks, fuel density and connectivity likely increase in multiple strata, including dead surface fuels (Hummel and Agee 2003) and total live biomass, the latter of which is associated with higher burn severity (figure 2). The potentially synergistic budworm-fire effects in older outbreaks have important implications for current forest management in the US Pacific Northwest, where regional WSB outbreaks peaked 25–30 years ago, exceeding recent MPB outbreaks in cumulative extent and impacts (Meigs et al 2015b).
Very few studies to date have assessed post-insect burn severity in an empirical, spatially explicit manner, and our census of numerous large fire events occurring up to 26 years following bark beetle and defoliator outbreaks provides a broader context for assessments of specific insect outbreaks, wildfires, locations, and time lags. In so doing, our analysis demonstrates generally negative feedbacks, in comparison with the neutral or relatively transient positive effects quantified with field observations in wildfires occurring up to 15 years following MPB outbreaks in Northern Rocky Mountain forests (Harvey et al 2014a, 2014b). In addition, our results differ from the positive MPB-fire feedbacks identified via SAR for the 2006 Tripod Fire Complex in northern Washington (Prichard and Kennedy 2014). Finally, analyses of fire effects following WSB defoliation have been especially rare. The post-budworm temporal trend suggests a neutral effect ca. 18–23 years post-outbreak (figure 3(b)), consistent with the lack of association between budworm damage and the severity of the 2003 B&B Fire Complex in central Oregon (18 years post-outbreak (Crickmore 2011)).
Our core finding that insect outbreaks actually dampen wildfire severity across numerous large insect–fire events has direct applications to natural resources management. Specifically, policies based on the assumption that recent insect outbreaks increase the hazard of subsequent wildfires might be unjustified (Hart et al 2015). Furthermore, given that insects also can reduce wildfire likelihood (Lynch and Moorcroft 2008, Meigs et al 2015a), these findings illustrate the role that a biotic disturbance (i.e., insect outbreak) can play in limiting both the occurrence and impacts of an abiotic disturbance (i.e., wildfire). Because bark beetle and defoliator effects on burn severity appear to diverge over time, however, forest management strategies should recognize the differential and dynamic effects of each insect on fuel conditions and associated fire potential.
Although our regional census reveals negative insect effects on burn severity across a range of conditions that has not been assessed to date, numerous uncertainties and research questions remain, particularly regarding the mechanistic linkages among insects, fuels, and other known drivers of fire behavior and effects. Specifically, our inference is limited to the locations and years captured by the available spatial datasets, and future studies could investigate insect–fire severity relationships over broader spatiotemporal scales. Future studies also could combine our spatially extensive methods with the temporally rich insights provided by tree ring analysis (e.g., Flower et al 2014). Such a fusion approach would enable forest researchers and managers to determine whether recent insect and fire patterns represent a departure from historic disturbance regimes. In addition, because our census uses remotely sensed relative spectral change (RdNBR) as a proxy for fire effects, we cannot directly address causal relationships, fine-scale ecological impacts and responses (e.g., soil heating, tree regeneration), fire behavior (e.g., fire intensity, crowning), or operational fire management (e.g., firefighter safety, suppression tactics) (Thompson et al 2007, Harvey et al 2014b, Jenkins et al 2014, Hart et al 2015). Moreover, although the SAR spatial error term indirectly captures the effects of missing variables (Haining 1993, Wimberly et al 2009), future studies could explicitly address the effects of other key drivers like fire weather on a subset of events where fine-scale, consistent, and accurate weather and fire progression data are available (e.g., Harvey et al 2014b, Prichard and Kennedy 2014). Similarly, topography and climate are known drivers of burn severity in the western US (Dillon et al 2011), and future research could further investigate the generally positive association between elevation and burn severity in our SAR modeling (figure 2) and lack of association between drought and insect–fire effects across this census, which spans a range of drought conditions (figure S4). Finally, our analysis is limited to the relatively rare events where wildfires occur within the initial decades following insect outbreaks, and future studies should continue to evaluate the pervasive ecological and economic impacts of these and other disturbance agents separately (e.g., Westerling et al 2006, Kurz et al 2008, Hicke et al 2013).
5. Conclusion
Contrary to common assumptions of positive feedbacks, recent forest insect outbreaks actually dampen subsequent burn severity at multiple time lags across the US Pacific Northwest. Indeed, by altering forest structure and composition from forest stand to regional scales (Raffa et al 2008, Flower et al 2014, Meigs et al 2015b), these native insects contribute to landscape-scale heterogeneity, potentially enhancing forest resistance and resilience to wildfire. Because insect outbreaks do not necessarily increase the severity of subsequent wildfires, we suggest a precautionary approach when designing and implementing forest management policies aimed at reducing wildfire hazard in insect-altered forests.
In addition, by dampening subsequent burn severity, insect outbreaks could buffer rather than exacerbate some fire regime changes expected due to global change (e.g., climate warming, drought, invasive species (Littell et al 2010, Ayres et al 2014)) and forest response to land use (e.g., fire exclusion, timber harvest, livestock grazing (Hessburg et al 2000)). However, each of the disturbances assessed here (bark beetle, defoliator, wildfire) influences more forest area separately than in combination (Meigs et al 2015a), and it will remain a high priority to monitor and adaptively manage their individual impacts on forest health and ecosystem services. Given projected increases in the activity of both wildfires and insects (Raffa et al 2008, Bentz et al 2010, Littell et al 2010), the potential for disturbance interactions will continue to increase, as will the potential for ecological surprises like the negative feedbacks apparent in this census.
Acknowledgments
We thank Justin Braaten, Christopher Dunn, Matthew Gregory, Cassie Meigs, Ariel Muldoon, Susan Prichard, Matthew Reilly, and Zhiqiang Yang for assistance with data analysis and interpretation. We acknowledge Daniel Donato, Jonathan Thompson, and three anonymous reviewers for insightful comments on earlier drafts. This research was supported in part by NASA Headquarters under the NASA Earth and Space Science Fellowship Program—Grant NNX11AM01H, the USDA Forest Service, Forest Health Monitoring (FHM) Evaluation Monitoring—Grant WC-F-09-2, and the USDA McIntire-Stennis Forest Research Program. The development of the LandTrendr-based disturbance maps reported in this paper was supported by the USDA Forest Service Northwest Forest Plan Effectiveness Monitoring Program, the North American Carbon Program through grants from NASA's Terrestrial Ecology, Carbon Cycle Science, and Applied Sciences Programs, the NASA New Investigator Program, the Office of Science (BER) of the US Department of Energy, and the following Inventory and Monitoring networks of the National Park Service: Southwest Alaska, Sierra Nevada, Northern Colorado Plateau, and Southern Colorado Plateau.