

Abstract
Drought constitutes a significant natural hazard in Europe, impacting societies and ecosystems across the continent. Climate model simulations with increasing greenhouse gas concentrations project increased drought risk in southern Europe, and on the other hand decreased drought risk in the north. Observed changes in water balance components and drought indicators resemble the projected pattern. However, assessments of possible causes of the reported regional changes have so far been inconclusive. Here we investigate whether anthropogenic emissions have altered past and present meteorological (precipitation) drought risk. For doing so we first estimate the magnitude of 20 year return period drought years that would occur without anthropogenic effects on the climate. Subsequently we quantify to which degree the occurrence probability, i.e. the risk, of these years has changed if anthropogenic climate change is accounted for. Both an observational and a climate model-based assessment suggest that it is >95% likely that human emissions have increased the probability of drought years in the Mediterranean, whereas it is >95% likely that the probability of dry years has decreased in northern Europe. In central Europe the evidence is inconclusive. The results highlight that anthropogenic climate change has already increased drought risk in southern Europe, stressing the need to develop efficient mitigation measures.
Export citation and abstract BibTeX RIS

Original content from this work may be used under the terms of the Creative Commons Attribution 3.0 licence. Any further distribution of this work must maintain attribution to the author(s) and the title of the work, journal citation and DOI.
1. Introduction
Drought has affected 37% of the European Union's territory in the past three decades (EC 2007), triggering ecological (Gudmundsson et al 2014, Blauhut et al 2015) and socio-economical damages (EC 2007, Kossida et al 2012, Blauhut et al 2015), impacting more than 100 million inhabitants (EC 2007). Climate model projections highlight Europe as one of the future hot spots of hydro-climatic change, with contrasting effects of anthropogenic forcing in the south (drying) versus the north (wetting) of the continent (Orlowsky and Seneviratne 2013, Prudhomme et al 2014). Although increasing evidence suggests the emergence of similar trends in historical water balance components and drought indicators (Stahl et al 2010, Seneviratne et al 2012, Hartmann et al 2013, Gudmundsson and Seneviratne 2015b, Meko and Cook 2016), it is not yet clear to which degree anthropogenic climate forcing has contributed to changes in European drought risk (Bindoff et al 2013). Among the sources of uncertainty, hindering a clear interpretation of observed changes in European drought are differences in the employed drought indicators (Sheffield et al 2012) and uncertain precipitation estimates (Trenberth et al 2014). In addition the influence of the north Atlantic oscillation (Hurrell and VanLoon 1997) on Europe's hydro-climatology at times amplifies the south–north contrast (Hurrell and VanLoon 1997, López-Moreno and Vicente-Serrano 2008, Kelley et al 2012, Meko and Cook 2016). This can make it difficult to distinguish trends in drought occurrence from natural decadal-scale variability (Bindoff et al 2013).
Drought risk is commonly considered to be a function of (i) the hazard, e.g. a meteorological drought, (ii) the exposure, e.g. the number of assets in a drought prone region and (iii) the vulnerability, e.g. the susceptibility to suffer damages (Cardona et al 2012). A consequence of this definition is that a changed occurrence rates of meteorological drought years (increased hazard) necessarily implies changed drought risk as long as there are no shifts in exposure or vulnerability. This also implies that it is possible to respond to changes in meteorological drought risk through environmental management, aiming at controlling both exposure and vulnerability.
In this study we aim at explicitly addressing the question whether anthropogenic climate change has altered drought risk in Europe. For doing so, we focus on meteorological (precipitation) drought and quantify how the occurrence probability of drought years has changed in response to global warming. In contrast to hydrological drought, which can be impacted by on ground human interventions in the water cycle (Van Lanen et al 2016, Van Loon et al 2016), meteorological drought is expected to only respond to anthropogenic climate change. Consequently possible climate signals will not be obscured by mitigation activities.
In the following we introduce a methodological framework for meteorological drought risk assessment, that can be applied to both observations and climate model simulations. Subsequently we apply this framework to an array of observations and state of the art climate model simulations to quantify how European drought risk has changed in response to anthropogenic climate change throughout the past century. Consistency of both observational and climate model based results will be assessed to increase the confidence in the results. Finally the findings will be discussed in light of previous assessments and implications for drought management will be considered.
2. Methods
2.1. A framework for meteorological drought risk assessment
In this study we rely on a probabilistic framework that roots in epidemiology (Rothman et al 2012) and has seen wide application in studies attributing extreme weather events to climate change (e.g. Palmer and Raisanen 2002, Allen 2003, Stott et al 2004, Stone and Allen 2005, van Oldenborgh 2007, Pall et al 2011, Otto et al 2012, Stott et al 2013, Fischer and Knutti 2015, King et al 2015). The approach is based on comparing  , the occurrence probability of extreme weather events under natural conditions, with
  , the occurrence probability of the same event under historical conditions. As common in detection and attribution studies (Bindoff et al 2013), 'natural conditions' referrers to climate variability as it would occur without human interventions, whereas 'historical conditions' refer to climate variability that occurs with anthropogenic emissions. Comparison of the two probabilities is commonly done using the using the risk ratio (Stone and Allen 2005, Rothman et al 2012),

or closely related measures. The interpretation of RR is straight forward. Values larger than one indicate increased risk, e.g. RR = 2 indicates that drought risk for a given year is twice as large if anthropogenic effects on the climate are taken into account. Likewise RR = 0.5 shows that drought risk decreases by a factor two if the anthropogenic effects are accounted for. If RR = 1 the risk does not change.
In this study we analyse annual precipitation and aim at quantifying how the occurrence probability of a 20 year return period event has changed in response to human influences on the climate. For doing so we set  (corresponding to a 20 year return period) and estimate,
  , the magnitude of the corresponding event for a given time step. Subsequently
  , the probability of
  for historical conditions, is estimated (see figure 1(a)) and combined with
  to compute the risk ratio, RR. As the estimation is based on finite data and relies on methods with strong assumptions it is inevitable that the estimates of both
  and
and  will be uncertain. Consequently RR will also be uncertain and best described by a probability distribution, which can be used to assess whether it is significantly different from one (see figure 1(b)). Note that the definition of droughts as 20 year return period low precipitation years is approximately consistent with the SPI definition of severe and extreme droughts, which are defined as precipitation sums with an occurrence probability
  and
and  respectively (McKee et al 1993).
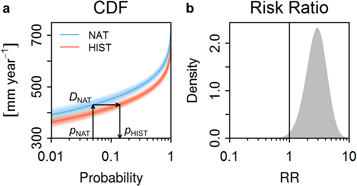
Figure 1. Illustration of probabilistic risk change assessment. (a) Hypothetical cumulative distribution functions of annual precipitation with (HIST) and without (NAT) human effects on the climate. Shading indicates estimation uncertainty of the two distributions. Arrows indicate how an event,  , with an occurrence probability of
  under natural conditions may get more likely if human effects are accounted for (pHIST). (b) Distribution of the risk ratio (equation (1)), accounting for the estimation uncertainty. Note the log-scale in the abscissa of both panels.
Download figure:
Standard image High-resolution imageThe methodological challenge is to estimate both  and
and  , which can be achieved using both climate model based (e.g Palmer and Raisanen 2002, Allen 2003, Stott et al 2004, Stone and Allen 2005, Pall et al 2011, Stott et al 2013, Fischer and Knutti 2015) and observation based approaches (e.g. van Oldenborgh 2007, Otto et al 2012, Stott et al 2013, King et al 2015). The advantage of climate model based approaches is that large samples of climate with and without human emissions can be simulated, which in turn can be used to estimate the probabilities. Climate models, however, suffer from incomplete process knowledge and other model uncertainties. The advantage of observational approaches is that they can utilise the power of real-world observations. This comes, however, at the cost of strong simplifying assumptions, which may introduce biases to the analysis. Recognising the strengths and weaknesses of both approaches we follow the recommendations of Hegerl (2015) and analyse both climate model output and observations in parallel to assess the effect of climate change on drought risk in Europe. In contrast to previous studies we do not aim at estimating the risk ratio for single extreme events, but to provide estimates of its evolution throughout the past century.
2.2. Observational assessment
To assess changes in drought risk we need a model of the probability distribution of annual precipitation. For this we follow the SPI approach (McKee et al 1993) and assume that annual precipitation P follows a Gamma distribution, with the probability density

for  , where the shape parameter k influences the skewness and the scale parameter θ controls the spread. The validity of this assumption has been tested at thousands of grid cells in Europe (Stagge et al 2015). However, this model assumes stationary conditions, implying it cannot be used directly to account for anthropogenic climate change and other factors that may influence drought probability. To facilitate this, we adapt previous studies (van Oldenborgh 2007, Otto et al 2012) and assume that the occurrence probability of climate extremes can be modelled by allowing the parameters of the underlying distribution to depend on indicators of global mean temperature anomalies (
 ) and indicators of large-scale climate variability. The rational for considering the effect of
  is that its increase is attributed to human emissions (Bindoff et al 2013) and it is thus a reliable indicator for anthropogenic climate change. Here we consider TG series that are centred to the 1880–1899 period, i.e. decades where effects of human emissions on the climate can be considered to be minimal. To approximate observed natural climate variability and to account for the north Atlantic influence on European drought magnitude (López-Moreno and Vicente-Serrano 2008) we also consider effect of the station based north Atlantic oscillation index, NAO (Hurrell 1995, Hurrell and VanLoon 1997), on drought probability. The combined effects of both
  and NAO on the the distribution of annual precipitation can then be estimated as

where  is the expected value of the gamma distribution (equation (2)) and
  ,
,  and
and  are regression parameters. The combination of the gamma distribution (equation (2)) with the log-linear regression (equation (3)) is a special case of generalised linear models (GLMs) (McCullagh and Nelder 1989). GLMs are generalisations of ordinary linear regression that allow for response variables that are not normally distributed and the parameters can be estimated using common statistical software packages (e.g. Venables and Ripley 2002, R Core Team 2016). In this study the shape parameter of the gamma distribution, k, is estimated on the basis of the regression residuals using the moment estimator following the recommendations of McCullagh and Nelder (1989). The remaining scale parameter, θ, is calculated as
  . Once the parameters of the statistical model have been identified it can be used to estimate the distribution of annual precipitation for any combination of
  and NAO.
Model uncertainty is first assessed using an ordinary bootstrap with case wise resampling (2000 replications), which is consistent with the notion that all variables entering the regression model exhibit sampling uncertainty (Efron and Tibshirani 1993). In practice this means that time series of P,  and NAO are first arranged in a table and with three columns and n rows. In a next step n rows are drawn randomly with replacement from this table, generating a random sample of the data. The model is then fit to the random sample. This procedure is repeated 2000 times, resulting in a large sample of model parameters. 90% confidence intervals for the model parameters are constructed from the 5% and 95% percentiles of the bootstrapped parameter values.
In the following we use the above described model to estimate how the probability of  , a drought event that would have a 20 year return period without human emissions, has changed in response to global warming. For doing so we first set
  and estimate the magnitude of
  for each year. This is done by prescribing
  and accounting for observed NAO values for each year. By doing so, we assume that global mean temperature in the 1880–1899 base period was approximately at pre-industrial levels. Subsequently
  , the probability of
  under climate change, is estimated conditional on both NAO and
  for the given year (see also figure 1(a)). Both
  and
and  are finally used to compute the risk ratio, RR (equation (1)). This evaluation is done for every year with available NAO and
  , resulting in transient estimates of RR.
To quantify uncertainty in the risk ratio, we repeat its computation for each of the bootstrapped parameter samples, resulting in an ensemble of 2000 transient estimates of RR. We further recognise that the results of observational drought assessments are subject to uncertain precipitation estimates (Trenberth et al 2014). To account for this we repeat the analysis for five independent precipitation data sets (see section 3.1), resulting in an pooled ensemble of 2 × 2000 = 10000 transient estimates of RR. Significance of changes in drought risk is reported if the 90% confidence interval, defined as the range between the 5% and 95% percentiles of the combined bootstrap sample does not cover the line of no change (RR = 1). In this case, we report that it is >95% likely that TG has an detectable influence on drought risk.
2.3. Model based assessment
Climate model based changes in drought risk are estimated on the basis of an ensemble of model simulations with historical radiative forcing (HIST) and historical simulations with natural forcing only (NAT) (Taylor et al 2011). For this, decadal segments (e.g. 1886–1895, 1896–1905, ..., 1996–2005) of all models were pooled into one sample. By doing so we account for high frequency internal variability and follow the previously utilised assumption (Stott et al 2004) that decadal variability is approximately stationary. For each decadal block RR is then estimated as follows: first a gamma distribution is is fitted to the NAT simulations for each decadal segment and the magnitude, DNAT of the 20 year return period ( ) drought event is read of this distribution. Subsequently a gamma distribution is fitted to the HIST simulations and
  the probability of DNAT with human effects on the climate is estimated. Finally
  is combined with
  to compute RR. Uncertainty is estimated in this case using an ordinary bootstrap (Efron and Tibshirani 1993) with 2000 replications. For this samples are drawn with replacement from both HIST and NAT and a gamma distribution is fitted to each sample, which in turn is then used to estimate
  ,
,  and RR respectively (see also figure 1). The 90% percentile confidence intervals of climate model based RR are estimated from the resulting bootstrap sample.
2.4. Comparing observational and model based results
The consistency between observational and model based estimates of RR is quantified in terms of time series correlation. Best-estimate correlations are computed as the correlations between estimates of all considered precipitation data and the best estimate of the model simulations. As observation based estimates of RR have an annual resolution, they are averaged for 10 year long time blocks corresponding to the model based estimates. Uncertainty is assessed by correlating each of the 10 000 bootstrap samples of the observational uncertainty analysis with each of the 2000 bootstrap samples of the model based assessment, resulting in  replications. If the 5% percentile of these surrogate correlations is >0 we report that it is >95% likely that observational and model based estimates of RR are correlated.
3. Data
3.1. Observational data
As it has been recently highlighted that observational uncertainty in precipitation can have significant effects on historical drought assessment (Trenberth et al 2014), we utilise a range of different precipitation products for our analysis. More specifically we analyse precipitation time series stemming from five different gridded data products ranging from 1900 to 2013 and covering at least the 1950–2010 time period. References and version numbers of the considered precipitation data are as follows: CRU version 3.22 (Harris et al 2014), GPCC version 6 (Becker et al 2013), U.Del version 3.01 (Nickl et al 2010), E-OBS version 11 (Haylock et al 2008), PREC/L (Chen et al 2002). All precipitation data have been interpolated to a common  grid using conservative remapping (Jones 1999) and aggregated to annual values. To guarantee consistency grid-cells that did not have full temporal coverage in any of the data sets where excluded from the analysis. This mainly affected the Mediterranean (MED) region, essentially limiting the analysis to southern Europe (figure 2(a)). The gridded precipitation data where then averaged over three predefined European macro regions (Seneviratne et al 2012), corresponding to the Mediterranean, central Europe (CEU) and northern Europe (NEU) (figures 2(a) and (b)).

Figure 2. Observational data under consideration. (a): mean annual precipitation in Europe (E-OBS data). The analysis focuses on three macro-regions, suggested in the IPCC Special Report on Extremes (Seneviratne et al 2012), allowing for an assessment of drought frequency in northern Europe (NEU), central Europe (CEU) and the Mediterranean region (MED). Grey land areas were omitted from the analysis due to incomplete temporal coverage. (b): annual precipitation series averaged for each region under investigation. Values in the parenthesis of the figure legend correspond to the start and the end year of each series. (c): station based north Atlantic oscillation Index and global mean temperature anomalies (base period: 1880–1899). See text for references and detailed information on data processing.
Download figure:
Standard image High-resolution imageThe station based north Atlantic oscillation index, NAO is defined as the normalised pressure difference between Ponta Delgada, Azores and Stykkisholmur/Reykjavik, Iceland (Hurrell 1995, Hurrell and VanLoon 1997) (figure 2(c), available at https://climatedataguide.ucar.edu/climate-data/hurrell-north-atlantic-oscillation-nao-index-station-based).
In this study we follow the previviously utilised assumption that global mean temperature anomalies can act as an indicator for anthropogenic climate change (van Oldenborgh 2007, Otto et al 2012). For this we rely on global mean temperature anomalies provided by the Goddard Institute for Space Studies (Hansen et al 2010), which are available with regular updates (http://data.giss.nasa.gov/gistemp/graphs_v3/). The global mean temperature time series is centred to the 1880–1899 base period. As in previous studies (van Oldenborgh 2007, Otto et al 2012) global mean temperature anomalies were smoothed with a three-year running mean to reduce effects of the quasi biannual oscillation. In the reminder of this paper the smoothed temperature anomalies are referred to as TG (figure 2(c)).
3.2. Climate model data
Climate model simulations from the CMIP5 archive (Taylor et al 2011) were selected based on the rule that each model should provide simulations with historical forcing (HIST) and historical simulations with natural forcing only (NAT). The selected models are listed in table 1. For HIST and NAT, simulations from 1886 to 2005 are considered, where 2005 is the last available year of historical simulations. Prior to further processing, simulated precipitation was interpolated to a common  grid and aggregated to annual values. Only grid-cells that contained observations were maintained for the analysis. The gridded time series were averaged for each of the three considered regions (figure 2(a)). As there are model specific biases in simulated precipitation, the regional precipitation series where bias corrected to match the distribution of the E-OBS data using a power-law transformation (Gudmundsson et al 2012). The E-OBS data were chosen as reference, as this data product was developed specifically for Europe and is hence assumed to be most accurate.
Table 1. Considered climate models from the CMIP5 archive. The suffixes _p1 and _p3 indicate different physics-parameterizations.
| bcc-csm1-1_p1 | BNU-ESM_p1 | CanESM2_p1 |
| CCSM4_p1 | CESM1-CAM5_p1 | CNRM-CM5_p1 |
| CSIRO-Mk3-6-0_p1 | FGOALS-g2_p1 | GFDL-CM3_p1 |
| GFDL-ESM2M_p1 | GISS-E2-H_p3 | GISS-E2-R_p3 |
| HadGEM2-ES_p1 | IPSL-CM5A-LR_p1 | IPSL-CM5A-MR_p1 |
| MIROC-ESM_p1 | MIROC-ESM-CHEM_p1 | MRI-CGCM3_p1 |
| NorESM1-M_p1 |
4. Results
The effects of both NAO and TG on annual precipitation, expressed as the coefficients of equation (3), are shown in figure 3. In each of the considered regions, the confidence interval of the NAO effect,  , does not overlap zero, indicating a significant influence on the distribution of annual precipitation. The sign of the effect, indicating increased precipitation in the north and decreased precipitation in central and southern Europe for positive NAO is consistent with previously reported results (Hurrell and VanLoon 1997, López-Moreno and Vicente-Serrano 2008). Overall the effect of global mean temperature anomalies on regional precipitation,
  , supports the hypothesis that annual precipitation has increased in the north and decreased in the south as response to global warming. However, the significance of the results is dependent on the considered data set, pointing towards the importance of observational uncertainty in precipitation (Trenberth et al 2014).

Figure 3. Effects of the north Atlantic oscillation index ( ) and global mean temperature (
 ) on the precipitation distribution in Europe. Displayed are the best estimate (dot) as well as the 90% confidence interval of equation (3) estimated from each considered precipitation data set in each region under investigation.
Download figure:
Standard image High-resolution image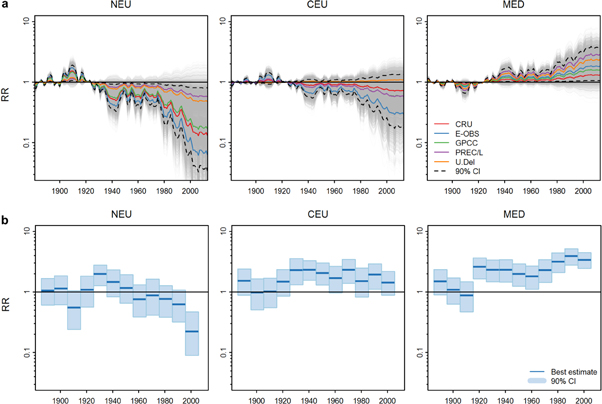
Figure 4. Changes in European drought risk. (a): observational estimates of changes in drought risk, conditional on global warming. Coloured lines represent the best estimate for each data product under consideration. Thin grey lines correspond to individual bootstrap replications and highlight the overall uncertainty of the analysis. Dashed lines indicate the 90% confidence interval derived from the bootstrap. (b): climate model based estimates of drought risk. Shown are the best estimate, as well as the 90% bootstrap confidence intervals. Model based estimates are computed for 10 year long time blocks.
Download figure:
Standard image High-resolution imageFigure 4(a) shows the time evolution of the risk ratio (equation (1)) in each considered pan-European macro region. Despite the large combined parameter and model uncertainty, clear changes in drought risk associated with global mean temperature anomalies emerge for northern Europe and the Mediterranean region. In northern Europe drought risk has been decreasing throughout the course of the past century. In contrast to northern Europe, drought risk has increased in the Mediterranean throughout the same time period. In both regions the 90% confidence intervals do leave the line of no change (RR = 0) throughout the course of the twentieth century. In central Europe, changes in drought risk could not be detected. Consequently these observational results show that northern European and Mediterranean drought risk has changed significantly in response to global mean temperature. As global mean temperature change has been attributed to anthropogenic climate forcing (Bindoff et al 2013), it is possible to invoke the two-step-attribution procedure (Bindoff et al 2013) and claim that the identified changes in European drought risk are attributable to human effects on the climate.
The climate model based estimates (figure 4(b)) are generally consistent with the observational estimates indicating decreased drought risk in the north and increased drought risk in the Mediterranean region. In central Europe, model based estimate of drought risk does not exhibit a clear change pattern, although the simulations suggest a slightly increased drought risk if anthropogenic effects are accounted for.
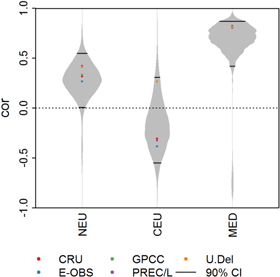
The similarity of observational and model based estimates of drought risk is finally quantified in terms of correlation. The correlation analysis (figure 5) confirms the significant similarity of observational and model based estimates of drought risk for northern Europe and the Mediterranean region. Note that the correlation for northern Europe is not as pronounced as for the Mediterranean region. Nevertheless the uncertainty analysis suggests that it is >95% likely that the observed and the modelled history of drought risk are positively correlated in both regions. In Central Europe observation based and model based estimates of drought risk are not correlated, pointing at an inconsistency between both estimates of drought risk.
Figure 5. Correlation between observational and model based drought risk. The grey area indicate the probability density of the bootstrap replicates. Horizontal lines mark the 90% confidence interval. Coloured dots show the best estimates for the considered precipitation data.
Download figure:
Standard image High-resolution image
5. Summary and conclusions
In conclusion, the consistency of both the observational and the model-based assessment suggests that it is very likely that changed drought risk in northern Europe and the Mediterranean region is attributable to anthropogenic climate change. In central Europe evidence from the observational and the model based assessment is conflicting, highlighting that the results are inconclusive for this region. Overall the decreased drought risk in northern Europe is consistent with regional (Bhend and von Storch 2008), hemispheric (Min et al 2008, Wan et al 2014) and global studies (Zhang et al 2007) that attribute increased annual precipitation in high latitudes to anthropogenic climate change. In the Mediterranean region Hoerling et al (2011) has highlighted the increased consistency of model simulations with the observed drying trend if human emissions are accounted for, further supporting the evidence presented in this study. Note however, that the above mentioned assessments have neither focused on central Europe nor explicitly quantified the effect of climate change on the occurrence probability of drought years. Possible mechanisms underlying the observed pattern are likely related to a dynamic response of atmospheric circulation to increased temperature, including e.g. a northward shift of the storm tracks and the descending branches of the Hadley cell (Hoerling et al 2011), as well as to thermodynamic contributions related to increased wet-day precipitation and higher condensation thresholds in warmer air (Giorgi et al 2011).
This study is incomplete in that sense that it only focuses on precipitation, neglecting the relevance of terrestrial freshwater variables including soil moisture and river flow for ecosystems and societies. Further the considered annual resolution does not allow to analyse seasonal differences, which may obscure a possible summer drying in central Europe (Gudmundsson and Seneviratne 2015a, 2015b). In addition, the spatial aggregation to pan-European macro regions does not allow for a detailed local assessment. Nevertheless the results show unprecedented evidence in support of the hypothesis that anthropogenic climate change has already affected drought risk in southern and northern Europe. Therefore the results also increase the confidence in climate model projections, suggesting increased drought risk in the Mediterranean region (Orlowsky and Seneviratne 2013, Prudhomme et al 2014). As this region is already water scarce under current climatic conditions, the presented results highlights the necessity to develop coping strategies and policies to help remedy the most adverse effects of the increasing frequency of exceptionally dry years.
Acknowledgments
This research contributes to the European Union funded projects DROUGHT-R&SPI (contract no. 282769) and EUCLEIA (contract no. 6070085). The support of the ERC DROUGHT-HEAT project (contract no 617518) is acknowledged. We thank all data providers cited in the article.