

Abstract
The observed forest carbon sink, i.e. positive net ecosystem productivity (NEP), in East Asia reported by the eddy covariance flux tower network is an integrated result of forests themselves (e.g. age) and abiotic factors such as climate. However the relative contribution of climate alone to that sink is highly uncertain and has been in debate. In this study we de-trended a primary effect of forest age on carbon sinks by a statistical regression model between NEP and forest ages. Then, modeled residual NEP was regressed against climate factors again so that its relative contribution could be evaluated appropriately in the region. The analysis for data from the 2000s showed that forest age appeared to be the primary impact factor on the carbon sink of the region (R2 = 0.347), and the mean annual temperature (MAT) was the second (R2 = 0.23), while the mean annual precipitation effect might not be as apparent as MAT. Particularly for forests in China, climate might contribute to about 31.7% of the total NEP of 0.540 Pg C yr−1. Given that forests in China are relatively young under current climate conditions, we predicted that they would be capable of atmospheric carbon sequestration in the near future.
Export citation and abstract BibTeX RIS

Original content from this work may be used under the terms of the Creative Commons Attribution 3.0 licence. Any further distribution of this work must maintain attribution to the author(s) and the title of the work, journal citation and DOI.
Introduction
Forest ecosystems have the strongest carbon fixation capacity (Dixon et al 1994) that makes a crucial contribution to atmospheric carbon sequestration. Quantitative research on forest carbon fixation capacity is the premise of understanding carbon cycling mechanisms and constituting reasonable forest management. The current challenge in quantitative research on the forest carbon sink is the inconsistency of estimations on both its magnitude and spatial distribution. The underlying causes of these inconsistencies are the variety of driving factors and the existence of interaction among factors.
Forest net ecosystem productivity (NEP) is affected by both intrinsic biotic factors, such as forest type and age (Binkley et al 2002), and extrinsic environmental driving factors, such as climate factors (Yi et al 2010) and nitrogen deposition (Magnani et al 2007). Numerous studies used climate factors alone to estimate ecosystem productivity at a large scale (Carvalhais et al 2014). Without considering biotic factors such as forest age, the observed net ecosystem exchange shows strong correlation with the mean annual temperature (MAT) at mid-to-high latitudes and appears to have strong dependence on the dryness at mid-to-low latitudes (Yi et al 2010). For East Asia, the observed NEP shows similar spatial variation that related with the spatial patterns of temperature and precipitation (Yu et al 2013). Based on a statistical model between NEP and climate factors, Zhu et al (2014) quantified a map of the largest potential NEP in China. Without considering biotic factors, this estimated NEP (Zhu et al 2014) was much higher than the values estimated from the inventory approach and models (Cao et al 2003, Fang et al 2007, Ji et al 2008, Yu et al 2010, Yuan et al 2010). There is no doubt that climate factors are important factors causing NEP variation at short-time scales (Dragoni et al 2011, Reichstein et al 2007), but if we neglect the long-term trend controlled mainly by forest age (Chapin et al 2002, Chen et al 2003) large inconsistencies with estimated NEPs will be unavoidable.
Another factor that potentially affects forest carbon sequestration is nitrogen deposition, though its role on carbon cycle is still uncertain. Some studies suggested that the effects of nitrogen deposition on carbon sequestration are not as strong as we thought because the deposited nitrogen mainly remains in the soil carbon pool and promotes soil carbon loss, and because ecosystem nitrogen saturation causes nitrate loss in multiple ways (Bragazza et al 2006, Cleveland and Townsend 2006, De Schrijver et al 2008, Sutton et al 2008). However, increasing number of studies consider that nitrogen deposition could result in stimulation of forest growth and carbon sequestration (Aber et al 1998, Magnani et al 2007). For instance, Magnani et al (2007) thought that nitrogen deposition is the most important factor causing interannual variation in NEP after removing the effect of disturbance, and Piao et al (2015) found that 41% of the trend of growing-season LAI in China could be explained by nitrogen deposition. At a regional scale, most of the results that nitrogen deposition correlates to the increase in the carbon sink were concluded only through correlation analysis or simple regressions between ecosystem productivity and the nitrogen deposition data. They might fail to reflect the actual causal relationship because nitrogen deposition also correlates to the intensity of human activities and climate factors, particularly precipitation (Sutton et al 2008), and uneven sampling effect could mislead conclusions (Du 2015).
From the perspective of plant physiology, age is the most important endogenous determinant of carbon sequestration rate and storage (Yu et al 2011, Du 2015) as they affect the maximum light-use efficiency (Li and Zhou 2015), biomass accumulation rate (Chen and Luo 2015) and relative partitioning (Peichl and Arain 2007) at both tree and stand scales (Genet et al 2010). The allometry throughout different age stages of the forest is an intrinsic determinant affecting the direction and intensity of carbon fluxes (Peichl and Arain 2007, Hui et al 2012). Forest ecosystem productivity is related to biomass, while biomass could by estimated by allometric biomass equations, which reflect the tree growth process with age (Ter-Mikaelian 1997, Hui et al 2012). Forest ecosystem productivity generally decreases with age, a similar pattern can be found in various of studies (Binkley et al 2002, Ryan et al 2004, Magnani et al 2007, Piao et al 2009, Wang et al 2011, Coursolle et al 2012, Hui et al 2012, Ter-Mikaelian et al 2014, Tang et al 2014). The effect of forest age on NEP variability over the succession course is stronger than climate and long-term environmental changes (Pregitzer and Euskirchen 2004). For instance, Yu et al (2014) found that 48.7% of the NEP could be explained by the forest age in the Asian region and indicated that the ignorance of forest age can result in an inaccurate estimation. The age-dependent relationship between NEP and forest age at long-term scale was also revealed by the data assimilation that synthesized abundant site-based biometric observation, process-based model, and spatially explicit remote sensing and GIS data sets (Zhou et al 2015).
Activities of human management and utilization of forests are becoming more frequent and extensive, disturbance to forest structure (both spatial structure and temporal structure) and extrinsic factors are often coupled together affecting the carbon sink, which makes estimations of forest NEP more uncertain. In some research, forests were grouped by age and then explored the response of carbon fluxes to extrinsic factors of each age group (Coursolle et al 2012), but there was little research on separating effects of extrinsic factors from biotic factors. Actually, the tactic exploring the effect of extrinsic factors on forest growth on the basis of age effect existed in other disciplines. In dendroclimatology, for instance, growth trend needs to be removed before exploring environmental effects on tree-ring width of individual tree or forest stand (Fritts 1976). In this study, we used a similar tactic and aimed to (1) de-trend the primary effect of forest age at long-term scale first from the observed carbon sink and then to estimate the relative contribution of climate and (2) reveal the spatial difference of climate-determined NEP with and without consideration of age effect in the East Asian region.
Data and methods
Carbon flux observations
The research region in this study is located from latitude 18° N to 54° N and from longitude 70° E to 150° E (figure S1, available at stacks.iop.org/ERL/00/000000), which includes major countries in the East Asian region (we refer to this area as the East Asian region below). We chose this region because we could extract the Chinese region to compare results. The data from the flux sites used in this study included carbon flux data (NEP), which were measured using the eddy covariance technique, forest age, meteorological data (MAT and MAP), and wet nitrogen deposition in the East Asian region. These observation data were extracted from a published literature dataset compiled by Yu et al (2014). These data from flux sites were used to generate statistical models between forest NEP and potential driving factors.
Meteorological data
The monthly temperature (MAT) and precipitation (MAP) used to generate the spatial pattern of forest NEP in this study was obtained from the Climate Research Unit (CRU), version TS3.21 (Harris et al 2014). The spatial resolution of TS3.21 was 0.5°, and we resampled them to 0.05° to match the spatial distribution of the forests. Given that the carbon flux data measured by the eddy covariance technique was obtained during the 2000s, we used the CRU data from 2001 to 2010. With these meteorological data, we generated the map of NEP attributed by climate factors. The comparisons of CRU data with flux sites meteorological measurements were shown in figure S2.
Forest distribution data
The forest distribution data were generated from MODIS land cover type data (Wu et al 2015) (https://lpdaac.usgs.gov/products/modis_overview/modis_products_table/mcd12c1). We extracted the forest area of evergreen needleleaf forests, evergreen broadleaf forests, deciduous needleleaf forests, deciduous broadleaf forests and mixed forests of the region, from latitude 18° N to 54° N and longitude 70° E to 150° E, and set it as the forest distribution map.
Methods
In this study, we aimed to de-trend the effect of forest age from observed NEPs and then to estimate the additional contribution of climate factors on NEP. Because the observed NEP reported by eddy covariance flux tower network is integrated results of forest itself (e.g. age) and abiotic factors such as climate, so the residual analysis method was used in this study to partition the relative contribution caused by different factors. Specifically, we first estimated the contribution of forest age at long-term scale through a statistical model between the observed NEP and forest age and, thereafter, retrieved the residuals of NEP that could not be interpreted by forest age. Second, we evaluated the relative contribution of climate based on the statistical model between the NEP residuals and climate factors.
To better compare the results, we also used an assessment scheme generated by Zhu et al (2014). Without considering biotic factors, Zhu et al estimated the potential carbon fluxes in China with climate factors (MAT, MAP and interaction between MAT and MAP) based on sites experiencing little disturbance and mainly dependent on climate. The assessment scheme was:
where GEP is gross ecosystem production and ER is ecosystem respiration. With Zhu's assessment scheme and our Meteorological data and forest distribution data, the potential of forest carbon fluxes contributed only by climate could be estimated. Therefore, spatial discrepancy between the NEP estimated only by climate and NEP estimated by climate after de-trending forest age could be revealed.
SPSS 20.0 statistical software was used to conduct correlation analysis, path analysis, to test the significance of regression equations, and a paired sample T test (p < 0.05) was used to test the difference between the observed flux site NEP and sum of age and climate contributed NEP. All of the statistical figures were drawn using origin 8.5 software. The spatial distribution figures for the sites and forest NEP were generated using ArcGIS 10.2 software. The mean forest NEP and average annual NEP was calculated using spatial analyst tools under ArcGIS environment.
Results
Correlation among potential predictor variables and NEP
In the East Asia region, MAT and age were significantly correlated with forest NEP at the 0.01 level, and nitrogen deposition was significantly correlated with forest NEP at the 0.05 level, while MAP did not show apparent correlation with NEP (table 1). Only MAT and forest age were in the stepwise regression equation when we conducted path analysis. Both MAT and age could indirectly affect forest NEP through the other variable (table 2).
Table 1. Correlation matrix among potential predictor variables and NEP.
| MAT | MAP | Age | Nitrogen deposition | NEP | |
|---|---|---|---|---|---|
| MAT | 1 | 0.511b | −0.293 | 0.722b | 0.616b |
| MAP | 1 | 0.105 | 0.803b | 0.156 | |
| Age | 1 | −0.408 | −0.563b | ||
| Nitrogen deposition | 1 | 0.609a | |||
| NEP | 1 |
aCorrelation is significant at the 0.05 level. bCorrelation is significant at the 0.01 level.
Table 2. Direct and indirect effect of predictor variables on forest NEP.
| Coefficient of indirect path | |||||
|---|---|---|---|---|---|
| Predictor variable | Correlation coefficient rNEP-i | Correlation coefficient rMAT-age | Coefficient of direct path | MAT | Age |
| MAT | 0.627 | −0.293 | 0.505 | / | 0.122 |
| Age | −0.563 | −0.293 | −0.415 | −0.148 | / |
The entry of variables was set using probability of F at 0.1 level. rNEP-i was the correlation coefficient between NEP and predictor variables; rMAT-age was the correlation coefficient between MAT and age.
Variation of NEP explained by forest age
In the East Asian region, a significant correlation existed between the observed NEP and forest age, with 34.7% variation of the NEP accounted for by the forest age (figure 1(a)). The regression equation generated was:


Figure 1. Relationship between the forest NEP and forest age and its residuals plot in the East Asian region. (a) Regression between NEP and forest age (n = 26, R2 = 0.347, p = 0.007). (b) Residuals of the NEP (observed minus modelled NEP) and forest age. The colour of the points is site MAT. MAT is the abbreviation of mean annual temperature.
Download figure:
Standard image High-resolution imageComparison of variation of NEP explained by climate with and without age
A statistical regression model was generated between MAT alone and observed NEP (equation (2)), which 37.9% variation of the NEP could be explained by MAT.

When we explored the relative contribution of climate on forest NEP on the basis of the tendency of forest carbon sink with age change, the primary effect of age on NEP was de-trended first. Given that forest NEP was determined multifactorially, in addition to age, the effects of other factors were also included in the NEP observations of each flux site, and we calculated the residuals between the observed and modelled NEP by equation (1), which reflect the component of the NEP that could not be explained by age. The NEP residuals no longer correlated with forest age (figure 1(b)). The plot of the NEP residual (figure 1(b)) indicated higher residuals with increasing temperature, i.e., observation sites with higher temperature tend to have higher residuals than those with lower temperature. That is, temperature had an additional contribution to NEP after de-trending the effect of age. To further highlight the pattern, we divided the flux sites into six age groups (0–50, 50–100, 100–150, 150–200, 200–250, 250–300 years) and calculated the average NEP and average MAT for the flux sites above and below the fitting curve separately (figure 2(a)), which showed that the MAT was an apparent determinant of NEP when the forest age was similar. After de-trending the effects of the forest age to NEP, we performed regression analysis between NEP residuals and MAT and found that the NEP residuals were positively correlated with MAT (figure 2(b)). The regression equation is shown in equation (3) and the model revealed that 23.0% variation of the NEP residuals could be explained by MAT.


Figure 2. Hidden information in the plot of the NEP and forest age. (a) Highlight the effect of MAT to the NEP in each age group. (b) Correlation between the NEP residuals and MAT (R2 = 0.230, p = 0.013). (c) Correlation between the NEP residuals and MAP (R2 = 0.028, p = 0.413). NEP, MAT and MAP are the abbreviations for net ecosystem productivity, mean annual temperature and mean annual precipitation, respectively.
Download figure:
Standard image High-resolution imageWe also generated the statistical model between the NEP residuals and MAP (figure 2(c)), but the results indicated that MAP had no apparent relationship with the NEP residuals at 0.05 significance level (R2 = 0.028, p = 0.413).
Effect of nitrogen deposition on NEP
Another factor that might have affected the forest NEP is nitrogen deposition. If the age effect was neglected, the observed NEP seems significantly related with the wet nitrogen (R2 = 0.444, p = 0.003) (figure 3(a)), which is similar to the relationship observed by Yu et al (2014). When the effect of the forest age on NEP was de-trended, the residual of NEP did not significantly correlate with wet nitrogen deposition anymore (R2 = 0.133, p = 0.164) (figure 3(b)). However, we would like to emphasise that it could not prove that nitrogen deposition had no significant effect on forest NEP when age was considered; it only showed that nitrogen deposition might not be a suitable predictor for regional scale NEP.
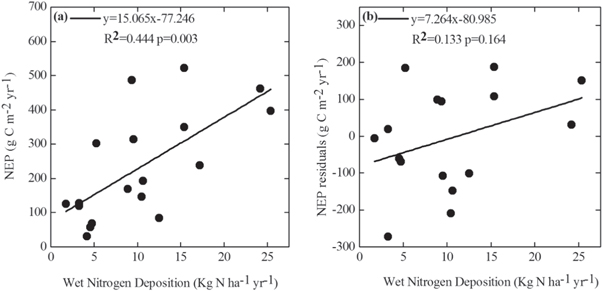
Figure 3. The relationship between the forest NEP and wet nitrogen deposition. (a) Correlation between NEP and wet nitrogen deposition (R2 = 0.444, p = 0.003). (b) Correlation between the NEP residuals and wet nitrogen deposition (R2 = 0.133, p = 0.164). N is different because the absence of the wet nitrogen deposition data and forest age data, which was involved in the calculation of NEP residuals in some flux sites. NEP is the abbreviation for net ecosystem productivity.
Download figure:
Standard image High-resolution imageSpatial patterns of climate-related NEP
With the CRU meteorology data from 2001 to 2010, MODIS land cover map and the statistical relationship between NEP and MAT, the spatial distribution of forest NEP could be estimated for the East Asian region (figure 4). The spatial distribution of NEP estimated by climate factors alone (equation (2)) was exhibited in figure 4(a), the mean forest NEP was 281.428 g C m−2 yr−1 and the total annual NEP was 1.123 Pg C yr-1. While when the primary effect of forest age was de-trended and the regression equation between the NEP residuals and MAT (equation (3)) was employed, the estimated value of mean NEP residuals was 11.575 g C m−2 yr−1 and the total annual NEP residuals was 0.046 Pg C yr−1 (figure 4(b)). The NEP residuals which indicated forest NEP contributed by climate on the basis of the tendency of forest carbon sink with age change of this region exhibited a decreasing gradient from south to north. Positive NEP was mainly located in the south and southeast, while negative NEP was located in the north and northeast.
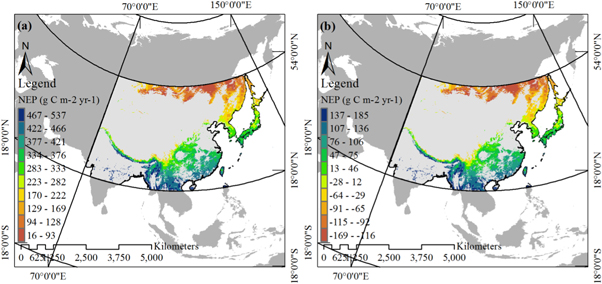
Figure 4. The spatial distributions of NEP. (a) The spatial distributions of NEP estimated by climate factor (MAT) only. (b) The spatial distributions of the NEP attributed to climate factor (MAT) after eliminating the effect of forest age in the East Asian region (unit: g C m−2 yr−1), where NEP and MAT are the abbreviation of net ecosystem productivity and mean annual temperature, respectively.
Download figure:
Standard image High-resolution imageTo further explore and better compare the results, we extracted the region of China (figures 5(a), (b)). The mean NEP of China estimated by equation (2) was 312.63 g C m−2 yr−1, and the total annual NEP was 0.540 Pg C yr−1 (figure 5(a)). While the mean NEP residuals estimated by equation (3) was 32.79 g C m−2 yr−1, and the total annual NEP residuals was 0.057 Pg C yr−1 (figure 5(b)). It indicated that when the age effect was ignored and only climate factors were considered, the carbon sink contributed by climate factors would be significantly overestimated. To strengthen the evidence, we also employed an assessment scheme generated by Zhu et al (2014), where forest age was not considered as well, to estimate largest potential of NEP (equation (4)):

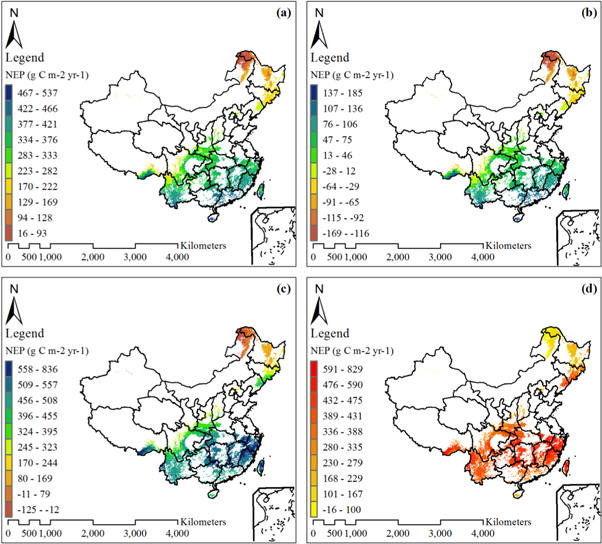
Figure 5. Spatial patterns of NEP estimations in China (unit: g C m−2 yr−1). (a) Spatial pattern of NEP without de-trending age effect (estimated by equation (2)); (b) Spatial pattern of NEP after de-trending age effect; (c) spatial pattern of NEP without de-trending age effect (estimated by equation (4)); (d) difference of NEP between (c) and (b). NEP is the abbreviation of net ecosystem productivity.
Download figure:
Standard image High-resolution imageOn the basis of this assessment scheme, we calculated the model NEP of forests and its spatial distribution in China (figure 5(c)). Although it also exhibited a decreasing gradient from the southeast to northwest, similar to figure 5(b), the magnitude of the forest averaged NEP in China was 406.94 g C m−2 yr−1 and the total annual NEP was 0.704 Pg C yr−1, which was of the similar magnitude as our estimation by equation (2) (312.63 g C m−2 yr−1 and 0.540 Pg C yr−1) where forest age was not considered either, but much higher than our estimation by equation (3) (32.79 g C m−2 yr−1 and 0.057 Pg C yr−1) where forest age was de-trended first.
A significant high spatial discrepancy (figure 5(d) (figure 5(c) minus figure 5(b))) exists between the largest potential NEP estimated by Zhu's assessment scheme (figure 5(c)) and our results (figure 5(b)), in which the age effect was de-trended first. The largest difference of forest NEP occurred in southeast China where forest NEP contributed by climate factors had been the most overestimated. Given that southeast China has a relative young forest age (Dai et al 2011, Zhang et al 2014), it could be deduced that the main reason for this higher NEP in southeastern China as attributed to forest age (equation (1)), but not attributed to climate factors. That is, in actual NEP estimations, if we ignore the effect of forest age and directly build the statistical model between NEP and climate, we would significantly overestimate the effect of climate factors on NEP.
Discussion
Impact factors in NEP estimation
In this study, we compared the results of forest NEP estimated by climate factor MAT with and without age as a restriction factor. Climate factors may better fit alone with NEP, but their effects were on the basis of age-related trend of forest productivity. After de-trending the effect of age, variance of NEP explained by climate factors was reduced from 0.379 to 0.23, and age turned to be the primary factor affecting NEP (R2 = 0.347), which consistent with many other studies (Pregitzer and Euskirchen 2004, Fang et al 2014, Du 2015). The similarity between the relationship pattern of NEP and forest age in the East Asian region in this study and in Yu et al's study (2014) of the entire Asian region indicated the stability of the relationship of NEP and age. In further estimation, if forest age is de-trended, climate contribution to forest productivities among regions will be comparable and it could be advantageous for scientists to predict the effects of climate change on forest ecosystems and their regional disparities.
MAT and MAP reflected the average heat and water condition on the regional and inter-annual scale. In most studies, this relationship was found between MAT and forest NEP (Magnani et al 2007, Piao et al 2009, Loudermilk et al 2013), while relatively less studies used MAP in the NEP statistical models. In this study, after de-trending the effect of forest age, climate factor MAT was the only factor significantly correlated with NEP. The reason that MAP did not fit well with forest NEP in the East Asian region might due to the fact that precipitation was not a major limitation of ecosystem productivity in this region, particularly in areas where forest stands were developed. Another reason may be that only part of the precipitation was related to the ecosystem carbon gain due to water-use efficiency and that the ecosystem water-use efficiency differs strongly depending on factors such as vegetation types, meteorological conditions and disturbances.
The significant correlation between NEP and wet nitrogen deposition weakened after de-trending the effect of forest age on NEP in the East Asian region. It may indicated that the effect of wet nitrogen deposition on NEP could be largely explained by forest age on a scale like that of the East Asian region. The potential reason was most likely related to human activities because regions where frequent afforestation activities occur were often consistent with regions where intense human industrial activities occur. Thus, the regions where forest age was relatively lower might also have relatively higher wet nitrogen deposition. However, nitrogen deposition data is relatively less and its effect on carbon sink is complex and uncertain (Fleischer et al 2015). Therefore, control experiments performed on smaller scales would be more helpful to understand the mechanism underlying these issues.
Accuracy evaluation of the NEP contributed by climate factors
To test the accuracy of estimating NEP by forest age and climate factors separately, we used our decoupling method and forest flux sites data of the East Asian region (from latitude 18° N to 54° N) and the complete dataset of the Asian region (from latitude 2° N to 65° N) collected from Yu et al (2014), to estimate the NEP contributed by forest age and climate factors separately. We then compared the sum of the age and climate contributed NEP with the flux site observed NEP. Equations (1) and (3) were used to estimate the forest age contributed NEP and climate contributed NEP after de-trending the effect of age in the East Asian region. Equations S1 and S2 were used to estimate the forest age contributed NEP and climate contributed NEP after de-trending the effect of forest age in the whole Asian region (figure S4, table S2). Furthermore, NEP estimations were presented in 10° latitude bins (figure 6). No significant difference existed between the flux site NEP and the sum of the age and climate contributed NEP in either region scale, which indicated that our method of estimating NEP was reliable.
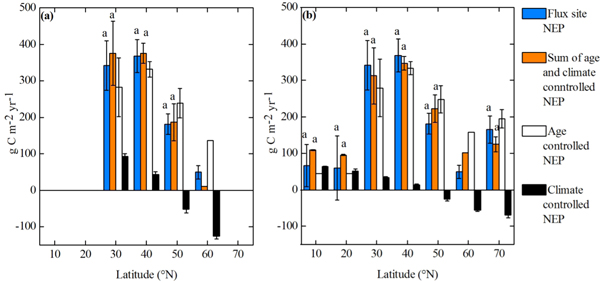
Figure 6. Estimates of NEP for 10° latitude bins in (a) the East Asian region and (b) Asian region. Columns indicate the latitudinal estimates of NEP by site observations (blue) (n = 2, 3, 4, 14, 9, 2, 4 in each bin), by forest age (white) (n = 2, 2, 4, 12, 9, 1, 4), by climate factors after eliminating the age effect (black) (n = 2, 3, 4, 14, 9, 2, 4), and by the sum of NEP estimated by age and climate factors (red). The error bars represent ±1 SE. Lowercase letters indicate no significance difference at level of 0.05.
Download figure:
Standard image High-resolution imageUncertainties
The carbon flux data and forest age data strongly relied on flux sites; the accuracy of NEP estimation was highly influenced by the number and spatial distribution of the sites. Most of the old forests were in cold regions and most young forests were in warm regions (figure 1(a)). To balance these defect, cold region with young forests and warm region with old forests should be given more consideration when selecting the location of flux tower sites.
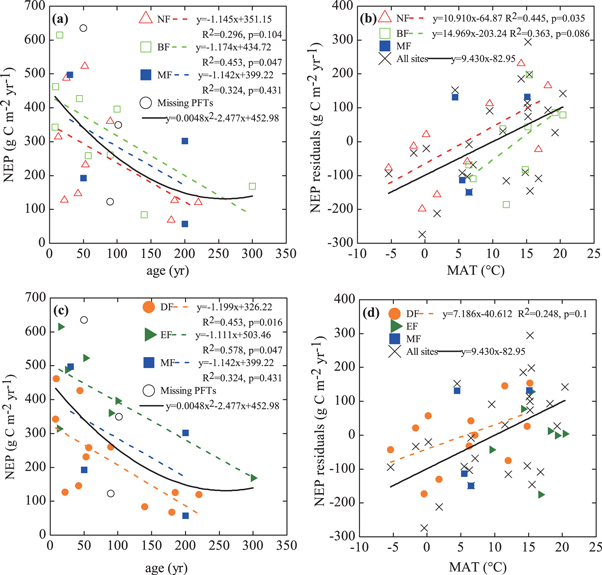
Another uncertainty was caused by plant functional types (PFTs) aggregation because aggregate data could hide or misrepresent the relationship of NEP with age and climate of each PFTs. To address this issue, each PFTs data should be analysed before data aggregation (Clark et al 2011). In this study, we divided the forest ecosystem into PFTs employing two different ways to test the stability of the relationship of NEP with age and climate (figure 7), so it could make up for the limited number of flux sites to some extent. The decline trends of NEP with age were similar among different PFTs, the slopes of models (NEP with age) were almost the same (figures 7(a), (c)). Although the mean NEP of needleleaf forest was greater than broadleaf forest (figure 7(a)), and the mean NEP of evergreen forest was greater than deciduous forest (figure 7(c)), the differences were not necessarily resulted from PFTs but because of the relative higher temperature range (figures 7(b), (d)). No obvious trend of NEP residuals with MAT showed in evergreen forests (figure 7(d)), it might because evergreen forests distributed in a relatively narrow temperature range. Therefore, data aggregation could cause estimation error, but with more forest sites and larger age and temperature range, the general characteristic of NEP with age and MAT could be represented better at forest ecosystem level.
Figure 7. The difference in model among plant function types. (a) Difference of NEP with age among NF, BF and MF. (b) Difference of NEP residuals with MAT among NF, BF and MF. (c) Difference of NEP with age among DF, EF and MF. (d) Difference of NEP residuals with MAT among DF, EF and MF. NF, BF, DF, EF and MF are the abbreviations for needleleaf forest, broadleaf forest, deciduous forest, evergreen forest and mixed forest, respectively.
Download figure:
Standard image High-resolution image
The contribution of climate on forest NEP in China
Approximately 23% of the NEP residuals could be explained by MAT after de-trending the effect of forest age. The scatter plot indicated that the variation of the NEP residuals in the younger forest age stage was higher (figure 1(b)), which could suggest that temperature changes may had stronger effects on young forests. In China, frequent and intense afforestation activities in recent decades have reduced the average forest age (Dai et al 2011), and combined with the monsoon climate, temperature changes will have a stronger effect in the China region. The coefficient of independent variable MAT in equation (2) is larger than in equation S2 (table S2), indicating that temperature changes have a stronger effect in the East Asian region where China is located compared to the whole Asian region. Thus, facing the global warming situation, the forest of the latitude band where China is located has a greater potential for carbon sequestration.
If forest age was not taken into consideration when estimating the forest NEP, then the effects of climate might be magnified. The forest NEPs estimated mainly from climate factors were about 10 to 12 times higher (depended on estimated methods) than the NEP contributed by climate factors (MAT) after de-trending the effect of the forest age (table S3) in China, and they were dramatically higher than the value presented by Pan et al (2011), which was estimated using inventory data and long-term field observations coupled to statistical or process models.
On the basis of forest inventory data, Pan et al (2011) revealed that the annual total carbon sink, which is contributed by all natural and human factors, in China's forests was 0.18 Pg C yr−1 from 2000 to 2007. When this magnitude was used as a reference value, we found that climate contribution on NEP on the basis of the tendency of forest carbon sink with age change accounted for 31.7% of the total NEP in our study.
Conclusion
In East Asia, forest age appeared to be an important factor on forest NEP (R2 = 0.347). When age was fixed, climate factors turned into determinant of NEP. After de-trending the long-term effect of age, MAT explained 23% of NEP variance. The effect of wet nitrogen deposition on NEP weakened after de-trending the effect of forest age in the East Asian region. In China, climate contributed NEP took 31.7% of total NEP of 0.540 Pg C yr−1, while if age effect was not de-trended, discrepancy between the potential NEP estimated only by climate and NEP estimated by climate after de-trending forest age could be over 12 times.
Acknowledgments
This work was supported by the National Natural Science Foundation of China (41571185 and 41321001), the National Basic Research Program of China (2012CB955401), the Fundamental Research Funds for the Central Universities (2015KJJCB33), and the New Century Excellent Talents in University (NCET-10-0251).