

Abstract
We examine the influence of winter and summer Arctic Oscillation (AO) on variations in the September Arctic sea ice extent (SIE). The winter and summer atmospheric patterns associated with year-to-year variations and detrended September SIE correlate with the positive winter AO and the negative summer AO, respectively. However, the interannual variations of winter and summer AO indices after 2007 are more weakly connected with year-to-year variations in the September SIE. Since 2007, the surface air temperatures over the Beaufort, Chukchi and East Siberian Seas are related to the interannual variations of the September SIE. Recent summer atmospheric patterns associated with the September SIE correlate with the summer AO pattern, but the summer anticyclonic circulation over the Arctic favours the recent low September SIE more than the seesaw pattern between mid- and high- latitudes. Recent winters' positive AO have not contributed to the recent low September SIE because winter anticyclonic circulation over northern Eurasia is more directly connected with recent September SIE.
Export citation and abstract BibTeX RIS

Original content from this work may be used under the terms of the Creative Commons Attribution 3.0 licence. Any further distribution of this work must maintain attribution to the author(s) and the title of the work, journal citation and DOI.
1. Introduction
Several studies have investigated and discussed the influence of important components in atmospheric circulation patterns over the Northern Hemisphere, such as the Arctic Oscillation (AO) and the North Atlantic Oscillation, and their influence on Arctic sea ice extent (SIE) (e.g. Deser et al 2000, Rigor et al 2002, Deser and Teng 2008, Stroeve et al 2011). The AO (Thompson and Wallace 1998, 2000) represents the variability in pressure patterns over the Northern Hemisphere and is an important factor in the wintertime atmospheric conditions of the Northern Hemisphere. Rigor et al (2002) and Rigor and Wallace (2004) showed that a positive mode of the winter AO could induce negative anomalies in sea ice concentration during the following summer. Since the early 1990s, however, the trend of the winter AO index has been in a more neutral state and Arctic SIE has continued to decline (e.g. Overland and Wang 2005, Serreze et al 2007). The AO was in its most extreme negative phase during the winter of 2009/2010, yet a large amount of summer melt occurred during the summer melt season of 2010 (Stroeve et al 2011). Thus, the influence of the winter AO on Arctic SIE remains poorly understood.
The dominant summer mode of the atmospheric circulation, namely, the summer AO was defined by Ogi et al (2004) using a separate empirical orthogonal function (EOF) analysis for each individual calendar month. In contrast, Thompson and Wallace (1998) used a single EOF analysis for all calendar months. The summer AO as defined by Ogi et al (2004) has a smaller meridional scale than the conventional AO presented by Thompson and Wallace (1998, 2000). The conventional AO of Thompson and Wallace (2000) predominantly reflects atmospheric variability during winter and does not capture the dominant atmospheric patterns of other seasons (Ogi et al 2004, Tachibana et al 2010).
Ogi and Wallace (2007) found that low September SIE tended to be preceded by anticyclonic summer anomalies over the Arctic Ocean. We note that the summer anticyclonic circulation pattern related to low September SIE may be correlated with the summer AO index defined by Ogi et al (2004). Ogi and Yamazaki (2010) showed that the seasonal sea ice retreat from May to September revealed a strong correlation with the summer AO. The summer AO also appear to play a role in summer weather and climate such as anomalous weather in mid-latitudes of the Northern Hemisphere (Ogi et al 2005, Tachibana et al 2010, Otomi et al 2012).
A number of previous studies have focused on either the effect of the preceding winter AO or the concurrent summer AO on September SIE. Within this study we consider the effect of the winter AO and the summer AO on the September SIE simultaneously. We think that it is important to consider the influence of both the winter AO and the summer AO on September SIE and its interannual variation due to the control which both dynamic and thermodynamic processes have on coupled ice motion, melt and decay. In this study, we examine whether wintertime and/or summertime AOs play an important role for year-to-year variations of Arctic September SIE.
Both year-to-year variations and multi-decadal trends of the September SIE were highly correlated with variations in sea-ice concentration over the marginal seas to the north of Alaska and Siberia (Ogi and Wallace 2007). Arctic sea ice has retreated rapidly in the recent decade and we consider separately the year-to-year variations and multi-decadal trends of the relationship between Arctic sea ice and atmospheric circulation. Finally we will discuss the influence of atmospheric circulations associated with AO (both winter and summer) on the September SIE with respect to both inter- and intra-annual variability.
2. Data
For the period from 1979 to 2014 we use the winter AO index as defined by Thompson and Wallace (1998, 2000), which is available from the Climate Prediction Centre, and the summer AO index as defined by Ogi et al (2004).
The passive microwave record of daily sea ice concentration fields from 1979 to 2014 was obtained from the National Snow and Ice Data Center and used to determine September SIE. Sea ice concentration is derived from passive microwave brightness temperatures using the NASA Team sea ice algorithm (http://nsidc.org/data/docs/noaa/g02135_seaice_index/index.html). Within this study we analyze the raw and detrended September SIE data, while also calculating an index of the one-year difference in September SIE ( SIE). The ∆SIE index is derived from
  SIE = SIE(Yr1) − SIE(Yr0), the change in September SIE from one year to the next.
Monthly fields of sea level pressure (SLP) and near surface (2 m) air temperature (T2m) were retrieved from the National Centers for Environmental Prediction/National Center for Atmospheric Research reanalysis data set from 1979 to 2014 (Kalnay et al 1996, http://esrl.noaa.gov/psd/data/gridded/data.ncep.reanalysis.derived.html). Within this study 'winter' 'summer' and 'autumn' are defined as December–January–February, June–July–August, and September–October–November, respectively. As a result the winter of 1980 represents the mean of December 1979, and January and February 1980.
3. Results
Figure 1 shows the patterns in winter (top row) and summer (bottom row) SLP anomalies regressed on inverted  SIE (left column), raw (middle column) and detrended (right column) September SIE time series for the period of 1979–2014. The winter SLP anomalies regressed on −
 SIE exhibit negative anomalies over the Arctic and the northern North Atlantic, especially strong negative anomalies are apparent over the northern North Atlantic. This winter pattern associated with −
 SIE suggests an enhanced sea ice export out of the Barents Sea toward the North Atlantic Ocean during winter, which may be contributing to the significant negative trends in sea ice concentration during winter in the Barents Sea (Deser and Teng 2008, Ogi and Rigor 2013). The SLP anomalies based on the variations in the inverted detrended September SIE (figure 1(c)) are also similar to the SLP anomalies in relation to the −
 SIE (figure 1(a)). The positive SLP anomalies in relation to the inverted raw September SIE (figure 1(b)) are strongly apparent over northern Eurasia.
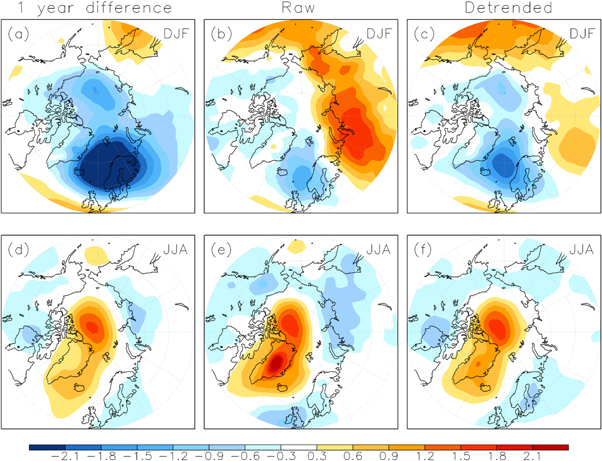
Figure 1. Winter SLP anomalies (hPa) regressed on the inverted (a) one-year difference, (b) raw, and (c) detrended September Arctic SIE indices from 1980 to 2014. Figures 1(d)–(f). As in figures 1(a)–(c), but for summer SLP anomalies.
Download figure:
Standard image High-resolution imageAll patterns of summer SLP regressed on the inverted September SIE fields are characterized by anticyclonic circulation SLP anomalies over the Arctic Ocean (figure 1 bottom row). Positive SLP anomalies across the Pole suggest a surface wind flow from the Beaufort and Chukchi Seas toward Fram Strait, and have favoured enhanced sea ice export from the Arctic toward Fram Strait.
Figure 2 shows the SLP anomalies regressed on (a) winter AO and (b) inverted summer AO indices. Both winter and summer AO patterns are characterized by a seesaw between mid- and high-latitudes, though the seesaw is reversed between the two seasons. However, a smaller area of SLP anomalies is observed during summer than during winter, and the area of greatest SLP anomalies is displaced poleward during summer as compared to during winter.
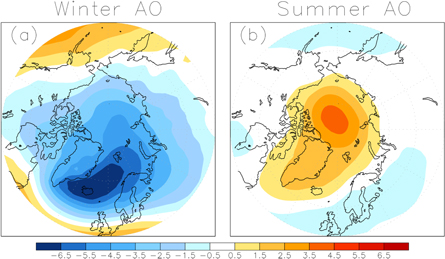
Figure 2. SLP anomalies regressed on (a) the winter and (b) the inverted summer AO indices from 1979 to 2014. These patterns are (a) the winter positive AO and (b) the summer negative AO.
Download figure:
Standard image High-resolution imageThe winter AO index shown in figure 2(a) is characterized by cyclonic SLP anomalies over the high-latitudes, especially over the Norwegian and Greenland Seas. These negative anomalies would have a strong cyclonic circulation with the flow directed toward and through Fram Strait, and southward along the East coast of Greenland. The pattern based on the winter AO resembles the winter atmospheric pattern regressed on the − SIE and the inverted detrended September SIE shown in figures 1(a) and (c).
The summer SLP anomalies regressed on all September SIE indices (figures 1(d)–(f)) show similar patterns to the negative summer AO with a strong anticyclonic circulation over the Arctic Ocean. Ogi and Wallace (2007) showed that the summer anticyclonic circulation over the Arctic favoured low September SIE by producing an anomalous Ekman drift of ice from the marginal seas toward the central Arctic. The present study shows clearly that the dominant pattern of summer anticyclonic circulation in relation to low September SIE is similar to the negative phase of the summer AO.
To assess the relationship between the regression patterns in relation to September SIE and winter-summer AO, the correlation coefficients are shown in table 1. All correlation coefficients are high, except for the coefficient between the raw September SIE and winter AO. These results are consistent with figures 1 and 2 where winter SLP anomalies dominate the negative anomalies over East Greenland and the summer positive anomalies over the Arctic influence the decrease of September SIE. In addition, these SLP anomalies are quite similar to the winter and summer AO patterns (figure 2), except for the raw September SIE and winter AO (figure 1(b)).
Table 1. Correlation coefficients: regression pattern correlations (poleward of 60°N) in figures 1 and 2.
| September SIE | One-year difference | Raw | Detrended |
|---|---|---|---|
| Winter AO | 0.83 | 0.17 | 0.67 |
| Summer AO | 0.74 | 0.80 | 0.88 |
To assess the influences of both winter and summer AO on the September SIE, using the winter and summer AO indices (figure 3(a)),  SIE is predicted by a multiple regression model with cross validation, withheld one year at a time in making regression model and predicting
  SIE for the withheld year. The prediction model based on the cross validated results has been used in previous studies (Ogi et al 2008). The predicted time series of the
  SIE index is good from 1980 to 2007, however, after 2007 the prediction becomes less accurate (figure 3(b)).
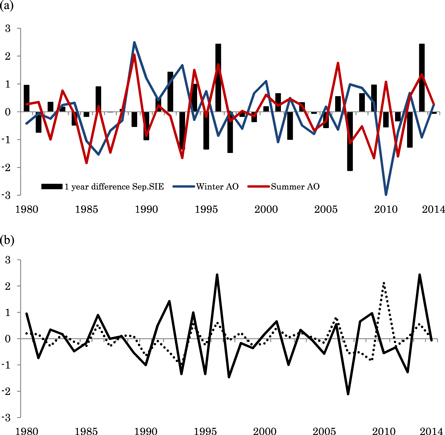
Figure 3. (a) Time series of one year difference of September SIE (black bar), winter AO (blue line) and summer AO (red line) from 1980 to 2014. (b) Observed (black line) and predicted (dotted line) one-year difference of September SIE using a prediction model with winter AO and summer AO indices from 1980 to 2014.
Download figure:
Standard image High-resolution imageOf course this raises the question—Why is the prediction of  SIE index poor after 2007? Figure 4(a) shows the linear trend in near surface air temperatures (T2m) from 1979 to 2014. The autumn T2m has a strong trend over the Beaufort, Chukchi and East Siberian Seas. The time series of the detrended autumn T2m and
  SIE are well correlated since 2007 (figure 4(b)). Since the 2007 September sea ice minimum open water has become more prevalent in the Beaufort, Chukchi and East Siberian Seas. As a result surface waters in these Seas are capable of absorbing much more solar heat during summer, thereby accelerating the ice albedo feedback loop (e.g. Babb et al 2016). The increased role of this process has altered the climatological state of these Seas and may be responsible for the weakened relationship between the AO and September SIE since 2007 even if the AO has the same pattern and same forcing both before and after 2007. This result is consistent with sea-ice concentration assessments summarized across the Arctic marginal ice zones in a recent study of open water fractions, and trends, in different areas of the Arctic as a function of season (Barber et al 2015).
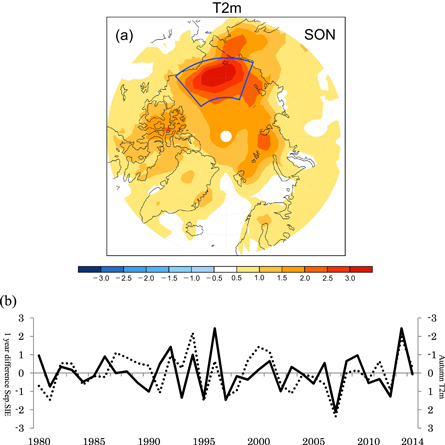
Figure 4. (a) Linear trend in autumn T2m from 1979 to 2014 (blue box area is longitude 160°E–220°W and latitude 70°–80°N). (b) Time series of one year difference of September SIE (black line) and detrended autumn T2m (dotted line, blue box in figure 4(a), inverted an axis) from 1980 to 2014.
Download figure:
Standard image High-resolution imageConcerning the September SIE decrease, figure 5 shows winter and summer linear trends in SLP for comparison with the regression patterns in figures 1 and 2. The winter SLP has a strong positive trend over northern Eurasia that extends over the marginal seas north of Eurasia. The summer SLP has a strong positive trend over the Arctic Ocean and Greenland, and negative trend over northern Eurasia and Alaska. These atmospheric trends are similar to the regression patterns of the raw September SIE (figures 1(b) and (e)); therefore the large negative trend in September SIE appears to be connected with the positive anomalies during winter over northern Eurasia, and the positive anomalies during summer over the Arctic Ocean. During the winter of 2009/2010 the AO was in an extreme negative phase, yet the Arctic ice pack melted considerably during the summer of 2010. Stroeve et al (2011) pointed out that this reflects a pronounced difference in atmospheric circulation during the winter of 2009/2010 compared to the mean anomaly pattern based on past negative AO events. The summer atmospheric pattern in recent years has a persistent change relative to previous decades that suggests an enhancement of the Arctic Dipole (AD, Overland et al 2012). Wang et al (2009) argued that the summer AD pattern is actually different than the summer AO pattern. The AD anomaly produced a meridional wind anomaly that drove sea ice out of the Arctic from the Western to the Eastern Arctic toward Fram Strait. Recent record lows of Arctic sea ice were found to be triggered by the AD pattern (Overland et al 2012). The persistent changes in recent atmospheric patterns both in winter and summer might be the reason that the connection between the AO and September SIE appears to have weakened since 2007.

Figure 5. As in figure 4(a), but SLP trends for (a) winter and (b) summer.
Download figure:
Standard image High-resolution image
4. Discussion and conclusions
We have provided evidence that both winter and summer AO are correlated with year-to-year differences of the September Arctic SIE ( SIE). The atmospheric patterns are characterized by winter cyclonic circulation anomalies over East Greenland and summer anticyclonic circulation anomalies over the Arctic that are similar to the AO during both winter and summer. The winter and summer AO indices proved to be a good predictor of
  SIE from 1979 to 2007. However, the predicted
  SIE using the winter and summer AO indices was poor after 2007. Results from our study point out that autumn surface temperature over the Beaufort, Chukchi and East Siberia Seas are closely related to September SIE since 2007. Zhang et al (2013) showed that preconditioning toward thinner sea ice, a ∼ 40% reduction in sea ice volume over 2007–2011, and the presence of ocean heat in the near surface created the 2012 record low Arctic SIE. Kwok and Cunningham (2010) showed that the loss of multiyear sea ice associated with melt in the Beaufort Sea during summer contributed directly to the depletion of Arctic multiyear sea ice coverage, especially after 2000. Serreze et al (2009) and Screen and Simmonds (2010) pointed out that the recent Arctic warming signal is linked to open water areas while the recent sea ice reduction during summer and early fall allows a strong transfer of heat from the ocean to the atmosphere in the subsequent late fall to winter. Screen and Simmonds (2010) furthermore provided the quantitative evidence of an increase in oceanic heat loss that helps explain the enhanced surface warming. Walsh (2014) also showed that the warming after 2007 is strongest over the Arctic Ocean during autumn and winter seasons. The period coincides with the greatest loss of sea ice, and the reduction of sea ice cover during the season of strong solar radiation reduces the albedo enabling the upper ocean to absorb heat that can be released back to the atmosphere during autumn and early winter. A series of papers, derived from overwintering of the Canadian Research Icebreaker (CCGS Amundsen) during the international Polar Year Circumpolar Flaw Lead study (Barber et al 2009) showed that 2007 represented a regime shift in the Arctic marine system affecting many aspects of not only the sea ice dynamic and thermodynamic processes (e.g. Barber et al 2012a) but also the atmospheric boundary layer (e.g. Raddatz et al 2012), and many biogeochemical processes in the Southern Beaufort Sea (e.g. Barber et al 2012b). It is interesting to note that extensive field data shows a clear demarcation in 2007 as does this correlation analysis with the AO and sea ice processes.
Winter and summer SLP trends anomalies (figure 5) are associated with the large negative trend of September SIE (figures 1(b) and (e)). Ogi and Wallace (2012) pointed out that the pressure circulation over the Arctic in the summer from 2007 to 2011 has been much more anticyclonic than during previous years and that change in the anticyclonic circulation has contributed to the lower trend in recent September SIE. In addition, wind forcing is more direct than the SLP, and the flow of sea ice from the Arctic toward Fram Strait both in winter and summer would act to reduce the Arctic sea ice. The AO patterns are consistent with the wind patterns, but the statistical correlations between sea ice and wind are higher than those between sea ice and SLP because the physical relationship is more direct. Actually, the summer winds over the Arctic during 2007, 2010 and 2011 contributed to the low Arctic SIE due to their strong anticyclonic wind anomalies over the Arctic and an anomalous ice export toward Fram Strait (Ogi and Wallace 2012).
The winter positive SLP trend over northern Eurasia is large and the positive anomaly is connected with the September SIE decline. The winter trend pattern is not similar to the winter AO pattern. Honda et al (2009) showed that the Siberian coast ice, especially the change of ice concentration over the Barents–Kara Seas is connected with anticyclonic anomalies extending from Eastern Europe to the West Siberian Plain. The winter sea ice concentrations over the Barents–Kara Seas have large negative trends (Ogi and Rigor 2013). This recent decrease may be connected with recent positive SLP anomalies. Holland and Stroeve (2011) also pointed out that the winter AO and summer ice extent correlation had weakened in recent years, and suggested that a weaker winter AO might contribute to the September ice cover extent. After the record low September SIE in 2007, it appears that ocean behaviour changed significantly from the preceding climatology.
Acknowledgments
This study is supported by the Canada Excellence Research Chairs program and the Canada Research Chairs program. It is a contribution from the Arctic Science Partnership and ArcticNet. We thank John E Walsh, Bunmei Taguchi and David G Babb for helpful comments. We also thank two anonymous reviewers for their comments and suggestions.