


Abstract
Previous studies found that Central Equatorial Africa (CEA) has experienced a long-term drying trend over the past two decades. To further evaluate this finding, we investigate possible mechanisms for this drought by analyzing multiple sources of observations and reanalysis data. We examine the atmospheric circulation changes related to sea surface temperature (SST) variations that control the equatorial African rainfall. Our results indicate that the long-term drought during April, May and June over CEA may reflect the large-scale response of the atmosphere to tropical SST variations. Likely the drought results primarily from SST variations over Indo-Pacific associated with the enhanced and westward extended tropical Walker circulation. These are consistent with the weakened ascent over Central Africa that is associated with the reduced low-level moisture transport. The large-scale atmospheric circulation changes associated with a weaker West African monsoon also have some contribution. These results reinforce the notion that tropical SSTs have large impacts on rainfall over equatorial Africa and highlight the need to further distinguish the contribution of SSTs changes (e.g., La Niña-like pattern and Indian Ocean warming) due to natural variability and anthropogenic forcing to the drought.
Export citation and abstract BibTeX RIS
1. Introduction
Rainfall trend and variability across Africa have received much attention during the past few decades (Giannini et al 2008, Maidment et al 2015). For example, many studies focus on the multi-decadal Sahel drought (e.g., Zeng 2003, Dai et al 2004) and the decline in the spring rains over Eastern Horn of Africa (Williams and Funk 2011, Lyon and DeWitt 2012, Yang et al 2014). The interannual and multi-decadal rainfall features over Southern Africa have also been detected (Richard et al 2001, Hoerling et al 2006). Central Equatorial Africa (CEA), on the other hand, is the least studied region in Africa and is a region that has been the subject of much less investigation than other large-scale convective regions in the tropics (Washington et al 2013).
Equatorial Africa, where the second largest tropical rainforest on Earth is located, has experienced a long-term drying trend (Malhi and Wright 2004, Yin and Gruber 2010, Asefi-Najafabady and Saatchi 2013, Diem et al 2014), while similar multi-decadal/chronic droughts are absent over other tropical rainforests (e.g., Amazon and Southeast Asia). A recent study detected a widespread decline in forest photosynthetic capacity over the Congo Basin and attributed this large-scale decline, at least partially, to this drying trend (Zhou et al 2014). Tropical rainforests have the potential to modulate climatic changes via feedbacks to the climate system. A continued decline of photosynthetic capacity and moisture content driven by a persistent drying trend could alter the composition and structure of the rainforests and thus impact biodiversity and carbon storage (Nepstad et al 2007, Enquist and Enquist 2011, Fauset et al 2012, Chambers and Roberts 2014). Hence, understanding the nature and cause of this drought and assessing its impacts on the forests are of significant societal, economic and environmental importance.
Oceanic conditions, especially sea surface temperatures (SSTs), have been highlighted as the driver for rainfall variations over Africa and other regions (Giannini et al 2003, Lu and Delworth 2005, Hoerling et al 2006, Shanahan et al 2009, Dai 2013). Previous studies have attributed the African droughts to changes in SST patterns in the Atlantic and Indian Ocean (Hagos and Cook 2008, Lu 2009, Ting et al 2009). The recent drought in the Eastern Horn of Africa is related to the SST warming in the Indian Ocean (Funk et al 2008, Williams and Funk 2011) and the multi-decadal SSTs variations in the tropical western Pacific (Lyon and DeWitt 2012). Hoerling et al (2006) proposed that the steady warming in the Indian Ocean enhances convection over those warm waters and thus drives drying via subsidence over Southern Africa. They also concluded that the Sahel drought mainly results from the inter-hemispheric Atlantic SST contrast and the associated southward displacement of the Intertropical Convergence Zone. Although the Indian Ocean and Atlantic Ocean are the key regions responsible for rainfall variability over Africa, the Pacific SST forcing also has influences via its impacts on atmospheric circulation (Seager et al 2003, Lyon and DeWitt 2012, Yang et al 2014, Dong and Dai 2015).
Compared to elsewhere in Africa, we know relatively little about the long-term drought over the CEA and its mechanisms due to lack of observations (Nicholson and Grist 2003, Todd and Washington 2004). In addition, the linkages between the equatorial African rainfall and SSTs in the tropical Atlantic, Pacific and Indian Oceans are extremely complex and differ substantially by season (Balas et al 2007, Farnsworth et al 2011, Dezfuli et al 2015). Here we explore the nature and cause of this long-term drought over the CEA that covers the majority of the intact African rainforests, and identify possible large-scale mechanisms by examining rainfall and potential SST variations associated with atmospheric circulation. The rest of this paper is organized as follows. Section 2 describes the study region, data and methods. The results are presented in section 3. The study concludes with a brief summary and discussion in section 4.
2. Study region, data and methods
2.1. Study region
CEA is the world's third most extensive region of deep convection and tropospheric heating and associated with this convection is a primary driver of the tropical general circulation (Todd and Washington 2004). This study focuses on the broad contiguous swath of land of CEA (10°S–8°N, 14°E–32°E; box in figure 1) covering the Congo Basin and surrounding areas. The chosen study region is slightly bigger than that of Zhou et al (2014) whose exclusive emphasis is the intact central Congo rainforest, in order to investigate the possibility that the Congo drought may reflect a large-scale pattern of rainfall changes over CEA as discussed above. The forested areas in West Africa are not included as these regions have experienced extensive deforestation and other human-induced land cover and land use change (Zhou et al 2014).

Figure 1. Spatial patterns of climatological AMJ rainfall (mm d–1) from GPCC (1950–2014) and GPCP (1979–2014). The rectangular box (10°S–8°N, 14–32°E) indicates the study region over Central Equatorial Africa (CEA).
Download figure:
Standard image High-resolution image2.2. Observational and reanalysis data
CEA has the lowest gauge density in sub-Saharan Africa (Washington et al 2013) and a dramatic decline in the number of rain gauges, especially after 1980s (Asefi-Najafabady and Saatchi 2013, Zhou et al 2014). Maidment et al (2015) found distinct differences in the Central African rainfall trends in both sign and magnitude among multiple datasets. Lack of adequate observations presents a big challenge for understanding the rainfall variability and climatic changes in this region. To compensate for the lack of observed data, we combine both ground observations and satellite retrievals to represent rainfall quantities and characteristics.
Observational gridded monthly rainfall data sets from the Global Precipitation Climatology Centre (GPCC, Schneider et al 2014) at 1° × 1° resolution (1950–2014) and the Global Precipitation Climatology Project (GPCP, Adler et al 2003) at 2.5° × 2.5° resolution (1979–2014) are used in this study. The gauge-based GPCC data combines the Full Data Product (V7), based on quality-controlled data from 67 200 stations world-wide that feature record durations of ten years or longer, and the monitoring product, based on quality-controlled data from 7000 stations. The latest GPCP data provides the combined precipitation product derived from satellites and gauge measurements (together with other major improvements). We also use gauge observations archived from the recent rainfall records, such as for Congo-Brazzaville, Gabon, Nigeria, the Central African Republic and Cameroon over the period 1979 to 2014, which confirm the downward trend as shown in GPCC and GPCP (personal communication with one of the authors, S E Nicholson). To examine global SST variations, the updated monthly SST dataset is obtained from the UK Met office Hadley Centre's Global Sea Ice and SST (HadISST; Rayner et al 2003). The GPCC data are bilinearly interpolated into grid boxes (2.5° × 2.5°), consistent with the GPCP data resolution for ease of comparison on spatial features.
To examine the long-term variability of atmospheric circulation and related fields, we use two reanalysis products, the European Centre for Medium-Range Weather Forecast interim reanalysis (ERA-Interim) for the period 1979–2014 (Dee et al 2011) and the National Aeronautics and Space Administration (NASA) Modern-Era Retrospective Analysis for Research and Applications, version 2 (MERRA2) for the period 1980–2014 (Molod et al 2015). Monthly mean variables of geopotential height (HGT), wind, and moisture flux at 850 hPa are used. With updated data assimilation systems, the ERA-Interim reanalysis represents the currently state-of-the-art reanalysis and is expected to have higher quality than other reanalyses (e.g., Mooney et al 2011, Bao and Zhang 2013, Lin et al 2014, Naud et al 2014). Similarly, MERRA2 is the latest reanalysis produced by NASA's Global Modeling and Assimilation Office using the Goddard Earth Observing System, version 5, data assimilation system (GEOS-5, Rienecker et al 2011) and makes many improvements and updates to the data assimilation GCM model and observing system (Molod et al 2015). We consider these two reanalysis products because of their inclusions of homogeneous satellite observations with global coverage into the data assimilation systems, which may help, in particular, to reduce uncertainties over regions, such as the CEA, with a paucity of data.
2.3. Methods
The seasonal cycle of rainfall in CEA is bimodal with two rainfall peaks in the transition seasons of September to November and March to May (Washington et al 2013). As the relationships between the CEA rainfall and SSTs are very complex and vary significantly by season (Balas et al 2007, Farnsworth et al 2011), here we focus only on the three-month period of April, May and June (AMJ), the first of the two peaks growing seasons over CEA, when the drying trend is most significant and its impacts on photosynthetic activity of vegetation are most pronounced (Zhou et al 2014).
Two methods are used to examine the variations in rainfall and associated changes in atmospheric circulation. The first method is to estimate a linear trend using least squares regression and the slope of the regression is defined as the trend per decade. Student t test is applied to quantify the statistical significance of the trend. The second method is to use composite analysis to quantify the changes between wet and dry periods. As the rainfall over our study region has decreased significantly since 1990s, we define two 15-year periods 1979–1993 and 2000–2014 from the ERA-Interim reanalysis as the dry and wet periods, respectively. For the MERRA2, the dry period (2000–2014) is compared against the wet period (1980–1993). Note that the wet and dry periods can be defined differently such as the choice of the last and first 10 or and 18 years for the composite analysis but similar results will be obtained. These two methods should bolster our confidence if consistent results are obtained.
3. Results
3.1. Long-term drying trend in observations
Figure 1 shows the climatology of AMJ rainfall patterns from GPCC and GPCP. There is generally more rainfall over the Guinea coast, Congo Basin and Ethiopian highlands. Maximum rainfall occurs along the coast of Guinea exceeding 6 mm d−1, just north of the equator. Within the study area of CEA rainfall exceeds 4 mm d−1 from roughly 8°N to 5°S. Despite their differences in temporal coverage, GPCC and GPCP are mostly identical, with a spatial correlation of 0.99 across Africa (n = 896, p < 0.01), and thus provide consistent rainfall patterns over the study region. It is also worth noting that GPCC and GPCP are not independent from each other (Adler et al 2003), but both are considered because GPCP provides more reliable information over the Congo Basin where there are limited gauges numbers.
Figures 2(a) and (b) display the spatial patterns of rainfall trend from GPCC (1950–2014) and GPCP (1979–2014), respectively. Most of the study regions show a significant negative trend (p < 0.05). A decreasing trend in rainfall is also evident from the areal mean time series averaged over the entire study region (figure 2(c)). The two datasets show consistently strong negative anomalies falling since the 1990s. The regional mean rainfall declines significantly by −0.09 mm d−1 decade–1 (p < 0.01) for the period 1950–2014 from GPCC and by −0.21 mm d−1 decade–1 (p < 0.01) for the period 1979–2014 from GPCP. As the drying trend occurs from the late 1980s onward, we focus on the recent three decades in the remainder of the paper. The long-term drying seen over CEA seen from GPCC and GPCP is consistent with the findings presented in previous studies (Malhi and Wright 2004, Yin and Gruber 2010, Asefi-Najafabady and Saatchi 2013, Diem et al 2014, Zhou et al 2014).
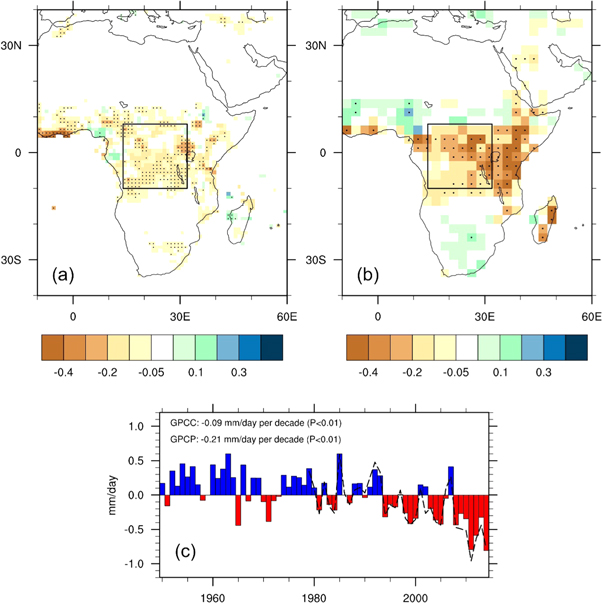
Figure 2. Spatial patterns of AMJ rainfall linear trend (mm d–1 decade–1) for (a) the period 1950–2014 from GPCC and (b) the period 1979–2014 from GPCP. The trends with solid dots are statistically significant at the 0.1 level. The rectangular box indicates the study region as shown in figure 1. (c) The areal mean AMJ rainfall anomalies (mm d–1) relative to the 1979–2000 base over the study region from GPCC (color bar) and GPCP (dash line). The rainfall linear trend (mm d–1 decade–1) and its statistical significance (p value) for each dataset are also shown.
Download figure:
Standard image High-resolution image3.2. Linkages with changes in large-scale circulation
To identify possible large-scale mechanisms driving the drying trend, we examine its linkage with internal dynamical processes and atmospheric-ocean interactions. It is well known that West African climate is strongly influenced by the West African monsoon (WAM) circulation (e.g., Thorncroft et al 2011). The large-scale pressure gradient between the hot thermal Saharan low and the cold Atlantic subtropical high leads to the southerly WAM flow from the ocean towards the land in spring and summer (Nicholson 2013). From the view of atmospheric circulation in the lower troposphere at 850 hPa, the St. Helena subtropical high located roughly 30°S creates winds parallel to the west coast of Africa (figure 3). For East Africa, the southeast flow from Indian Ocean is seen through the coast into the equatorial Africa which is strongly influenced by the presence of the subtropical high centered over Southern Africa and the Indian Ocean. Both the ERA-Interim and MERRA2 reanalysis capture the intertropical convergence zone and the subtropical high. Overall the two reanalysis data exhibit similar features of atmospheric circulation (figure 3).
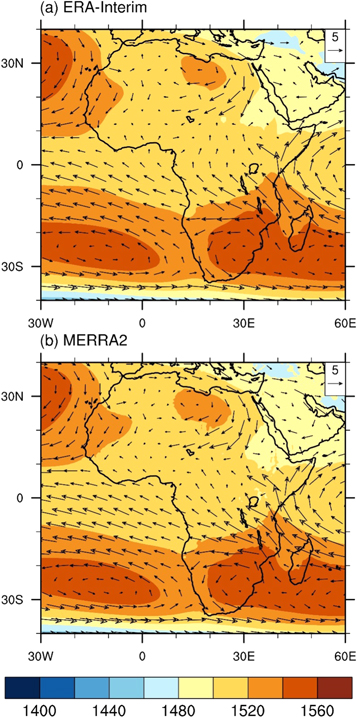
Figure 3. Spatial patterns of climatology of AMJ geopotential height (shading, gpm) and wind (vectors, m s–1) at 850 hPa from (a) ERA-Interim and (b) MERRA2.
Download figure:
Standard image High-resolution imageThe linear trend in the atmospheric circulation fields from the ERA-Interim reanalysis, including HGT and winds at 850 hPa are shown in figure 4. There are two anomalous high pressure centers across Africa during the recent decades. One is near the northwestern sector of the Congo Basin, and the other is centered over Southern Africa roughly around 15°S (figure 4(a)). The land-sea low-level pressure gradient is weakened between the African continent and the Atlantic Ocean, an indicator of a weaker monsoon flow (figure 4(c)) and a smaller meridional thermal gradient. This might induce a drying trend around the Central Africa. Comparing the dry versus wet period, an anomalous high pressure center and anti-cyclonic circulation in the lower troposphere are located in western Central Africa and near the Congo Basin (figure 4(e)). As discussed above, the AMJ drought over CEA is likely part of the large-scale atmospheric circulation changes (e.g., pressure and wind) induced by weaker monsoon circulation.

Figure 4. Spatial patterns of linear trend in AMJ 850 hPa geopotential height (gpm decade–1) for (a) ERA-Interim and (b) MERRA2. The trends with solid dots are statistically significant at the 0.01 level. (c), (d) same as (a), (b) but for AMJ 850 hPa wind (vectors, m s–1 decade–1) and zonal wind (shading, m s–1 decade–1). The composite differences in AMJ 850 hPa geopotential height (shading, gpm) and winds (vectors, m s–1): (e) 2000–2014 minus 1979–1993 averages from ERA-Interim, and (f) 2000–2014 minus 1980–1993 averages from MERRA2.
Download figure:
Standard image High-resolution imageNext we analyze the MERRA2 data to verify the above results. Figure 4(b) shows the trend analysis of HGT and winds at 850 hPa in the MERRA2 reanalysis. Eastern Central Africa is controlled by an anomalous high pressure center accompanied by anomalously easterlies around western Central Africa and the Cong Basin. The composite analysis indicates that an anomalous high pressure center and anti-cyclonic circulation in the lower troposphere are located in eastern Central Africa (figure 4(f)). The anomalous high pressure and associated east wind, which lead to descending motions and weaker monsoon circulation, reduce the rainfall over equatorial Africa, although the changes and locations of atmospheric circulation are somewhat different in the two reanalyses.
Rainfall over equatorial Africa is also largely influenced by the zonal (Walker) circulation (e.g., Nicholson and Grist 2003, Nicholson and Dezfuli 2013, Cook and Vizy 2016). The Walker circulation usually includes upward branches over the western Pacific warm pool (95°E–150°E), eastern Indian Ocean and equatorial Africa (e.g., the Congo Basin) and a downward branch over western boundary of Indian Ocean around 45°E–60°E (figures 5(a) and 6(a)). Figure 5(b) presents the AMJ linear trends of meridional mean (10°S–10°N) of vertical velocity (ω, 10−2 Pa s–1 decade–1) from the ERA-Interim reanalysis. The convective activity in equatorial Africa has declined as the upward branch of the Walker circulation has increased over the Indo-Pacific Ocean (figure 5(e)). Previous observational studies have indicated that the Walker circulation has strengthened during the late 20th century (Chen et al 2002, Minobe 2004, Ma and Zhou 2016). Williams and Funk (2011) found a westward extension of the Walker circulation as a result of an extension of the western edge of the tropical warm pool in the Indian Ocean. The intensification and westward extension of tropical Walker circulation is clearly seen when comparing meridional mean of vertical velocity during the wet period (figure 5(c)) to that of the dry period (figure 5(d)). Increased vertical ascent over the western Pacific warm pool is accompanied by decreased ascent over equatorial Africa. Hence an increase in subsidence across the western edge of Indian Ocean and a decrease in convection over the Congo Basin lead to the reduction in moisture transport and rainfall across CEA.

Figure 5. (a) Climatology of AMJ meridional mean (10°S–10°N) of vertical velocity (ω, Pa s–1) from ERA-Interim for the period 1979–2014. (b) Linear trends of the AMJ meridional mean vertical velocity (10−2 Pa s−1 decade–1) for the period 1979–2014. (c) Same as (a), but for the wet period 1979–1993. (d) Same as (a), but for the dry period 2000–2014. (e) Differences between the wet (c) and dry (d) periods. The tropical Indian Ocean ranges approximately from 50°E to 95°E, whereas the Pacific Ocean is located east of 120°E as indicated in (a).
Download figure:
Standard image High-resolution image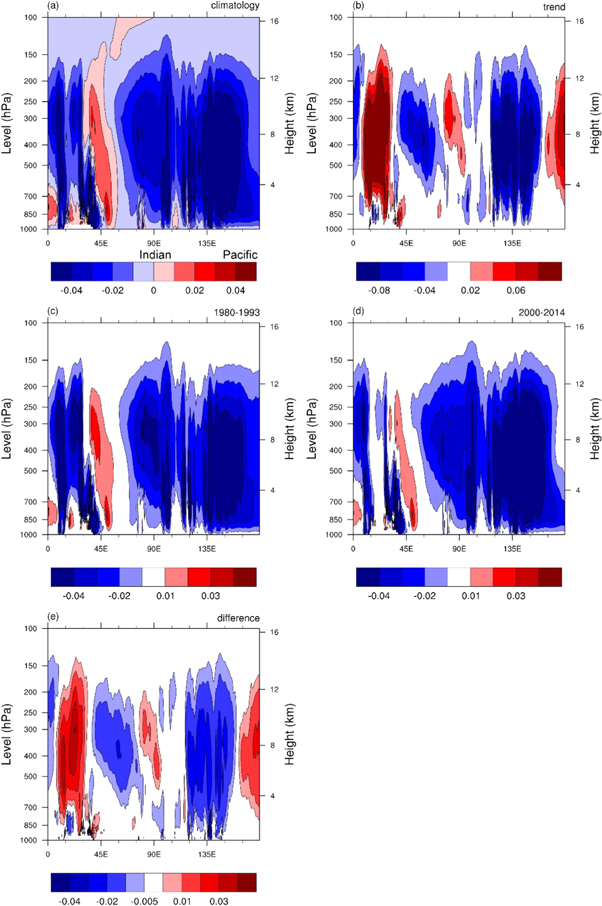
Figure 6. (a) Climatology of AMJ meridional mean (10°S–10°N) of vertical velocity (ω, Pa s−1) from MERRA2 for the period 1980–2014. (b) Linear trends of the AMJ meridional mean vertical velocity (10−2 Pa s−1 decade–1) for the period 1980–2014. (c) Same as (a), but for the wet period 1980–1993. (d) Same as (a), but for the dry period 2000–2014. (e) Differences between the wet (c) and dry (d) periods. The tropical Indian Ocean ranges approximately from 50°E to 95°E, whereas the Pacific Ocean is located east of 120°E as indicated in (a).
Download figure:
Standard image High-resolution imageWe similarly examine the zonal circulation cells using the MERRA2 analysis. The composite results are similar to those from the ERA-Interim reanalysis. The anomalies descend over the equatorial Africa when the Walker circulation strengthens over Indo-Pacific Oceans. Compared with the meridional mean of vertical velocity in 1980s (figure 6(c)), the intensification and westward extension of tropical Walker circulation and decreased ascent over equatorial Africa are evident in recent decades (figure 6(d)). Figure 6(b) displays the linear trend of AMJ meridional mean of vertical velocity. Increased subsidence across equatorial Africa and convection over warm pool over Pacific Ocean are also evident, resembling the results of the ERA-Interim reanalysis shown in figure 5(b). The main differences are the changes in zonal circulation cells over Indian Ocean (figures 5(e) and 6(e)).
The above results indicate that the long-term drying trend in AMJ over CEA is associated with the low-level atmospheric circulation changes (e.g., pressure and wind), including a weaker monsoon and the strengthening and westward extension of Indo-Pacific Walker circulation. Note that such changes in large-scale atmospheric circulation (figures 4(a) and (b)) are usually triggered by SSTs or other remote conditions/teleconnections (Dai 2011), which will be examined next.
3.3. Linkages with SST variations
SSTs in the Atlantic and Indian Oceans have large impacts on African rainfall through their influences on large-scale circulation (e.g., Hoerling et al 2006, Ting et al 2009). The pattern of diabatic heating caused by variations in SST in the equatorial regions exhibits strong departures from zonal symmetry. Such SST variations produce zonally asymmetric atmospheric circulation. The dominant cell is in the equatorial Pacific, i.e., the Walker circulation.
SSTs over the Indo-Pacific Oceans have increased 2–3 times faster than SSTs in the tropical central Pacific and convective activities have correspondingly increased over most of the warm pool and Indian Ocean in the 20th century (Williams and Funk 2011). The intensification and westward extension of tropical Walker circulation result partly from the rapid warming in the Indian Ocean and warm pool, which has effectively expanded the warm-pool westward and enhanced subsidence over equatorial Africa (Hoerling et al 2006, Williams and Funk 2011).
The AMJ SST trends from 1979 to 2014 suggest that western Pacific SSTs have increased faster than Indian Ocean SSTs, which may induce different responses in vertical velocity associated with the large-scale circulation over the Indian Ocean. It's important to note that SST trends exhibit an extensive warming in the western Pacific and a cooling in the central eastern Pacific (figure 7(a)). Previous studies have indicated that the El Niñ-like or La Niña-like patterns of the equatorial Pacific SST weaken or strengthen the zonal SST gradient and thus drive the weakening or strengthening of the tropical Pacific Walker circulation (e.g., Collins et al 2010, Solomon and Newman 2012, Ma and Zhou 2016). Figures 7(b) and (c) compare the SST anomaly differences between the wet and dry periods. The latter resembles the La Niña-like pattern, whereas the former is similar to an El Niño-like pattern. In response to the observed La Niña-like SST forcing, a strengthening and westward shift in tropical Pacific Walker circulation is apparent in the trends and composite differences (figure 7). This La Niña-like SST pattern is the dominant forcing to the enhanced and westward extended Walker circulation (Ma and Zhou 2016). On the other hand, the recent enhanced Atlantic warming may also modulate the CEA climate via changes in zonal circulation which needs further investigation (e.g., McGregor et al 2014). As discussed above, the drying trend over equatorial Africa results from the large-scale response of the atmosphere to tropical SST variations. The intensification and westward extension of the tropical Walker circulation lead to a reduction in the convective and rainfall over CEA.
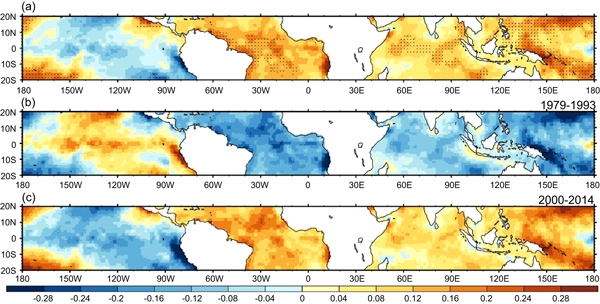
Figure 7. Spatial patterns of (a) linear trend of AMJ SST (°C decade–1) for the period 1979–2014. The trends with solid dots are statistically significant at the 0.01 level. AMJ SST anomalies (relative to the 1979–2014 mean) for the period (b) 1979–1993, (c) 2000–2014.
Download figure:
Standard image High-resolution imageSSTs modulate the rainfall variability not only via their direct and indirect impacts on atmospheric circulation, but also via their effects on moisture transport, which can be examined by the changes in moisture flux. Decreased convection over the Congo Basin leads to reduced moisture transport and thus reduced rainfall. At 850 hPa, the moisture flux converges over the Congo Basin but diverges over West Africa and the horn of Africa in the ERA-Interim (figure 8(a)). The MERRA2 reanalysis exhibit some small differences in the moisture flux climatology over the Congo Basin (figure 8(c)). The strong contrast in AMJ moisture flux in the wet and dry composites suggests that the subsidence flow associated with the reduced low-level moisture transport causes the drying trend over equatorial Africa (figures 8(b) and (d)).

Figure 8. (a) Climatological mean AMJ moisture flux (kg kg−1 m s−1) and divergence (contours: 10−8 kg kg−1 s−1) at 850 hPa for the wet period 1979–1993 from ERA-Interim. (b) Differences (2000–2014 minus 1979–1993 averages) in AMJ moisture flux (kg kg−1 m s−1) and divergence (contours: 10−8 kg kg−1 s−1) at 850 hPa from ERA-Interim. (c) Same as (a) but for the wet period 1980–1993 from MERRA2. (d) Same as (b) but for the differences (2000–2014 minus 1980–1993 averages) from MERRA2.
Download figure:
Standard image High-resolution image
4. Conclusions and discussion
CEA has experienced a long-term drying trend since the 1990s while similar droughts are absent in other tropical rainforests (Malhi and Wright 2004, Yin and Gruber 2010, Asefi-Najafabady and Saatchi 2013, Diem et al 2014, Zhou et al 2014). Here we explore possible mechanisms for this long-term drought by analyzing multiple sources of observations and reanalysis data. We examine the atmospheric circulations changes related to SSTs variations that control equatorial African rainfall. Our results indicate that the long-term drought during April through June (AMJ) over CEA may reflect the large-scale response of the atmosphere to tropical SST variations. The drought likely results primarily from SST variations over Indo-Pacific associated with the enhanced and westward extended tropical Walker circulation. This is consistent with the weakened ascent over Central Africa associated with the reduced low-level moisture transport.
SSTs affect rainfall variability directly and indirectly across Africa (Camberlin et al 2001, Balas et al 2007, Dezfuli et al 2015), suggesting non-linear SST-rainfall relationships. Increased Indo-Pacific SSTs modulate the tropical zonal circulation and thus reduce the convection and rainfall in equatorial Africa. Over the long-term, the drying trend is associated with rapid warming over Indian Ocean and warm pool (Hoerling et al 2006). Williams and Funk (2011) proposed that the intensification and westward extension of tropical Walker circulation is partly a result of the rapid warming in the Indian Ocean, which has effectively expanded the warm-pool westward from 60°E to 90°E and enhanced subsidence over the Horn of Africa during the period from 1900 to 2009. Tropical SSTs in other regions also have experienced obvious changes since 1979 (figure 7), with significant warming from the Atlantic to the Indo-western Pacific, and cooling in the central and eastern Pacific. These changes contribute to regional climate change through atmospheric teleconnections (Li et al 2016). Pacific SSTs variations (e.g., ENSO events) are highly correlated with rainfall over Central Africa (Camberlin et al 2001, Farnsworth et al 2011), and their impacts are modulated via changes in zonal winds and vertical motions over the Atlantic and Indian Oceans, i.e., the Pacific Ocean has indirect influence on African rainfall, as well as over the continent (Dezfuli and Nicholson 2013, Nicholson and Dezfuli 2013). The SST contrast between the western Pacific and the central and eastern tropical Pacific interacts with the large-scale circulation, with an enhanced and westward extended Walker circulation and La Niña-like SST changes. Ma and Zhou (2016) linked the recently intensified and westward extended Walker circulation with the increased zonal Pacific SST gradient induced by the La Niña-like SST change. Lyon and DeWitt (2012) proposed the tropical SST gradient strongly correlated with East Africa long rains, which is likely due to natural multi-decadal variability (Lyon et al 2014, Yang et al 2014). In contrast, the tropical Indian Ocean SST warming results likely from global warming due mostly to human activities (e.g., GHGs and aerosols) (e.g., IPCC 2013). On the other hand, whether the recent La Niña-like SST pattern is externally forced or internal variability is still unclear. Hence, the relative contribution of anthropogenic versus natural forcing on the observed long-term drought needs to be further investigated.
Due to limitations of observations over CEA, it is particularly advantageous to use reanalysis datasets in areas with data-scarcity and consistency among different reanalysis datasets helps to enhance our confidence on the changes in large-scale patterns in Africa. That's why we use multiple rainfall datasets and two state-of-the-art reanalysis (e.g., Lorenz and Kunstmann 2012). The differences among various reanalysis datasets have been widely discussed in many research areas including climatic variability and trends (e.g., Lin et al 2014, Naud et al 2014). Although the strength and location of atmospheric circulation are indeed somewhat different between the two reanalysis products over equatorial Africa, the large-scale atmospheric circulation patterns that determine the CEA drought are almost identical in both datasets. The atmospheric forecast models, assimilation algorithms, vertical and horizontal resolutions, and the methods by which satellite data are assimilated all contribute likely to the differences in atmospheric circulation and rainfall patterns (e.g., Lin et al 2014). Future work is needed to fully identify and such differences over our study region, which can benefit the scientific community through a better understanding of the strengths and weaknesses of reanalysis datasets over Africa.
Our results indicate that the recent equatorial African drying trend is primarily modulated by SSTs and the regional/global atmospheric circulation pattern. The synoptic and mesoscale systems and atmospheric jets are also known to govern and drive the rainfall variations and play an important role on hydrological processes (e.g., Nicholson and Grist 2003, Farnsworth et al 2011, Nicholson and Dezfuli 2013). How the jets interact with the convective system and the rain belt over Africa is also an open question in these areas. Given the uncertainties and complexities in the relationship between rainfall and atmospheric circulation associated with SSTs, further research with more observations and model sensitivity tests is needed to provide a full picture of mechanisms for long-term drying over equatorial Africa.
Acknowledgments
This study was supported by National Science Foundation (NSF AGS-1535426 and AGS-1535439). WH was jointly funded by the National Natural Science Foundation of China (41605034), the National Natural Science Foundation of Jiangsu Province (BK20160948) and the Natural Science Foundation for Higher Education Institutions in Jiangsu Province (16KJB170007) as well as project funded by the Priority Academic Program Development of Jiangsu Higher Education Institutions (PAPD).