

Abstract
In order to understand the rising number of flash floods and landslides in the densely populated region of southeastern Brazil, this study analyzes the spatial and temporal changes in precipitation from 1978 to 2014. We focus on the sensitivity of mountainous regions, specifically the Rio de Janeiro (RJMR) and Santa Catarina (SCMR) regions. Daily rainfall observations are aggregated into annual and seasonal indexes, and RClimdex is used to evaluate a suite of precipitation and extreme event indexes. Results show positive annual and seasonal precipitation trends during all seasons except for the winter season in the RJMR. Diverse change points in their time series, spatial differences in the trends at individual stations, and trends associated with elevation suggest that despite the close proximity of these two regions, climate impacts are not uniform across all of southeastern Brazil. The majority of precipitation-related indexes present positive trends, especially in the extreme precipitation indexes (PRCPTOT, RX1day, Rx5day and R30 mm). Statistically significant positive correlations are discovered between landslides/flash floods events and annual maximum 1-day and 5-day consecutive precipitation, and these indexes may be useful indicators of natural hazard events for this region.
Export citation and abstract BibTeX RIS

Original content from this work may be used under the terms of the Creative Commons Attribution 3.0 licence. Any further distribution of this work must maintain attribution to the author(s) and the title of the work, journal citation and DOI.
1. Introduction
Hydrological hazards such as flash floods, droughts, and landslides cause significant losses to the agriculture and hinder economic development throughout the world (e.g. Devereux 2007, Middleton and Sternberg 2013). Densely populated regions such as Brazil, Europe, and Asia have led government institutions to evaluate advanced and dynamic approaches to forecasting the severity of these events (McCright and Dunlap 2003, Bof et al 2013).
Natural hazards related to extreme weather events have severely impacted Brazil in the last 3 decades (Silva Dias et al 2013, Hummell et al 2016, Lorentz et al 2016). In particular, two events in southern Brazil are described as the region's worst weather tragedies in history. In January 2011, heavy rainfall sparked flash flooding and mudslides across the highlands of the state of Rio de Janeiro in southeastern Brazil. According to Brazilian official sources, the floods and mass movement claimed the lives of 916 people and left 35 000 people homeless (Marengo and Alves 2012). The second event also occurred in southern Brazil, affecting 1.5 million people in Santa Catarina State in November 2008. Flooding and deadly mudslides resulted in 120 casualties and left 69 000 people homeless (FBDS (Fundação Brasileira para o Desenvolvimento Sustentável) 2009). In 2011 in Brazil, more than 510 natural disasters were caused by water, resulting in approximately 1100 victims and affecting around 12.5 million people (Lorentz et al 2016)
Statistical methods and on-site observations have been used by decision makers to anticipate and alleviate the effect of natural hazards (Qing et al 2011, Zhang et al 2014, Anderson et al 2015, Chen et al 2015, Henn et al 2015, Zeng et al 2015). Insofar as flash floods and landslides are concerned, there is further need, however, to understand the link between these events and weather/climate variability in particular regarding decadal and inter-annual precipitation variability (frequency and magnitude). As King et al (2015) argue, precipitation extremes may differ dramatically in many locations in the near future, and are a remarkable threat to life and livelihoods of people because floods are the most frequent among all natural disasters (Kahn 2005). The number of reported extreme precipitation and related flood events has increased significantly over the last twenty years (Tanoue et al 2016, Silva Dias et al 2013, Boers et al 2014, Espinoza et al 2014). Mountainous areas have different characteristics (e.g., shape, extension, altitude, and vegetation cover), and vary greatly among climate regimes both spatially and temporally (Beniston 2003, Kohler and Maselli 2009, Skansi et al 2013, Tramblay et al 2013, Stephenson et al 2014, Wang and Li 2015).
The link between precipitation and these natural hazards are diverse in intensity and locations because localized extreme precipitation events occur within the context of changes in large-scale atmospheric flow. Indeed, several tropical and subtropical countries are vulnerable to shifts in precipitation patterns and related hydrological hazards, often affecting human life, health, food and water supplies, ecosystems, and infrastructure (Anderson et al 2015, Chadwick et al 2015).
In mountain regions, the causes of floods are complex and closely related to water conservancy facilities (e.g., dams, artificial lake) and soil structure (Wu et al 2015). Coastal mountainous regions often experience a combination of high moisture content in the lower atmosphere and forced ascent that creates thermodynamically unstable conditions and may result in torrential precipitation (Seluchi and Chou 2009). It has to be mentioned that under human induced climate conditions, such as expected in the future with increased greenhouse capacity of the atmosphere, precipitation events tend to be more intense and destructive.
This study focuses, therefore, on investigating trends in annual, seasonal, and daily extreme precipitation events and their link to landslides and flash floods in southeastern Brazil. This is justified by the fact that there is no consensus on the preferable temporal distribution of precipitation that may increase the risk of natural disasters. By evaluating precipitation indexes in distinct frequency (e.g. daily/pentadal/annually) we can provide additional insights on the relationship between precipitation events, floods and landslides.
The paper is structured as follows: section 2 describes our study regions and data. Section 3 demonstrates precipitation trends, illustrates the complex interaction between topographic features and the spatial weather/climate variability, and identifies key relationships between annual precipitation and extreme precipitation indexes that may be used in advanced warning systems of natural hazards. Finally, section 4 summarizes the results and discusses the implications of these findings.
2. Methodology
2.1. Study regions
Brazil's population is concentrated in the south and southeast of the country (Hummell et al 2016), especially in coastal regions such as the city of Rio de Janeiro in the state of Rio de Janeiro and Florianópolis in the state of Santa Catarina State. The two areas evaluated in this study, the Rio de Janeiro Mountain Region (RJMR) and the Santa Catarina Mountain Region (SCMR) (figure 1), are located in a geologic formation called the Serra do Mar. This mountain chain extends along the southeastern coastline of Brazil from Rio de Janeiro to Santa Catarina state, with some peaks exceeding 1000 m. Heavy rainfall with subsequent floods and landslides are frequent in this region (Seluchi et al 2011).

Figure 1. Geographical location of the (a) RJMR and the (b) SCMR and the distributions of meteorological stations (c)–(d) currently used in each region.
Download figure:
Standard image High-resolution imageThe RJMR (21.3–23.3 °S, 42.3°–43.3 °W) covers an area of 9.563 km2 and occupies 21.8% of the state (figure 1). With 108 people per km2 in 2010 (Brazilian Institute of Geography and Statistics (IGBE), www.ibge.gov.br/estadosat/). This densely populated area is governed by a warm and rainy climate (figure 2(a)) in summer (October–March) and mild, dry weather in winter (April–September) (Dereczynski et al 2013). Based on a network of 35 rain gauges for the period 1978–2014, the annual mean precipitation is estimated to be 1481 mm.

Figure 2. (a) Annual cycle of monthly precipitation over the RJMR and the SCMR during 1978–2014. (b) Population trends in the main municipalities over mountainous areas during 1970–2010. Data are from IBGE demographic censuses of 1950/2010 (http://seriesestatisticas.ibge.gov.br/).
Download figure:
Standard image High-resolution imageThe second evaluated region, the SCMR (26.3–29.0 °S, 52.0°–49.0 °W), covers an area of 22.232 km2 or 23.3% of the state's territory (figure 1). According to the IBGE, the population density in 2010 was 18 people per km2. Based on daily precipitation records at 27 meteorological stations during 1978–2014 the annual mean precipitation is 1652 mm, distributed more equally throughout the year compared to the RJMR, with no specific dry period (figure 2(a)).
The main differences between these two mountainous regions in climatic and social terms is the larger amplitude of the seasonal cycle (figure 2(a)) and higher population density in RJMR as compared to SCMR. Though, both regions have experienced more frequent occurrence of landslides and flash floods in recent decades that can be associated with extreme precipitation events.
According to figure 2(b), since the 1970 an increase of population in RJMR and a reduction of the population in SCMR has occurred. Higher urbanization in RJMR is related to implementation of high class condos due to its natural wonders and proximity to the coastline. This leads to migration of underprivileged people to RJMR to sell goods and all kind of products which are placed in vulnerable housing structured. In SCMR, on the other hand the highly complex topography as compared to RJMR has not been favorable to implementation of high class houses
Hummell et al (2016), and Lorentz et al (2016) indicate that poor populations are generally located in areas that commonly are hit by natural disasters, especially floods and landslides such as the RJMR. According to Lorentz et al (2016) such events are a consequence of natural environmental instability along with the increase in population, which raised the deforestation of native forest preservation areas, affecting the low-lying areas and watercourses by the transport of soil due to generation of erosion that exacerbates flooding.
2.2. Data and methods
The Brazilian National Water Authority (ANA; http://hidroweb.aneel.gov.br) provided daily precipitation data for 1978–2014. We calculated seasonal precipitation totals based on the austral seasons of summer (DJF), autumn (MAM), winter (JJA), and spring (SON). The altitudes of the selected stations (figure 1) range from 10 m to 1980 m in the RJMR and 80 m to 1200 m in the SCMR. In order to keep the record as complete as possible, we only analyzed stations with at least 90% of the data for the period. The percentage of missing data among the time series varied between 0% to 2.64% and 0.44 to 10% for the RJMR and SCMR, respectively. We used Multivariate Imputation by Chained Equations technique (van Buuren and Groorthuis-Oudshoorn 2011, Costa et al 2012, Lopo et al 2014, Silva dos et al 2014) to impute any remaining missing data.
The RClimdex was developed by Zhang and Yang (2004) to indicate extreme events related to temperature, and precipitation. The RClimdex has been supported by the Expert Team on Climate Change Detection and Indexes (ETCCDI; http://etccdi.pacificclimate.org/). It has been widely used to quantify heat waves, drought, torrential and accumulated precipitation amount (e.g. Skansi et al 2013, Stephenson et al 2014, Wang and Li 2015).
The data quality control was achieved by using the RHtest V3 (Wang and Feng 2010), which identifies step changes in a time series by comparing the fit of a two-phase regression model with that of a linear trend for the entire series (Wang et al 2010). The procedure detects shifts in differences between the time series of the monthly mean precipitation anomalies of a candidate station and those of a three neighboring stations (Stephenson et al 2014). Testing indicated that the precipitation data used does not show significant biases, resulting in 35 and 27 stations in the RJMR and SCMR, respectively (figure 1).
We used the nonparametric Mann–Kendall (M-K) test (Mann 1945, Kendall 1975) for trend analysis. Additionally, the Sen Estimator was applied to estimate the linear trend (Sen 1968). The combination of the M-K test and Sen Estimator has been successfully used in many climate studies (You et al 2011, Dereczynski et al 2013, Skansi et al 2013, Tramblay et al 2013). Long-term climate records may exhibit regimes shifts, as once dominant patterns are altered due to natural or anthropogenic causes (Parmesan and Yohe 2003, King et al 2015). Therefore, we used the Pettitt test (Pettitt 1979) to detect abrupt change points in the time series of precipitation and indexes. A similar approach has been applied to identify regional trends and change points in Asia (Chen et al 2015, Duan et al 2015, Wang and Li 2015, Wu et al 2015).
The database used to characterize floods and landslides is based on the Brazilian Atlas of Natural Disasters between 1991–2012 (http://150.162.127.14:8080/atlas/atlas.html). This atlas compiles and provides information on registered disasters in Brazil by integrating historical records, enabling analysis of frequency, trends, and with the use of climate data can shed light on the relationship between extreme precipitation and natural disasters (Gutiérrez et al 2014). In regard to the reliability of the flash floods and landslides as documented in the Atlas, it has to be noted that certainly in the past the region coverage was less representative when compared to current conditions.
In order to determine the most representative indexes, we explored the correlation between catastrophic extreme events and the climate extremes indexes. We used only stations that are located in mountainous regions, because the landslides/flash floods events have occurred on smaller regional or local scales.
Consequently, six extreme precipitation indexes are selected (table 1), namely: the annual total wet day precipitation (PRCPTOT), annual highest daily precipitation (RX1day) and annual highest 5 consecutive daily precipitation (RX5day), the wet days (NW), the number of days with daily rainfall above 30 mm (R30 mm) and the consecutive wet days (CWD-daily rainfall greater-than or equal to 1 mm).
Table 1. Definitions of the six selected extreme precipitation indices.
| Indices | Description | Units |
|---|---|---|
| PRCPTOT | Annual total precipitation in wet days | mm |
| RX1day | Annual maximum 1-day precipitation | mm |
| RX5day | Annual maximum consecutive 5-day precipitation | mm |
| NW | Annual count of day when RR ≥ 1 mm | days |
| R30 mm | Annual count of day when RR ≥ 30 mm | days |
| CWD | Maximum number of consecutive days with RR ≥ 1 mm | days |
RR is the daily precipitation amount on a wet day.
It has to be noticed that high value of Rx1day, Rx5day and CWD may indicate potential susceptibility of a region to experience flood and landslides (Aristizábal et al 2011, Diakakis 2012, Liu et al 2014, Wu et al 2015).
The index PRCPTOT and the annual mean precipitation (AMP) also analyzed in section 3.1 differ because the PRCPTOT represents an annual total precipitation in wet days (RR ≥ 1 mm), whereas AMP includes the accumulated precipitation in dry days (RR < 1 mm) as well.
In addition, we calculated differences between annual value of RX1day, RX5day and AMP and their repective mean values for individual station. We used the anomaly/difference to avoid the average series being dominated by those stations with high variability (Duan et al 2015 and Wang et al 2016).
Finally, we computed Pearson's coefficients of correlation (r) to identify statistical links between extreme precipitation indexes and the altitude of stations, and hydrological hazards.
3. Results and analysis
3.1. Annual and seasonal precipitation
Figure 3 (red line) shows the seasonal precipitation trends for the RJMR. Positive trends are found for the annual (30.67 mm decade−1), summer (4.95 mm decade−1), autumn (12.16 mm decade−1), and spring (12.20 mm decade−1) time series, while a negative trend is found for winter (−2.90 mm decade−1). The positive trend in annual precipitation is the result of increasing autumn and spring precipitation. Although the M-K test reveals that none of these trends are statistically significant at p < 0.1, it is important to note that these trends implicate an enhanced amplitude of the seasonal cycle with wetter (dryer) conditions in the rainy (dry) season (Solman et al 2013, da Rocha et al 2014).

Figure 3. Inter-annual variation of seasonal precipitation over the RJMR and the SCMR from 1978 to 2014. T and P show magnitude trends and statistically significance.
Download figure:
Standard image High-resolution imageFor the SCMR (figure 3; black line); the annual total precipitation increased at a rate of 72.05 mm decade−1, in agreement with positive trends in all seasons (though not significant at p < 0.1). Discussion on the potential climate mechanisms related to the observed trends in precipitation is presented in the upcoming sections.
Box and whisker plots (figure 4(a)) further demonstrate the variability of linear trends for all 35 and 27 stations in the RJMR and SCMR during 1978–2014. Figure 4(a) shows that annual precipitation trends in the RJMR region (red box) vary widely with magnitudes between −161.68 and 382.85 mm decade−1. Summer and autumn similarly show large variations in precipitation trends, while winter and spring (drier seasons) show smaller ranges in their trends. About 60% of stations show positive trends in annual precipitation with 17% of stations demonstrating significant positive trends (figure 4(b)).
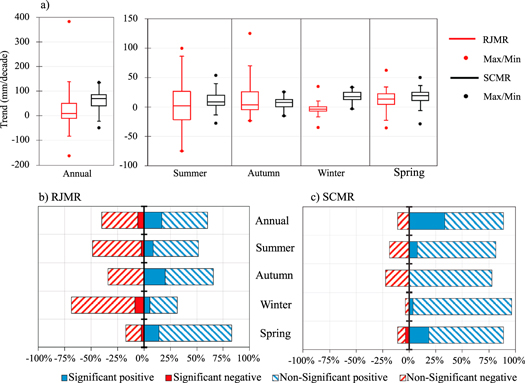
Figure 4. (a) Annual and seasonal variability of precipitation linear trends over the RJMR (1) and the SCMR (2). (b)–(c) Percentage of stations with positive and negative trends out of the total examined stations.
Download figure:
Standard image High-resolution imageFor summer, autumn and spring, the majority of RJMR stations show positive trends with a small percentage of those trends being significant. Interestingly, during the winter season downward trends are present in roughly 70% of the stations with approximately 10% of those representing significant negative trends (figure 4(b)). This is well correlated with more frequent La Nina-like SST patterns in the Niño 3.4 region during JJA and increased atmospheric blocking in the South Atlantic (Clem and Fogt 2015).
The SCMR stations (black box; figure 4(a)) experience smaller spatial variation compared to RJMR, with annual precipitation trends between −49.08 and +134.72 mm decade−1. However, more than 85% of stations have increasing annual trends with 33% stations showing significant positive trends (figure 4(c)). The seasonal variability is similar to the annual variation insofar as the amplitude of the spatial distribution is concerned, with all seasons showing large percentages of positive trends (75%–95% show in figure 4(c)). Significant seasonal trends in the SCMR are dominant in spring (19%). Though many of the positive trends are not significant during winter and spring, the overwhelming number of positive trends is still concerning, as recurrent precipitation in short intervals from September to March may be linked to landslides and increased loss of life (Seluche and Chou 2009).
According to the Pettitt test, despite the close proximity of these two regions they exhibit different change points in annual and seasonal precipitation time series. For instance, the seasonal time series reveal abrupt shifts in the RJMR (SCMR) in summer 2001 (1991), autumn 2003 (1982), winter 1990 (2010), and spring 1994 (1996). While some of these years correspond to ENSO events (1982, 2001, and 1996), additional climate/weather drivers such as South Atlantic SST variability must be considered as potential sources related to modification in precipitation trends (Diaz et al 1998, Barreiro 2010, Cavalcanti et al 2015).
3.2. Extreme precipitation indexes and regional trends
The annual total precipitation in wet days (PRCPTOT) largely increased in the RJMR (figures 5(a) and 6(a)) and the SCMR (figures 5(b) and 6(g)), with positive trends in ∼60% and ∼90% of the stations, respectively. Similar results are found for daily thresholds of RX1day and RX5day, with positive trends in the majority of stations. All four annual count precipitation thresholds show positive trends in most stations for the SCMR. Moreover, light precipitation days (NW) shows more negative trends in the RJMR stations.
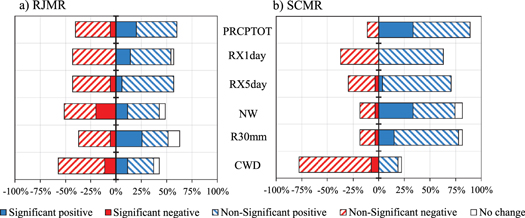
Figure 5. Precipitation indices-based percentage of stations with positive, negative and stationary trends out of the total stations examined over the (a) RJMR and the (b) SCMR during 1978–2014.
Download figure:
Standard image High-resolution image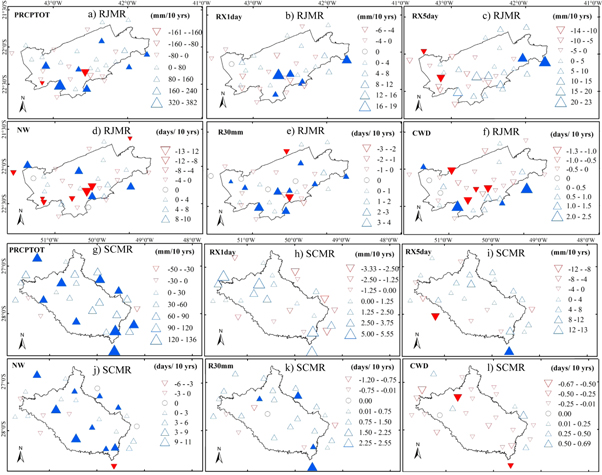
Figure 6. Spatial distribution for M-K trends of precipitation indices in the RJMR (a)–(f) and SCMR (g)–(l) during 1978 to 2014. Positive/negative trends are shown as up/down triangles; the filled triangles are related to statistically significant trends (significant at the 10% level) and circle indicated no change trends.
Download figure:
Standard image High-resolution imageThe maximum number of consecutive days with precipitation ≥1 mm (CWD) displays a downward trend in 57% and 78% of the stations for the RJMR and SCMR, respectively (figures 5(a), (b) and 6(f)–(l)). In summary, both regions have been experiencing greater rainfall, but this precipitation is occurring in heavier downpours and especially in the RJMR, with fewer consecutive wet days.
The PRCPTOT, RX1day, RX5day and R30 mm showed an increase trends in more than 50% of the stations (figures 5(a) and 6(a)–(f)), located predominantly in the southeastern part of the RJMR. Over the SCMR (figures 5(b) and 6(g)–(i)), 60% of stations experience positive trends for PRCPTOT, RX1day, Rx5day, NW and R30 mm. It has to be noted that the PRCPTOT, RX1day, Rx5day increase is prominently depicted in December–January–February (DJF). These results are in line with previous findings based on daily precipitation on regional (Barros et al 2008, Skansi et al 2013) and local scale (Derezcynski et al 2013, Pinheiro et al 2013).
In order to verify whether the extreme precipitation indexes have a connection with the change of annual total precipitation (AMP), Pearson's correlation coefficients between AMP and extreme precipitation indexes are shown in table 3. AMP and extreme precipitation indexes correlate significantly (p < 0.01) for all indexes, with values between 0.53 and 1.00. More importantly, the correlation coefficients between AMP and the number of heavy precipitation days (R30 mm) show significantly higher correlations, with values between 0.93 and 0.96. These results agree with those obtained by You et al (2011) and Wang and Li (2015).
This indicates that heavy, short interval precipitation is a more significant driver of annual precipitation, and highlights the susceptibility of the RJMR to experience flash flooding and landslides. Similarly, correlations in the SCMR are statistically significant (p < 0.1) for all indexes. For RX5day higher correlation (r = 0.82) in the SCMR is delivered in comparison to RJMR, which suggests that although the precipitation is mainly occurring in heavier downpours, the events are of longer duration in the SCMR.
It has to be noted, however, that trends in precipitation are not uniformly distributed over both regions. In fact, spatial patterns may be related to elevation and land cover, as discussed below and shown in figure 7. In the RJMR, there is a tendency for decreasing (increasing) trends of precipitation in stations at higher (lower) elevations for all seasons. The strongest correlations are significant (p < 0.10) in autumn (r = −0.38) and winter (r = −0.46), but are weaker in spring (r = −0.31) and absent in summer (r = −0.07). This suggests that topography plays an interactive role with weather dynamics, particularly in autumn and winter in the RJMR (figures 8(b) and (c)).

Figure 7. Magnitude trends of the seasonal precipitation amount related to elevation. r stands for correlation coefficients and p for statistical significance. The dashed line is the zero trend line. The circles and triangles indicated trends in each station for the RJMR and the SCMR, respectively.
Download figure:
Standard image High-resolution image
Figure 8. Magnitude trends of precipitation based indices related to elevation. r stands for correlation coefficients and p for statistical significance. The dashed line is the zero trend line. The circles and triangles indicated trends in each station for RJMR and SCMR, respectively.
Download figure:
Standard image High-resolution imageThe correlation coefficients are close to zero and not significant for all seasons in the SCMR, revealing that mesoscale processes play a secondary role when compared to the RJMR, where the land-sea breeze dominates during autumn and winter. In summer however, large-scale dynamics related to frontal systems and the presence of the South Atlantic Convergence Zone produces precipitation that is distributed throughout southeastern Brazil (Cavalcanti et al 2015).
Figure 8 shows the relationship between elevation and the trends in precipitation indexes. With the exception of NW, both the RJMR and SCMR regions reflect negative correlations between increasing elevation and the precipitation indexes, though not significant at 0.10. The relationship is more robust in the RJMR as statistical significance (p < 0.10) is achieved for PRCPTOT. Moreover, the regional trend demonstrated by RX1day and RX5day indicates that extreme precipitation events have occurred mainly at lower altitudes between 10–300 m (table 2). This is reasonable because the amount of precipitation water will be larger at these levels. The sea-breeze circulation coupled to the valley to mountain flow that penetrates inwards to the Rio the Janeiro plateau, further interacts with the urban heat island frequently triggering convective storms (Freitas et al 2007, Dereczynski et al 2013, Silva Dias et al 2013).
Table 2. Spatially averaged trend of precipitation indices in categorized elevation.
| Altitude (m) | 10–300 | 300–600 | 600–900 | 900–1200 | 1620–1980 | |
|---|---|---|---|---|---|---|
| RJMR | Percentage of stations (%) | 37 | 23 | 23 | 11 | 6 |
| SCMR | 11 | 30 | 22 | 37 | — | |
| RJMR | PRCPTOT (mm/decade) | 44.56 | 59.44 | −2.92 | −12.29 | 37.60 |
| SCMR | 129.08 | 59.49 | 63.10 | 64.14 | — | |
| RJMR | RX1day (mm/decade) | 3.76 | 0.37 | 2.40 | 1.63 | −2.67 |
| SCMR | 2.57 | 0.49 | 1.88 | 1.04 | — | |
| RJMR | RX5day (mm/decade) | 3.60 | 0.57 | 2.80 | 0.72 | 2.80 |
| SCMR | 9.66 | 1.75 | 3.27 | 0.07 | — | |
| RJMR | NW (days/decade) | −0.69 | 2.24 | −1.38 | 1.06 | −6.04 |
| SCMR | 0.95 | 1.72 | 2.24 | 4.70 | — | |
| RJMR | R30 mm (day/decade) | 0.47 | 0.51 | 0.17 | 0.16 | 0.69 |
| SCMR | 1.67 | 0.68 | 0.52 | 0.88 | — | |
| RJMR | CWD (days/decade) | 0.44 | 0.33 | −0.17 | −0.42 | 0.01 |
| SCMR | 0.00 | −0.07 | −0.06 | −0.22 | — | |
The elevation band with maximum magnitude is highlighted in light gray cells; trends marked in bold are statistically significant at the 0.1 level.
Table 3. Pearson´s correlation coefficients of precipitation indices.
| PRCPTOT | RX1day | RX5day | NW | R30 | CWD | ||
|---|---|---|---|---|---|---|---|
| RJMR | AMP | 1.00 | 0.53 | 0.58 | 0.90 | 0.93 | 0.80 |
| SCMR | 1.00 | 0.63 | 0.82 | 0.89 | 0.96 | 0.55 |
Correlation marked in bold are statistically significant at the 0.01 level.
In the next elevation band (300–600 m), positive values for each index are found in the RJMR and in exception of CWD for all indexes over the SCMR (table 2). As elevation increases, mean trends decrease but increases in the highest elevations in the RJMR.
These results highlight the complexity of precipitation in mountainous regions with a high level of spatial distribution and temporal variability (Basist et al 1994, Rangwala and Miller 2012, Zhang et al 2014, Chen et al 2015). Furthermore, urbanization, deforestation, and other land-use aspects are likely to vary in the future, which may subsequently induce distinct change in the spatial distribution of precipitation extremes (Ghosh et al 2011, King et al 2015).
3.3. Potential climate mechanisms related to precipitation changes
The understanding of causes of modified temporal and spatial distribution of precipitation in RJMR and SCMR, and at some extent in South America is fundamental to anticipate and mitigate the current and future potential threat posed by extreme precipitation events to the local community. Precipitation in the southern part of Brazil is influenced by numerous climate/weather mechanisms from daily to inter-annual timescales (e.g. Mechoso et al 2005, Raia and Cavalcanti 2008, Liebman and Mechoso 2011).
This includes the South American monsoon (Bombardi and Carvalho 2009), mesoscale convective systems related to the South American low-level jet (Salio et al 2007), variability in the South American Convergence Zone (ZCAS Silva Dias et al 2013), and recently to the atmospheric-oceanic coupling in the western tropical Pacific (Anji et al 2015)
Mendes and Cavalcanti (2014) argue that increased atmospheric blocking in the South Atlantic, with persistent and stationary frontal systems, has lead to an increase in precipitation in this region. Clem and Fogt (2015) link the recent positive trend in surface pressure in the South Atlantic to the influence of more frequently cooling conditions in the equatorial Pacific. Intensified pressure system over the South Atlantic hampers the migration of low pressure system from subtropics, reducing precipitation.
In order to address changes in precipitation we analyzed the correlations between precipitation over the RJMR and SCMR and several climate indexes. These included the Caribbean SST Index (CAB Penland and Matrosova 1998), the Atlantic Meridional Mode (AMM, Chiang and Vimont 2004), the Niño 3.4 SST index and its 3-month running mean (Oceanic Niño Index (ONI)). The ONI mainly characterized the occurrence of El Niño or La Niña episodes. The spatially averaged mean sea level pressure over two centers of action in South America and the South Atlantic (Mechoso et al 2005). SCMR precipitation is well correlated with the ONI and AMM, but a weak relationship is found with CAB and the pressure dipole in South America and South Atlantic. ONI is correlated with precipitation in the SCMR most of the annual cycle, whereas the AMM is a stronger driver from June to December. Thus, trends in precipitation seem not to be related to variations in the monsoon intensity.
A similar evaluation for the RJMR reveals that the AMM, CAB and the ONI are likely to play a substantial role in driving the precipitation variability. SST changes in the Caribbean, which are significantly correlated with the AMM, are associated with the modification of the northeast trade winds such that precipitation in South America is severely limited when the trade winds are weak (Marengo and Espinoza 2016). Weak trade winds reduce the amount of water vapor that is advected into the region. With limited moisture advection, the intensification of cold fronts near the RJMR and the formation of the ZCAS is tempered (Raia and Cavalcanti 2008).
3.4. Precipitation indexes and hydrological hazards
Figure 9(a) shows that 49 landslides and 97 flash floods were reported in the RJMR; and that 179 flash floods occurred in the SCMR from 1991 to 2012. Only two events of landslides were presented in the SCMR. In the RJMR the time series are characterized by statistically significant (p < 0.1) upward trends, in flash floods (5.0 events decade−1) and landslides (2.2 events decade−1). In the SCMR (figure 9(b)), flash floods show positive trend of 1.2 events decade−1, though not significant at p < 0.1 (figure 9(b)).

Figure 9. Correlation relationship between regional annual anomaly for extreme indices (RX1day and RX5day; bars) and extreme disaster events: (a) RJMR, (c) SCMR and (b) Temporal distribution of RX5day index and point of discontinuity detected using the Pettitt test. The black and gray lines are the averages of the index before and after the point.
Download figure:
Standard image High-resolution image
It has also been found positive Pearson's correlations between hydrological hazards and RX1day and RX5day (p < 0.1) in RJMR. The correlation coefficients between these indexes and the landslides were 0.49 and 0.59 for RX1day and RX5day, respectively; the coefficients for flash floods were 0.50 (RX1day) and 0.40 (RX5day). The time series of the hydrological hazards in RJMR are characterized by low frequency events prior to 2000, but a substantial increase in flash floods and an upward trend in landslides thereafter (figure 9(a)). Furthermore, the large majority of landslides and flash floods occurred in 2007, 2010 and 2012, in phase with positive anomalies of the RX1day and RX5day (figure 9(a)).
It is worth noting that for the years 2004, 2005 and 2009 the anomalies do not fit the disasters, but in these years the accumulated annual precipitation was 15% higher than the average. Figure 9(b) shows that a point of abrupt change in the RX5day index occurs in 2006 in RJMR. This increase in RX5day turns the RJMR in a region prone to floods and mass movements.
Differently from what has been found for RJMR, flash floods have been frequent in SCMR (Nunes and Silva 2013). Figure 9(c) shows severe flood events in 1993, 1997, 1998, 2001, 2009, 2010 and 2011. In this study, RX1day and RX5day captured these extreme years. Pearson's correlation coefficients between flash flood and extreme precipitation indexes are correlated significantly (p < 0.01), with values up to 0.62 (RX1day) and 0.60 (RX5day).
The RX1day and RX5day properly match changes in hydrological hazards demonstrating that anticipation of their value may be potentially used for natural hazards forecast.
It is important to note that the indexes (RX1day and RX5day) used in this study are only related to precipitation and characterize only the reality of the region. By using indexes that also integrates environmental and socioeconomic criteria, improvements can be expected insofar as higher correlations are desired.
4. Discussion and concluding remarks
One of the major problems in mountainous regions such as the Andes, Asia, Northern America and Europe, are damages caused by floods and landslides that are directly related to very intense rainfall and can be responsible for substantial socioeconomic impacts (Gaume et al 2009, Aristizábal et al 2011, Diakakis 2012, Zandonadi et al 2015). These events in Brazil have been responsible for loss of life and have seriously affected the livelihoods of survivors (Silva Dias et al 2013, Valverde and Marengo 2014, Zandonadi et al 2015).
In this study, the majority of precipitation-related indexes present positive trends, especially in the extreme precipitation indexes (PRCPTOT, RX1day, Rx5day and R30 mm). Similar to previous studies across South America (Alexander et al 2006, Haylock et al 2006, Skansi et al 2013), it has been demonstrated that precipitation intensity has increased in most recent years. Regional averages of the annual precipitation in the RJMR and SCMR exhibit positive trends as well. Furthermore, we found an increasing trend in seasonal timescales in the SCMR. In the RJMR, a downward precipitation trend is found only for winter.
We have suggested a number of mechanisms that may be responsible for trends in precipitation in this region including changes in atmospheric circulation (Mendes and Cavalcanti 2014, Clem and Fogt 2015), the South American monsoon (Bombardi and Carvalho 2009), and others (Salio et al 2007, Silva Dias et al 2013). Further investigation on the atmospheric dynamics involved will likely demand modeling simulations and will be addressed in future work.
In both regions, higher values of RX1day and RX5day are currently associated with and are likely to lead to future severe landslides and flash floods. It should be noted that although several extreme indexes have been correlated with hydrological hazards, there may be other non-linear interactions and causes as well. Thus, precipitation indexes should be analyzed under distinct time intervals such as between 1–5 days, and in larger periods (e.g 30 days), because in most cases the soil water capacity is not achieved by a single precipitation event. This approach increases the ability for indicating potential formation of landslides and flash floods.
The RJMR and SCMR are typical longitudinal mountains that are influenced by topographic differences. Rainfall distributions have not only lateral differences but also variations with altitude. Comparisons between precipitation indexes in these regions reveal distinct elevation characteristics with upward (downward) trends are most significant at low (high) altitudes. This indicates enhanced moisture availability at the lower troposphere allowing increased precipitation. On the other hand, in mountain peaks, precipitation events (in some cases snowfall) should become less frequent affecting human life by inducing changes in the production of crops, water availability that can result in food insecurity.
Thus, natural disaster early warning, improvement of disaster prevention, and mitigation capability should be urgently posed in order to reduce the impact of these natural disasters on civilians. In this sense, results presented can be utilized by decision makers to establish initial thresholds for preventive measures.
Importantly, this work demonstrates that although the annual and seasonal trends in precipitation do not reach certain statistical thresholds, their impacts on the environment are severe with increased trends in landslides and flash flooding events. Thus, recent positive trends in precipitation in general and in heavier events specifically pose tangible, dangerous threats to human life despite the lack of statistical significance.
Acknowledgments
The authors would like to thank the Universidade Federal de Viçosa. This work was supported by Coordination for the Improvement of Higher Education Personnel (CAPES) and to the Minas Gerais Research Foundation (FAPEMIG), agencies for promoting scientific and technological research in Brazil. The lead author expresses his gratitude to National Water Agency (ANA, Portuguese: Agência Nacional de Águas) that provided the data used in this work. This is Contribution 1560 of the Byrd Polar and Climate Research Center.